

Time and spatially resolved tracking of the air quality in local public transport
- PMID: 35228615
- PMCID: PMC8885640
- DOI: 10.1038/s41598-022-07290-5
Time and spatially resolved tracking of the air quality in local public transport
Abstract
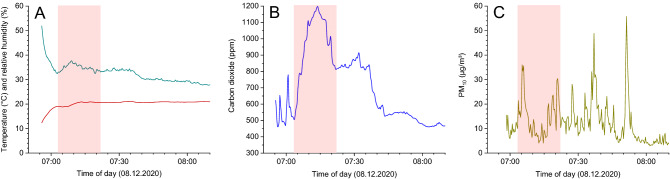
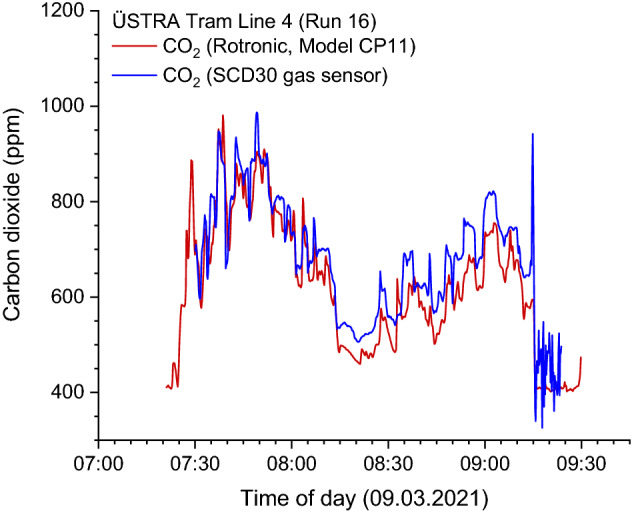
As an indoor environment, public transport is subject to special conditions with many passengers in a comparatively small space. Therefore, both an efficient control of the climatic parameters and a good air exchange are necessary to avoid transmission and spread of respiratory diseases. However, in such a dynamic system it is practically impossible to determine pathogenic substances with the necessary temporal and spatial resolution, but easy-to-measure parameters allow the air quality to be assessed in a passenger compartment. Carbon dioxide has already proven to be a useful indicator, especially in environments with a high occupancy of people. Airborne particulate matter can also be an important aspect for assessing the air quality in an indoor space. Consequently, the time courses of temperature, relative humidity, carbon dioxide and particulate matter (PM10) were tracked and evaluated in local public transport buses, trams and trains in the Brunswick/Hanover region. In all measurements, the climatic conditions were comfortable for the passengers. Carbon dioxide was strongly correlated with occupancy and has proven to be the most informative parameter. The PM10 concentration, however, often correlated with the dynamics of people when getting on and off, but not with the occupancy. Sensors, equipped with integrated GPS, were installed in the passenger cabins and were found to be useful for recording location-related effects such as stops. The results of this study show that the online recording of simple parameters is a valuable tool for assessing air quality as a function of time, location and number of people. When the occupancy is high, a low carbon dioxide level indicates good ventilation, which automatically reduces the risk of infection. It is therefore recommended to take more advantage of low-cost sensors as a control for air conditioning systems in passenger cabins and for evaluations of the dynamics in public transport.
© 2022. The Author(s).
Conflict of interest statement
The authors declare no competing interests.
Figures
Similar articles
-
Concentrations of particulate matter, carbon dioxide, VOCs and risk assessment inside Korean taxis and ships.Environ Sci Pollut Res Int. 2019 Apr;26(10):9619-9631. doi: 10.1007/s11356-019-04361-5. Epub 2019 Feb 7. Environ Sci Pollut Res Int. 2019. PMID: 30729441
-
The impact of the congestion charging scheme on air quality in London. Part 1. Emissions modeling and analysis of air pollution measurements.Res Rep Health Eff Inst. 2011 Apr;(155):5-71. Res Rep Health Eff Inst. 2011. PMID: 21830496
-
Indoor Air Quality in Urban and Rural Preschools in Upper Silesia, Poland: Particulate Matter and Carbon Dioxide.Int J Environ Res Public Health. 2015 Jul 8;12(7):7697-711. doi: 10.3390/ijerph120707697. Int J Environ Res Public Health. 2015. PMID: 26184249 Free PMC article.
-
Indoor air pollution and exposure assessment of the gulf cooperation council countries: A critical review.Environ Int. 2018 Dec;121(Pt 1):491-506. doi: 10.1016/j.envint.2018.09.043. Epub 2018 Oct 1. Environ Int. 2018. PMID: 30286426 Free PMC article. Review.
-
What is the relationship between indoor air quality parameters and airborne microorganisms in hospital environments? A systematic review and meta-analysis.Indoor Air. 2021 Sep;31(5):1308-1322. doi: 10.1111/ina.12846. Epub 2021 May 4. Indoor Air. 2021. PMID: 33945176
Cited by
-
The Control of Metabolic CO2 in Public Transport as a Strategy to Reduce the Transmission of Respiratory Infectious Diseases.Int J Environ Res Public Health. 2022 May 28;19(11):6605. doi: 10.3390/ijerph19116605. Int J Environ Res Public Health. 2022. PMID: 35682191 Free PMC article.
-
Airborne infections related to virus aerosol contamination at indoor cultural venues: Recommendations on how to minimize.Public Health Chall. 2023 Jan 20;2(1):e59. doi: 10.1002/puh2.59. eCollection 2023 Mar. Public Health Chall. 2023. PMID: 40496945 Free PMC article. Review.
-
A Low-Cost IoT Sensor and Preliminary Machine-Learning Feasibility Study for Monitoring In-Cabin Air Quality: A Pilot Case from Almaty.Sensors (Basel). 2025 Jul 21;25(14):4521. doi: 10.3390/s25144521. Sensors (Basel). 2025. PMID: 40732649 Free PMC article.
References
Publication types
MeSH terms
Substances
LinkOut - more resources
Full Text Sources
Medical
Research Materials
