. 2022 Jun;21(6):627-633.
doi: 10.1038/s41563-022-01203-7. Epub 2022 Feb 28.

Superconductivity in (Ba,K)SbO3

Affiliations

Superconductivity in (Ba,K)SbO3

Minu Kim et al. Nat Mater. 2022 Jun.

Abstract

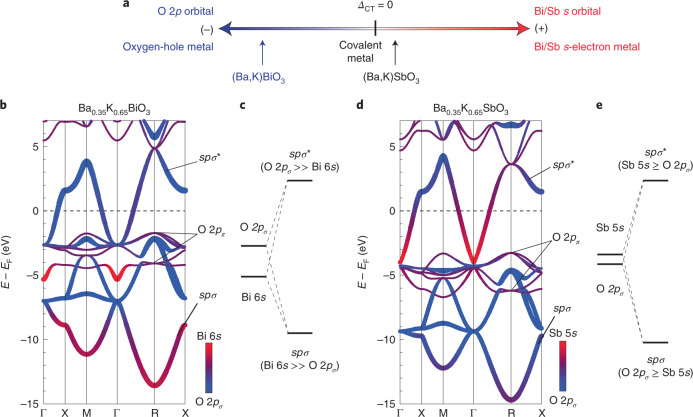
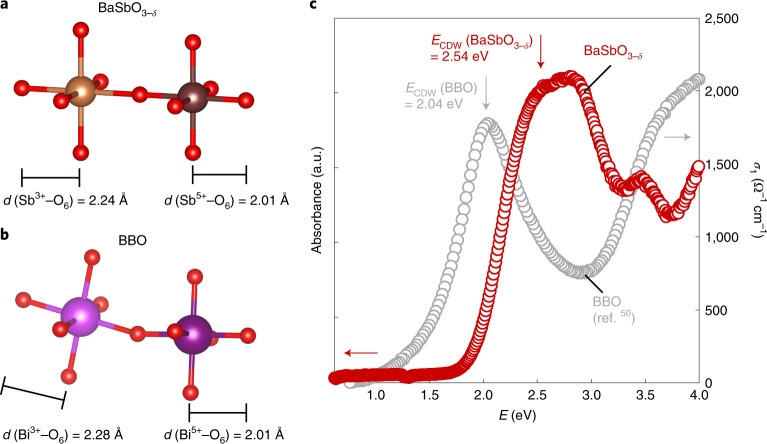
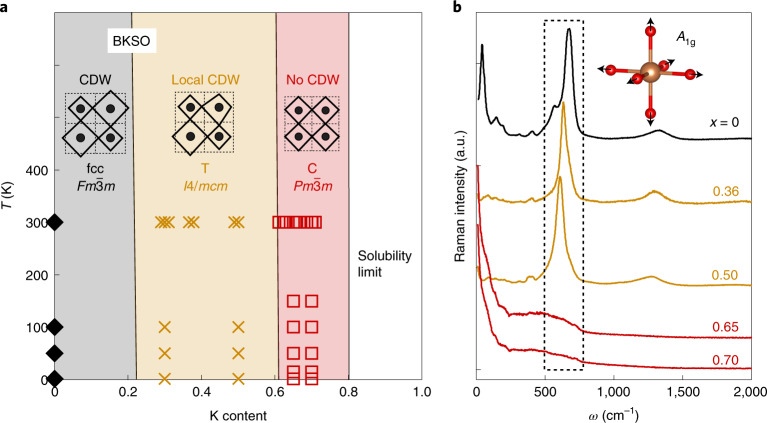
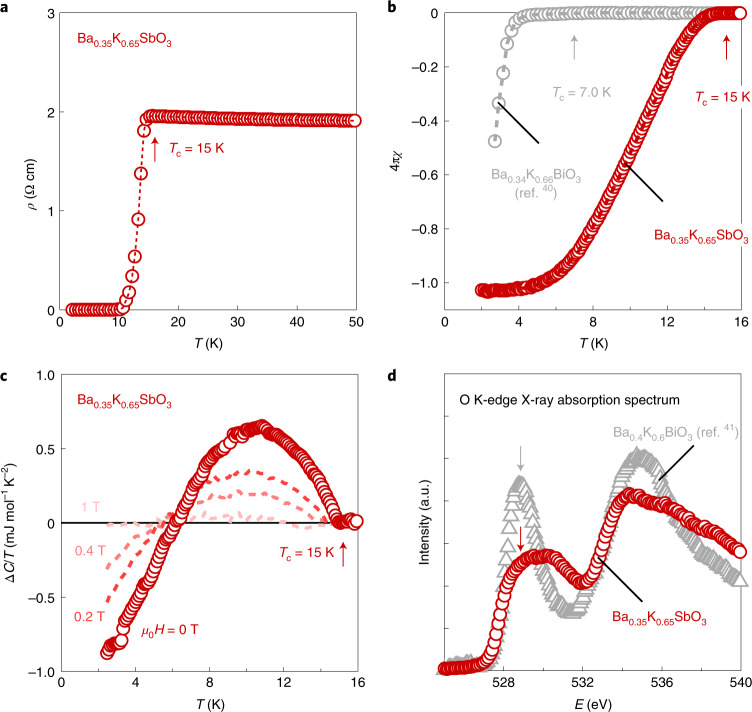
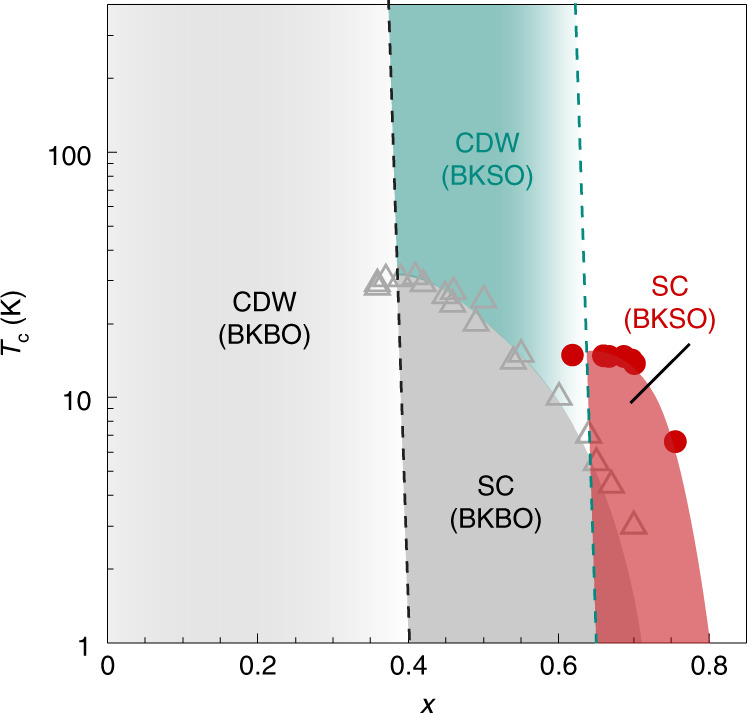
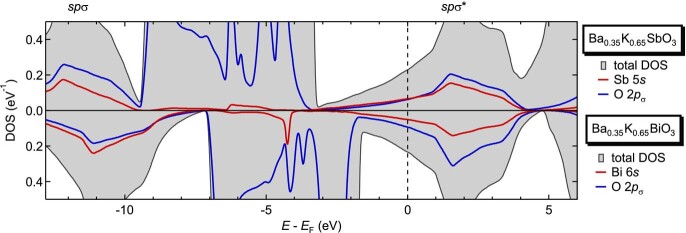
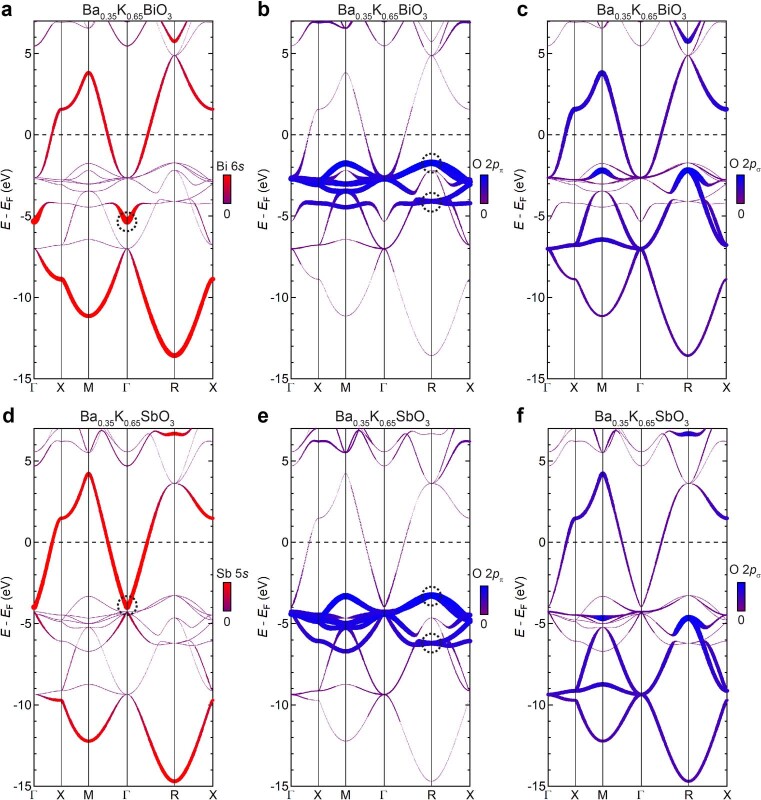
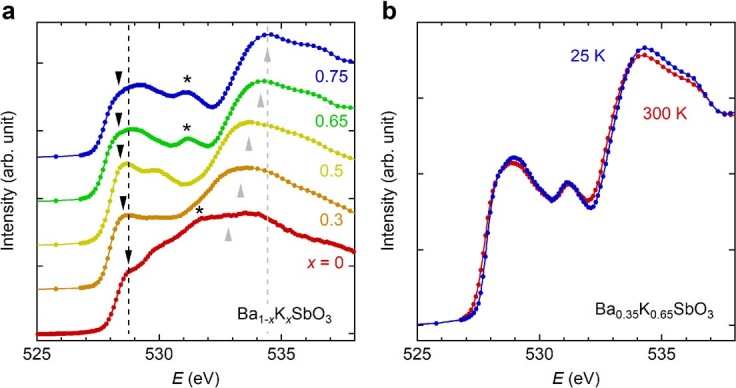
(Ba,K)BiO3 constitute an interesting class of superconductors, where the remarkably high superconducting transition temperature Tc of 30 K arises in proximity to charge density wave order. However, the precise mechanism behind these phases remains unclear. Here, enabled by high-pressure synthesis, we report superconductivity in (Ba,K)SbO3 with a positive oxygen-metal charge transfer energy in contrast to (Ba,K)BiO3. The parent compound BaSbO3-δ shows a larger charge density wave gap compared to BaBiO3. As the charge density wave order is suppressed via potassium substitution up to 65%, superconductivity emerges, rising up to Tc = 15 K. This value is lower than the maximum Tc of (Ba,K)BiO3, but higher by more than a factor of two at comparable potassium concentrations. The discovery of an enhanced charge density wave gap and superconductivity in (Ba,K)SbO3 indicates that strong oxygen-metal covalency may be more essential than the sign of the charge transfer energy in the main-group perovskite superconductors.


Conflict of interest statement

The authors declare no competing interests.

Figures

Fig. 1
Fig. 1. Inverted charge transfer energy in between BKSO and BKBO.
a, A schematic diagram of different regimes of metallicity in BKBO and BKSO. When charge transfer energy ΔCT is positive (negative), Bi or Sb s electrons (oxygen holes) are predominant. b, The fat-band representation of the electronic band structure of BKBO at x = 0.65 calculated via hybrid DFT. The thickness is proportional to the sum of O 2pσ and Bi 6s contributions, and the colours represent their ratio, with predominant O 2pσ character shown by blue and predominant Bi 6s character by red. The plot shows the predominant O 2pσ (Bi 6s) character in the spσ* (spσ) band. A band with predominant Bi 6s character at Γ at −5.4 eV is formed by non-bonding Bi 6s states (Extended Data Fig. 2 for the O 2pπ contribution). EF, Fermi energy. c, The molecular-orbital diagram of BKBO derived from b. The Bi 6s orbital energy is markedly lower than the O 2p energy, consistent with negative ΔCT. Therefore, BKBO is located in the scheme of the oxygen-hole metal,, as illustrated in a. d, The fat-band representation of the electronic band structure of BKSO at x = 0.65 calculated via hybrid DFT. Sb 5s and oxygen 2p are found to be highly mixed in both spσ and spσ* bands. The much enhanced Sb 5s character in the spσ* band is clear compared to that of Bi 6s in BKBO. The non-bonding Sb 5s states at Γ are at −4.0 eV (Extended Data Fig. 2 for the O 2pπ contribution). e, The molecular-orbital diagram for BKSO derived from d. The Sb 5s orbital energy is marginally higher than the O 2p energy, indicating that ΔCT is slightly positive while being close to zero (ΔCT ≳ 0). Thus, BKSO is located in the region of the Bi/Sb s-orbital metal while critically close to the covalency limit in a.
Fig. 2
Fig. 2. Three-dimensional CDW order in undoped BaSbO3−δ.
a,b, Schematic diagrams of expanded and contracted octahedra in BaSbO3−δ (a) and BBO (b). d denotes bond length between metal and oxygen ions. From the neutron diffraction investigations (Supplementary Fig. 2), two distinct Sb–O bond lengths are estimated to be 2.24(1) and 2.01(1) Å, respectively (Supplementary Table 3 for detailed structural parameters). The difference between the two bond lengths is found to be larger than that of BBO (ref. ). c, Optical absorbance of BaSbO3−δ at 300 K shows a wide bandgap ECDW of 2.54 eV caused by the formation of the CDW order. By comparison, the optical conductivity (σ1) of BBO (ref. ) is plotted as a reference, indicating the CDW gap of BaSbO3−δ is larger than that of BBO.
Fig. 3
Fig. 3. Suppression of the CDW order via potassium doping.
a, The structural phase diagram of BKSO based on neutron (Supplementary Fig. 2) and X-ray (Supplementary Fig. 3) diffraction data. Black diamonds, tan crosses and red squares represent the face-centred cubic (fcc, Fm3¯m), tetragonal (T, I4/mcm) and primitive cubic (C, Pm3¯m) phases, respectively. The insets depict the local atomic structure of each phase, which shows transitions of the CDW order from the commensurate long range (Fm3¯m) to short range (I4/mcm), and finally to complete suppression (Pm3¯m). b, Raman spectra of BKSO measured with the excitation wavelength of 632 nm at 300 K. ω denotes the Raman shift in the unit of wavenumber. As highlighted in the dashed box, the breathing-mode phonon peak observed in the Fm3¯m and I4/mcm phases disappears in the Pm3¯m phase (x ≥ 0.65), confirming the CDW order is completely suppressed. The inset shows a schematic picture of the breathing-mode phonon.
Fig. 4
Fig. 4. Superconductivity and weakened oxygen-hole character in Ba0.35K0.65SbO3.
a, Superconducting transition observed in the resistivity (ρ) of optimally doped antimonate (x = 0.65). T denotes temperature. The superconducting transition temperature Tc, defined by the clear onset of the transition, is ~15 K. b, The superconducting transition of the same sample is observed in zero-field-cooled magnetic susceptibility (χ) measured at μ0H = 0.001 T (red), in comparison with that of Ba0.34K0.66BiO3 (grey). H is an applied magnetic field, and μ0 is the vacuum permeability. The diamagnetic volume fraction is near 100%, indicating bulk superconductivity. Here, Tc is 15 K, defined as a temperature where the volume fraction started increasing by 0.1%. c, The superconducting transition of the same sample observed in the specific heat. ΔC denotes the difference between specific heats (C) under each field and 14 T. Tc is estimated to 15 K from the clear onset of jump, which can be suppressed by applying a field of 1 T. The observed jump is broadened, perhaps indicating sample inhomogeneity from the high-pressure synthesis. d, Oxygen K-edge X-ray absorption spectrum of Ba0.35K0.65SbO3 (red open circles) at 300 K, plotted together with that of Ba0.4K0.6BiO3 (ref. ; grey open triangles). The intensity of each spectrum is normalized by that at a high energy ~550 eV above the edge. The arrows indicate the prepeak structure originating from oxygen 2p holes in the spσ* band. The suppression of the prepeak intensity in the antimonate indicates the decrease of oxygen holes compared to the bismuthate.
Fig. 5
Fig. 5. Phase diagram of BKSO and BKBO.
Red circles are the Tc values of superconductivity (SC) in the antimonates with the same definition as in Fig. 4, and grey triangles are Tc of BKBO (refs. ,). Tc values of the antimonates show a half-dome shape (red region), which is similar to that of the bismuthates (dark grey). The crucial difference is that the CDW order in the bismuthates (light grey region) is suppressed at x = 0.4, whereas that of the antimonates (green region) continues to exist up to x = 0.65.
Extended Data Fig. 1
Extended Data Fig. 1. Electronic density of states of Ba0.35K0.65SbO3 and Ba0.35K0.65BiO3.
The results are consistent with those suggested from the molecular-orbital diagrams (Figs. 1c and 1e); Ba0.35K0.65BiO3 with negative ΔCT shows predominant Bi 6s and O 2pσ characters in the spσ and spσ* bands, respectively. The projected density of states (PDOS) of O 2pσ at the Fermi level is larger than that of Bi 6s [PDOS (Bi 6s) / PDOS (O 2pσ) ≅ 0.552]. On the contrary, for Ba0.35K0.65SbO3 with ΔCT slightly positive while close to zero, the ratio between Sb 5s and O 2pσ PDOS is not so different between the spσ and spσ* bands, and very close to unity at the Fermi level [PDOS(Sb 5s) / PDOS (O 2pσ) ≅ 1.06)]. Thus, metal s character with respect to O 2pσ at the Fermi level is stronger in Ba0.35K0.65SbO3 than Ba0.35K0.65BiO3. Total DOS at the Fermi level shows almost no difference between the two compounds (Ba0.35K0.65SbO3: 0.223 states/eV, Ba0.35K0.65BiO3: 0.227 states/eV).
Extended Data Fig. 2
Extended Data Fig. 2. Metal s and oxygen 2p characters of Ba0.35K0.65SbO3 and Ba0.35K0.65BiO3.
The fat-band representations of the band structure of Ba0.35K0.65BiO3 calculated via the hybrid-DFT showing a, Bi 6s, b, O 2pπ, and c, O 2pσ orbital characters. The black dashed circle in a denotes a band at Γ at which Bi 6s (a1g symmetry) do not hybridize with any O 2p states in the cubic structure. The energy of this band can be used to estimate the on-site energy of Bi 6s,,, if one neglects weak Bi 6s–O 2s hybridization. The two black dashed circles in b denote triply degenerate bands at R at which the O 2pπ states have the t2g and t1g symmetries, respectively, and do not hybridize with Bi 6s or 6p states. The on-site energy of O 2pπ can be reasonably approximated by averaging the energies of these two bands, which cancels out the effect of O 2p–O 2p hybridization. The fat-band representations of the electronic band structure of Ba0.35K0.65SbO3 calculated via the hybrid-DFT showing d, Sb 5s, e, O 2pπ, and f, O 2pσ orbital characters. The black dashed circles in d and e denote the bands with Sb 5s (a1g) and O 2pπ t2g and t1g characters as in the case of Ba0.35K0.65BiO3.
Extended Data Fig. 3
Extended Data Fig. 3. The oxygen K-edge X-ray absorption spectra of Ba1-xKxSbO3 (0 ≤ x ≤ 0.75).
a, The spectra of the BKSO samples with various K contents were measured at 300 K in the total fluorescence yield mode. All the samples show the pre-peak structure (black arrows) analogous to the Ba0.35K0.65SbO3 sample depicted in Fig. 4d. This indicates a strong admixture of Sb 5s with O 2p throughout the entire x range, but the intensity of the pre-peak is appreciably reduced compared with that of BKBO at comparable x values,,. The position of the pre-peak shifts to a lower energy with increase of x, which can be understood as the suppression of the CDW gap by doping holes,. The high-energy peak (grey arrows) shifts to a higher energy, which may be associated with the Ba 5d and K 3d states that change upon the chemical substitution. For the x = 0, 0.65, and 0.75 samples, the extra peak around 531 eV (black asterisks) likely originates from a degraded surface, because of its pronounced intensity in the surface-sensitive total electron yield mode data (not shown). Further quantitative analysis has so far been limited at present, as the Sb M5-edge gives rise to an additional structure around the pre-peak because its energy is so close to that of the oxygen K-edge. b, The spectra of the x = 0.65 sample at 300 and 25 K, showing no apparent change within the temperature range investigated. We note that the x = 0.65 sample shown here is different from that in Fig. 4d.

References

    1. Sleight AW, Gillson JL, Bierstedt PE. High-temperature superconductivity in BaPb1-xBixO3 system. Solid State Commun. 1975;17:27–28. doi: 10.1016/0038-1098(75)90327-0. - DOI
    1. Mattheiss LF, Gyorgy EM, Johnson DW. Superconductivity above 20 K in the Ba-K-Bi-O system. Phys. Rev. B. 1988;37:3745–3746. doi: 10.1103/PhysRevB.37.3745. - DOI - PubMed
    1. Cava RJ, et al. Superconductivity near 30 K without copper: the Ba0.6K0.4BiO3 perovskite. Nature. 1988;332:814–816. doi: 10.1038/332814a0. - DOI
    1. Cox DE, Sleight AW. Crystal structure of Ba2Bi3+Bi5+O6. Solid State Commun. 1976;19:969–973. doi: 10.1016/0038-1098(76)90632-3. - DOI
    1. Thonhauser T, Rabe KM. Fcc breathing instability in BaBiO3 from first principles. Phys. Rev. B. 2006;73:212106. doi: 10.1103/PhysRevB.73.212106. - DOI