. 2022 Mar;23(3):431-445.
doi: 10.1038/s41590-022-01145-x. Epub 2022 Feb 28.

PERK is a critical metabolic hub for immunosuppressive function in macrophages

Affiliations

PERK is a critical metabolic hub for immunosuppressive function in macrophages

Lydia N Raines et al. Nat Immunol. 2022 Mar.

Abstract

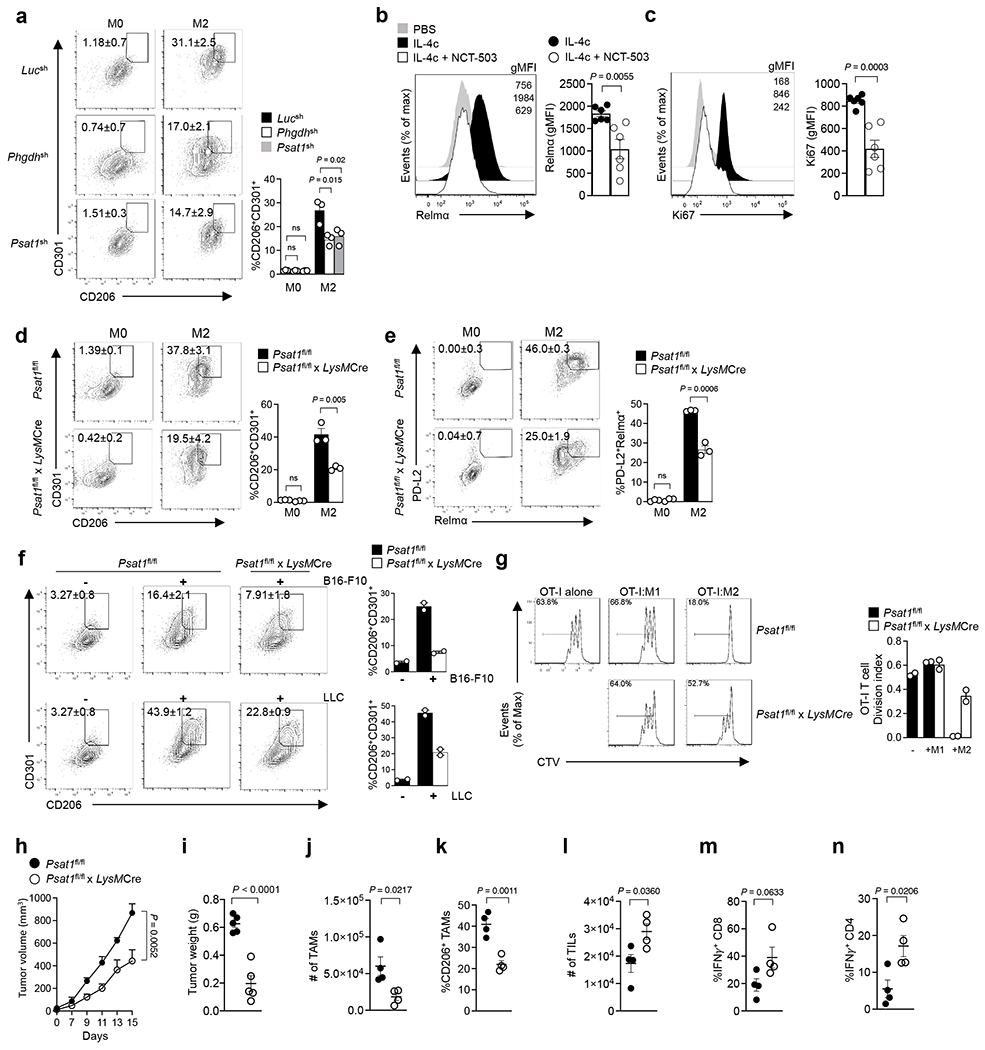
Chronic inflammation triggers compensatory immunosuppression to stop inflammation and minimize tissue damage. Studies have demonstrated that endoplasmic reticulum (ER) stress augments the suppressive phenotypes of immune cells; however, the molecular mechanisms underpinning this process and how it links to the metabolic reprogramming of immunosuppressive macrophages remain elusive. In the present study, we report that the helper T cell 2 cytokine interleukin-4 and the tumor microenvironment increase the activity of a protein kinase RNA-like ER kinase (PERK)-signaling cascade in macrophages and promote immunosuppressive M2 activation and proliferation. Loss of PERK signaling impeded mitochondrial respiration and lipid oxidation critical for M2 macrophages. PERK activation mediated the upregulation of phosphoserine aminotransferase 1 (PSAT1) and serine biosynthesis via the downstream transcription factor ATF-4. Increased serine biosynthesis resulted in enhanced mitochondrial function and α-ketoglutarate production required for JMJD3-dependent epigenetic modification. Inhibition of PERK suppressed macrophage immunosuppressive activity and could enhance the efficacy of immune checkpoint programmed cell death protein 1 inhibition in melanoma. Our findings delineate a previously undescribed connection between PERK signaling and PSAT1-mediated serine metabolism critical for promoting immunosuppressive function in M2 macrophages.


Conflict of interest statement

Competing financial interests

P.-C.H. is a member of scientific advisory for Elixiron Immunotherapeutics. The remaining authors declare no competing interests.

Figures

Extended Data Figure 1.
Extended Data Figure 1.. PERK deficiency does not affect M1 activation.
a, Enrichment plot of endoplasmic reticulum (ER) stress genes in IL-4c treated mouse peritoneal macrophages compared with naïve (PBS) macrophages by GSEA analysis. b, GSEA result comparing ER stress genes between TAMs and non-tumor macrophages from patients with lung carcinoma. c, Pearson correlation of TAM CD68 expression with genes encoding molecules involved in the PERK pathway in cancer patients from the TCGA. d, Immunoblots of p-PERK, PERK, and β-actin from BMDMs stimulated with IL-4, Thapsigargin, or phosphatase. Ratio of p-PERK to total PERK was determined using ImageJ. Data are representative of three independent experiments. e, Geometric MFI of p-PERK+ in BMDMs stimulated with IL-4 or Thapsigargin (n=3; mean ± s.e.m). Data are collected from three independent experiments. f, Percentage of CD206+CD301+ in BMDMs treated with either DMSO (vehicle), IL-4, or Thapsigargin (n=3; mean ± s.e.m). Data are collected from three independent experiments. g, Expression of CD206 and CD301 from BMDMs treated with IL-4 (M2) in the presence or absence of GSK2656157 (n=3; mean ± s.e.m). Data are representative of three independent experiments. h, Percentage of 7AAD naïve BMDMs isolated from Eif2ak3fl/fl or Eif2ak3fl/fl x LysMCre mice (n=6; mean ± s.e.m). Data are collected from six independent experiments. i, Immunoblots of PERK, iNOS, Arg1, and β-actin from PERK wild-type and deficient BMDMs treated with LPS plus IFNγ (M1), IL-4 (M2), or Thapsigargin. Data are representative of two independent experiments. j-l, Representative histogram (left) and quantitative plot (right) of iNOS (j), TNF (k), or expression of CD206 and CD301 (l) in BMDMs stimulated with LPS plus IFNγ (M1) or IL-4 (M2) (n=3; mean ± s.e.m). Data are representative of three independent experiments. m, Immunoblots of p-PERK, PERK, XBP1s, and β-actin in unstimulated (M0), LPS+IFNγ (M1), or IL-4 (M2) stimulated BMDMs; data are representative of three independent experiments. All data were analyzed using two-tailed unpaired Student’s t-test (e,g,j,j,k,l) or one-way ANOVA with Tukey’s multiple comparisons test (f).
Extended Data Figure 2.
Extended Data Figure 2.. ISR in macrophage activation and metabolism.
a,b, Expression of CD206, CD301 (a), PD-L2 and Relmα (b) in macrophages stimulated with IL-4 in the presence or absence of ISRIB (n=3; mean ± s.e.m). Data is representative of three independent experiments. c, Representative histogram (left) and quantitative analysis (right) of iNOS expression in macrophages stimulated with LPS+IFNγ in the presence or absence of ISRIB (n=3; mean ± s.e.m). Data is representative of three independent experiments. d, Expression of genes associated with ISR, assessed by RNA-Seq analysis. e,f, Expression of CD206, CD301 (e), PD-L2 and Relmα (f) in Gcn2+/+ and Gcn2−/− macrophages in the presence or absence of IL-4 (n=3; mean ± s.e.m). Data is representative of two independent experiments. g,h, Representative histograms (left) and quantitative analysis (right) of iNOS (g) or TNF (h) in Gcn2+/+ and Gcn2−/− macrophages in the presence or absence of LPS+IFNγ (n=3; mean ± s.e.m). Data is representative of two independent experiments. i,j, Basal OCR (i) and ECAR (j) of Gcn2+/+ and Gcn2−/− M0, M1, and M2 macrophages (n=3; mean ± s.e.m). Data is representative of two independent experiments. k, Basal OCR of M0 and M2 BMDMs in the presence or absence of ISRIB (n=3; mean ± s.e.m). Data is representative of two independent experiments. l, Intracellular serine content from M0, M1 and M2 macrophages in the presence of absence of ISRIB (n=3; mean ± s.e.m). Data is representative of two independent experiments. All data were analyzed using two-tailed unpaired Student’s t-test (a,b,c,e,f,g,h,I,j,k,l).
Extended Data Figure 3.
Extended Data Figure 3.. Pharmacological inhibition of PERK deviates cellular metabolism in M2 macrophages.
a, Basal OCR of naïve (M0) and M1 (LPS+IFNγ) BMDMs from PERK sufficient or deficient mice (n=3; mean ± s.e.m). Data collected from three independent experiments. b, Basal ECAR of naïve (M0), M1 (LPS+IFNγ), and M2 (IL-4) BMDMs from PERK wild-type or null animals (n=3; mean ± s.e.m). Data are collected from three independent experiments. c,d,e Basal OCR (c), ECAR (d), or ATP production (e) from wild-type BMDMs treated with IL-4 in the presence or absence of GSK2656157 (n=3; mean ± s.e.m). Dashed line indicates wild-type M0. Data are collected from three independent experiments. f, Representative histogram (left) and quantitative analysis (right) of BODIPY FL C16 staining in BMDMs treated with IL-4 in the presence or absence of GSK2656157 (n=3; mean ± s.e.m). Data representative of three independent experiments. g, Representative histogram (left) and the frequency (right) of BODIPY (493/503) staining in BMDMs stimulated with IL-4 in the presence or absence of GSK2656157 (n=3; mean ± s.e.m). Data representative of three independent experiments. h, Representative TEM images of PERK wild-type and PERKcKO M2 (IL-4) macrophages. Red arrows indicate mitochondria. Data representative of three biological replicates. i, Representative histogram (left) and the frequency (right) of MitoTracker Green+ staining in BMDMs treated IL-4 (n=3; mean ± s.e.m). Data representative of three independent experiments. j, Representative histogram (left) and the frequency (right) of MitoTracker Orange+ staining in BMDMs treated with IL-4 (n=3; mean ± s.e.m). Data representative of three independent experiments. k, RNA-seq analysis of genes associated with mitochondrial calcium transport. l, Mitochondrial calcium flux (Rhod-2) from BMDMs treated with IL-4 in the presence or absence of GSK2656157 was determined and normalized by wild-type naïve M0 macrophages. Arrow, stimulation using 10 μM ionomycin (n=6 for wild-type M0 and M2; n=4 for GSK-treated cells; mean ± s.e.m). Data are representative of three independent experiments. All data were analyzed using two-tailed unpaired Student’s t-test (a,b,c,d,e,f,g,i,j,l) or two-tailed paired Student’s t-test (l).
Extended Data Figure 4.
Extended Data Figure 4.. Inhibition of PHGDH or PSAT1 impairs M2 macrophage function.
a, Expression of genes encoding the serine one-carbon metabolic pathway in naïve (M0), M1 (LPS+IFNγ), or M2 (IL-4) macrophages, assessed by RNA-Seq analysis. b,c, Immunoblot analysis of PHGDH, PSAT1 and β-actin in BMDMs transduced with either retrovirus expressing Luc (b,c), PHGDH (b) or PSAT1 (c) shRNA and stimulated with IL-4. Data are representative of three independent experiments. d,e, Expression of CD206, CD301, PD-L2 and Relmα by IL-4 stimulated BMDMs treated with CBR-5884 (d) or transduced with PHGDH shRNA (e; middle), or transduced with PSAT1 shRNA (e; bottom) (n=3; mean ± s.e.m). Data are representative of three independent experiments. f, Expression of CD206 and CD301 in M0 or LPS+IFNγ (M1) stimulated BMDMs from Psat1fl/fl or Psat1fl/fl x LysMCre mice (n=3; mean ± s.e.m). Data are representative of three independent experiments. g, Relative histogram (left) and gMFI (right) of either naïve (M0) or M1 macrophages from PSAT1 wild-type and knockout mice (n=3; mean ± s.e.m). Data are representative of three independent experiments. h,i, Basal OCR and ECAR of wild-type BMDMs treated with IL-4 in the presence or absence of CBR-5884 (h) or transduced with shRNA targeting Phgdh or Psat1 (n=3; mean ± s.e.m) (i). Data are collected from three independent experiments. j, ATP production from BMDMs stimulated with IL-4 in the presence or absence of CBR-5884 (n=3; mean ± s.e.m). All data were analyzed using two-tailed unpaired Student’s t-test (d,f,g,h,j), or ordinary one-way ANOVA with Dunnett’s multiple comparisons test (e,i).
Extended Data Figure 5.
Extended Data Figure 5.. Loss of PERK does not result in H3K27m3 histone hypermethylation in pro-inflammatory M1 genes.
a,b, qRT-PCR analysis of Jmjd3 expression from PERK wild-type/knockout (a), or PSAT1 wild-type/knockout (b) BMDMs stimulated with IL-4 (n=2; mean ± s.e.m). Data are collected from two independent experiments. c,d, Immunoblots of PERK, Jmjd3 and β-actin in M0, M1, and M2 BMDMs from PERK wild-type and knockout mice (c) or from PSAT1 wild-type and knockout mice (d). Data are representative of two independent samples. e, Changes in gene expression of targets associated with H3K27me3 from PERK wild-type or knockout BMDMs stimulated with IL-4 (M2; left) or LPS+IFNγ (M1; right). f, H3K27me3 histone modifications of Irf4, Pparg, Phgdh and Mgl2 from PERK wild-type and knockout BMDMs in the presence or absence of LPS+IFNγ. g, H3K27me3 histone modifications of selected genes associated with pro-inflammation from naïve (M0), LPS+IFNγ (M1) or IL-4 (M2) stimulated PERK wild-type or knockout macrophages. All data were analyzed using two-tailed unpaired Student’s t-test (a,b).
Extended Data Figure 6.
Extended Data Figure 6.. Therapeutic PERK inhibition in mouse melanoma model.
a, Schematic of the experimental design for small molecule inhibitor treatments. b, Frequency of tumor-infiltrating immune cells (TAMs, TILs, DCs, MDSCs, and NK cells) from B16-F10 tumor-bearing mice with treatment of either DMSO (Vehicle), GSK2656157, or NCT-503. Tumors were harvested on day 16. (n=10 mice per group; mean ± s.e.m). Data are collected from two independent experiments. c, Body weight of tumor-bearing mice given the indicated treatments (n=9 mice per group; mean ± s.e.m). Data are collected from two independent experiments. d, Schematic of the experimental design for the treatment of αPD-1, GSK2656157, and αPD-1 + GSK2656157. Data were analyzed by ordinary one-way ANOVA with Dunnett’s multiple comparisons test (b,c).
Figure 1.
Figure 1.. PERK stress signaling promotes an immunosuppressive phenotype in macrophages.
a, Expression of genes encoding molecules involved in the PERK arm of the ER stress response in M0 (naive), M1 (LPS plus IFNγ), and M2 (IL-4) BMDMs, assessed by RNA-Seq analysis. b, Geometric MFI of p-PERK+ BMDMs cultured for 24 h with IL-4, measured by flow cytometry (n=3; mean ± s.e.m). Data are collected from three independent experiments. c, Geometric MFI of p-PERK+ macrophages in the tumor and spleen from B16-F10 tumor bearing mice (n=4 mice per group). Data representative of two independent experiments. d, Expression of CD206, CD301, PD-L2, and Relmα in M0 and IL-4 treated BMDMs from Eif2ak3fl/fl and Eif2ak3fl/fl x LysMCre mice (n=3; mean ± s.e.m). Data are collected from three independent experiments. e, Representative histogram (left) and quantitative plot (right) of Relmα+ peritoneal macrophages in mice following treatment with IL-4c (n=4 mice per group; mean ± s.e.m). Each symbol represents one individual. Data representative of two independent experiments. f, Absolute number of peritoneal macrophages (n=4 for Eif2ak3fl/fl and n=3 for Eif2ak3fl/fl x LysMCre mice; mean ± s.e.m). Each symbol represents one individual. Data is representative of two independent experiments. g, Representative histogram (left) and quantitative plot (right) of Ki67+ peritoneal macrophages in mice following treatment with IL-4c (n=4 for Eif2ak3fl/fl and n=3 Eif2ak3fl/fl x LysMCre mice; mean ± s.e.m). Each symbol represents one individual. Data is representative of two independent experiments. h, Representative expression of CD206 and CD301 by PERK wild-type or knockout BMDMs co-cultured with either B16-F10 melanoma cells (top) or LLC lung carcinoma cells (bottom) for 72 h (n=4; mean ± s.e.m). Data is representative of two independent experiments. i, Proliferation of CellTrace Violet (CTV)-labelled CD8 OT-I T cells activated with anti-CD3 and anti-CD28 and co-cultured with PERK wild-type or PERK-null BMDMs stimulated with IL-4 (M2) or LPS+IFNγ (M1) at a ratio of 1:10 for 72 hr (n=2; mean ± s.e.m). Data is representative of two individual experiments. j,k, Tumor growth (Eif2ak3fl/fl, n=15 ; Eif2ak3fl/fl x LysMCre, n=15; mean ± s.e.m) (j) and tumor weight (k) of B16-F10 melanoma. Data were taken from tumors harvested on either day 10 or day 16 post-tumor transplantation. (n=5 mice per group D10; n=15 mice per group D16; mean ± s.e.m). Each symbol is representative of one individual. Data are representative of at least two independent experiments. l,m, Absolute number of TAMs (l) and the frequency of CD206+ TAMs (m) in Eif2ak3fl/fl and Eif2ak3fl/fl x LysMCre tumor bearing mice from either day 10 or day 16 tumors (n=4 per group D10 or n=15 per group D16; mean ± s.e.m). Each symbol is representative of one individual. Data are representative of at least two independent experiments. n,o,p, Absolute number of TILs (n) and the frequency of IFNγ+ CD4 (o) and IFNγ+ CD8 (p) T cells in Eif2ak3fl/fl and Eif2ak3fl/fl x LysMCre tumor-bearing mice from either day 10 or day 16 tumors (n=4 per group; mean ± s.e.m). Each symbol represents one individual. Data are representative of two independent experiments. q, Survival analysis between Eif2ak3fl/fl and Eif2ak3fl/fl x LysMCre mice bearing B16-F10 melanoma (n=8 per group; mean ± s.e.m); data are collected from two independent experiments. All data were analyzed using two-tailed unpaired Student’s t-test (b,c,d,e,f,g,j,I,j,k,l,m,n,o,p) or Mantel-Cox test for survival (q).
Figure 2.
Figure 2.. Multivariate analysis of transcriptomics and metabolomics data.
a,b, Gene set enrichment analysis was performed, and enrichment scores are shown for KEGG (a) and GO (b) pathway enrichment in PERK knockout M2 macrophages compared with PERK wild-type M2 macrophages (n=2 independent experiments). c,d,e, Metabolomics profiling was performed, and principal component analysis (PCA) score plot (c), heatmap analysis of metabolites (d), and KEGG pathway enrichment in PERK knockout M2 macrophages compared with PERK wild-type M2 macrophages (e) are shown (n=4 independent experiments).
Figure 3.
Figure 3.. PERK activity is essential for metabolic reprogramming in M2 macrophages.
a, Basal OCR of IL-4 stimulated BMDMs (M2) from Eif2ak3fl/fl or Eif2ak3fl/fl x LysMCre (n=5; mean ± s.e.m). Data are collected from five independent experiments. b, ATP levels of IL-4 stimulated BMDMs from Eif2ak3fl/fl or Eif2ak3fl/fl x LysMCre mice (n=3; mean ± s.e.m). Data are from three independent experiments. c, Expression of genes encoding CD36, LIPA, PPARγ, PGC1β, and ACAT1 in M2 (IL-4) macrophages from Eif2ak3fl/fl and Eif2ak3fl/fl x LysMCre mice, assessed by RNA-Seq analysis. d, Expression of CD36, LIPA, PPARγ, PGC1β in PERK wild-type and deficient macrophages stimulated with IL-4 by quantitative real-time PCR analysis (n=4; mean ± s.e.m). Data are representative of two independent experiments. e, Representative histogram (left) and quantitative plot (right) of BODIPY FL C16 staining in BMDMs treated with IL-4 (n=4; mean ± s.e.m). Data are representative of three independent experiments. f, Representative histogram (left) and quantitative plot (right) of BODIPY (493/503) staining in BMDMs treated with IL-4 (n=4; mean ± s.e.m). Data are representative of three independent experiments. g, Representative images of mitochondrial and cristae (red arrows) from transmission electron microscopy of IL-4 stimulated bone-marrow macrophages from Eif2ak3fl/fl or Eif2ak3fl/fl x LysMCre mice. Scale bar = 500 nm. h,i, Measurements of cristae area (h) and cristae width (i) as determined using ImageJ. Each dot represents average of all mitochondria from one cell (n=22; mean ± s.e.m). Data are representative of two biological replicates. j, Representative histogram (left) and quantitative plot (right) of MitoTracker Green+ staining in BMDMs treated IL-4 (n=4; mean ± s.e.m). Data are representative of three independent experiments. k, Representative histogram (left) and quantitative plot (right) of MitoTracker Orange+ staining in BMDMs treated with IL-4 (n=4; mean ± s.e.m). Data are representative of three independent experiments. l, Expression of genes encoding molecules involved in the electron transport chain reaction in M2 (IL-4) macrophages from Eif2ak3fl/fl or Eif2ak3fl/fl x LysMCre mice, assessed by RNA-Seq analysis. m, Immunoblots of mitochondrial proteins ATP5A, UQCRC2, MTCO1, SDHB, NUDFB8, and PHB1 from PERK sufficient or deficient BMDMs stimulated with IL-4. Data are representative of three independent experiments. n, Mitochondrial calcium flux (Rhod-2) from PERK sufficient or deficient BMDMs treated with IL-4 was determined and normalized by wild-type naïve M0 macrophages. Arrow, stimulation using 10 μM ionomycin (n=6; mean ± s.e.m); data are representative of three independent experiments. All data were analyzed by two-tailed unpaired Student’s t-test (a,b,d,e,f,h,I,j,k) or two-tailed paired Student’s t-test.
Figure 4.
Figure 4.. PERK regulates intrinsic serine biosynthesis via ATF4.
a, Enrichment plot of serine glycine one carbon metabolism (SGOC) genes in IL-4c treated mouse peritoneal macrophages compared with naïve (PBS) macrophages by GSEA analysis. b, GSEA result comparing SGOC genes between TAMs and non-tumor macrophages from patients with lung carcinoma. c, Abundance of 3-phosphoglycerate (3-PG), serine, and glycine in extracts of BMDMs cultured for 24 h in M1 (LPS+IFNγ) or M2 (IL-4) stimulating conditions, assessed by mass spectrometry (n=4; mean ± s.e.m). Data are collected from four independent experiments. d, Targeted metabolomics profiling indicated metabolites from Eif2ak3fl/fl or Eif2ak3fl/fl x LysMCre BMDMs stimulated with IL-4 (n=4 independent experiments). e, Intracellular serine levels in extracts of PERK wild-type or knockout BMDMs treated with IL-4 (n=3; mean ± s.e.m); serine level from naïve (M0) wild-type macrophages is indicated by dotted horizontal line. Data are representative of two independent experiments. f, Expression of genes encoding PHGDH and PSAT1 in M2 (IL-4) macrophages from Eif2ak3fl/fl or Eif2ak3fl/fl x LysMCre mice, assessed by RNA-Seq analysis. g, Comprehensive heatmap of ATF4 binding regions by ChIP-Seq analysis. h, Immunoblot analysis of PERK, ATF4, PHGDH, PSAT1, and β-actin in macrophages from PERK wild-type or deficient BMDMs. Data are representative of three independent experiments. i,j qRT-PCR (i; n=4; mean ± s.e.m) and immunoblot (j) analysis of ATF4, PHGDH, PSAT1, and β-actin in BMDMs transduced with retrovirus expressing ATF4 or luciferase (Luc) shRNA, and stimulated with IL-4. Data are representative of two independent experiments. k, Expression of CD206, CD301, PD-L2 and Relmα in BMDMs transduced with retrovirus expressing ATF4 or luciferase (Luc) shRNA and stimulated with IL-4 (n=3; mean ± s.e.m). Data are representative of two independent experiments. l,m,n, PERK wild-type (WT) or deficient (KO) BMDMs were either transduced with retrovirus overexpressing a control reporter gene (EV) or a reporter gene plus the Atf4 sequence (Atf4O/E), and stimulated with IL-4. Representative expression of CD206 and CD301 was determined by flow cytometry (l; n=4; mean ± s.e.m), and basal OCR (m) and basal ECAR (n) were measured by Seahorse Flux analyzer (n=3; mean ± s.e.m). Data are representative of two independent experiments. All data were analyzed by two-tailed unpaired Student’s t-test (c,e,I,k) or one-way ANOVA with Dunnett’s multiple comparisons test (m,n).
Figure 5.
Figure 5.. Serine biosynthesis promotes an immunosuppressive phenotype in macrophages.
a, Expression of CD206 and CD301 in BMDMs transduced with retrovirus expressing PHGDH shRNA (middle), or BMDMs transduced with retrovirus expressing PSAT1 shRNA (bottom) (n=3; mean ± s.e.m). Data are representative of three independent experiments. b,c, Representative histogram (left) and quantitative plot (right) of Relmα+ (b) or Ki67+ (c) mouse peritoneal macrophages following treatment with IL-4c in the presence or absence of NCT-503 (n=6 mice per group; mean ± s.e.m). Each data symbol represents one individual. d,e, Expression of CD206, CD301 (d), PD-L2 and Relmα (e) in IL-4 stimulated BMDMs from Psat1fl/fl or Psat1fl/fl x LysMCre (n=3; mean ± s.e.m). Data are representative of three independent experiments. f, Expression of CD206 and CD301 by BMDMs from Psat1fl/fl or Psat1fl/fl x LysMCre mice co-cultured with B16-F10 melanoma cells (top) and LLC lung carcinoma cells (bottom) for 72 h (n=2; mean ± s.e.m). Data are collected from two independent experiments. g, Proliferation of CTV-labelled OT-I CD8 T cells activated with anti-CD3 and anti-CD28 and co-cultured with PSAT1 ypyype or knockout BMDMs treated with IL-4 (M2) or LPS+IFNγ (M1) in ratio of 1:10 for 72 hr (n=2; mean ± s.e.m). Data are collected from two independent experiments. h,i, Tumor growth (h) and tumor weight (i) of B16-F10 melanoma from Psat1fl/fl or Psat1fl/fl x LysMCre mice (n=5 mice per group; mean ± s.e.m). Data are collected from two independent experiments. j,k, Absolute number of TAMs (j) and the frequency of CD206+ TAMs (k) in PSAT1 wild-type or knockout mice (n=4 mice per group; mean ± s.e.m). l,m,n Absolute number of TILs (l) and the frequency of IFNγ+ CD8 (m) or CD4 (n) T cells in PSAT1 wild-type or knockout mice (n=4 mice per group; mean ± s.e.m). Data are representative of two independent experiments. All data were analyzed by two-tailed unpaired Student’s t-test (b,c,d,e,f,g,h,I,j,k,l,m,n) or one-way ANOVA with Dunnett’s multiple comparisons test (a).
Figure 6.
Figure 6.. Serine biosynthesis contributes to mitochondrial fitness independent of respiratory chain assembly.
a, Intracellular serine levels in extracts of IL-4 stimulated BMDMs from Psat1fl/fl or Psat1fl/fl x LysMCre (n=4; mean ± s.e.m); serine levels from M0 are indicated by dotted horizontal line. Data are representative of two independent experiments. b, Basal OCR (left) and basal ECAR (right) of PSAT1 wild-type or knockout BMDMs stimulated with IL-4 (n=3; mean ± s.e.m). Data are collected from three independent experiments. c, ATP production of PSAT1 wild-type or knockout BMDMs stimulated with IL-4 (n=4; mean ± s.e.m). Data are representative of two independent experiments. d, Representative histogram (left) and quantitative plot (right) of MitoTracker Green+ staining in BMDMs transduced with either retroviral expressing Luc, PHGDH or PSAT1 shRNA and stimulated IL-4 (n=3; mean ± s.e.m). Data are representative of three independent experiments. e, Representative histogram (left) and quantitative plot (right) of MitoTracker Orange+ staining in BMDMS transduced with either retroviral expressing Luc, PHGDH or PSAT1 shRNA and stimulated IL-4 (n=3; mean ± s.e.m). Data are representative of three independent experiments. f, Representative histogram (left) and quantitative plot (right) of MitoTracker Green+ staining in PSAT1 wild-type or knockout BMDMs stimulated with IL-4 (n=3; mean ± S.E.M). Data are representative of three independent experiments. g, Representative histogram (left) and quantitative plot (right) of MitoTracker Orange+ staining in PSAT1 wild-type or knockout BMDMs stimulated with IL-4 (n=3; mean ± s.e.m). Data are representative of three independent experiments. h, Immunoblot analysis of mitochondrial electron transport chain complexes from PSAT1 wild-type or knockout BMDMs stimulated with IL-4. Data are representative of two independent experiments. i, Mitochondrial calcium uptake (Rhod2) of PERK wild-type or knockout BMDMs stimulated with IL-4 (n=3; mean ± s.e.m). Arrow, stimulation using 10 μM ionomycin. Data are collected from three independent experiments. All data were analyzed using either two-tailed unpaired Student’s t-test (a,b,f,g), two-tailed paired Student’s t-test (i), or ordinary one-way ANOVA with Dunnett’s multiple comparisons test (d,e).
Figure 7.
Figure 7.. Dysregulation of SBP suppresses Jmjd3-mediated histone demethylation
a,b, Glutamine consumption (a) and intracellular α-KG levels (b) from PERK wild-type or knockout BMDMs treated with IL-4 (n=4; mean ± s.e.m); levels from M0 are indicated by dotted horizontal line. Data are representative of two independent experiments. c, Intracellular α-KG levels from PSAT1 wild-type or knockout BMDMs treated with IL-4 (n=4; mean ± s.e.m); levels from M0 are indicated by dotted horizontal line. Data are representative of two independent experiments. d,e, Immunoblot analysis of histone methyl mark H3K27me3, PSAT1, PERK, histone H3 from PERK (d) or PSAT1 (e) wild-type and knockout BMDMs treated with IL-4. Data are representative of three independent experiments. f, H3K27me3 histone modifications of Irf4, Pparg, Phgdh and Mgl2 from PERK wild-type and knockout BMDMs stimulated with IL-4. Data are representative of three independent experiments. g,h, qRT-PCR analysis of indicated M2 genes from PERK (g) or PSAT1 (h) wild-type and knockout BMDMs cultured with IL-4 for 6 h in the presence or absence of dm-KG (1 mM) or GSK-J4 (25 μM) (n=3; mean ± s.e.m). Data are collected from three independent experiments. All data were analyzed by either two-tailed unpaired Student’s t-test (a,b,c), or ordinary one-way ANOVA with Dunnett’s multiple comparisons test (g,h).
Figure 8.
Figure 8.. Therapeutic PERK inhibition suppresses tumorigenesis.
a,b, Tumor growth (a) or weight (b) from mice bearing B16-F10 melanoma treated with either GSK2656157 or NCT-503. Drug administration is indicated by arrows (n=9 in vehicle, n=10 in GSK and NCT treatment groups; mean ± s.e.m). c, Absolute number of TAMs (n=7 in vehicle, n=8 in GSK and NCT treatment groups; mean ± s.e.m). d, Frequency of CD206+ TAMs (n=8; mean ± s.e.m). e,f,g, Absolute number of TILs (e), frequency of IFNγ+ CD8 (f) and IFNγ+ CD4 (g) T cells (n=7 in vehicle, n=10 in GSK and NCT treatment groups; mean ± s.e.m). h, Survival analysis of mice treated with either vehicle, GSK2656157, or NCT-503 (n=10 mice per group). i, Tumor growth from mice bearing B16-F10 melanoma and treated with either IgG2a control, αPD-1, GSK2656157, or αPD-1 + GSK2656157 (n=7 mice per group). All data were collected from two independent experiments. Data were analyzed by ordinary one-way ANOVA with Dunnett’s multiple comparisons test (a-g) or Mantel-Cox test for survival (h).

References

    1. Wynn TA, Chawla A & Pollard JW Macrophage biology in development, homeostasis and disease. Nature 496, 445–455 (2013). - PMC - PubMed
    1. McNelis JC & Olefsky JM Macrophages, Immunity, and Metabolic Disease. Immunity 41, 36–48 (2014). - PubMed
    1. Murray PJ Macrophage Polarization. Annu Rev Physiol 79, 541–566 (2017). - PubMed
    1. Etchegaray J-P & Mostoslavsky R Interplay between Metabolism and Epigenetics: A Nuclear Adaptation to Environmental Changes. Molecular Cell 62, 695–711 (2016). - PMC - PubMed
    1. Lio CJ & Huang SC Circles of Life: linking metabolic and epigenetic cycles to immunity. Immunology 161, 165–174 (2020). - PMC - PubMed

Publication types

MeSH terms