. 2022 May;40(5):681-691.
doi: 10.1038/s41587-021-01186-x. Epub 2022 Feb 28.

Multiscale PHATE identifies multimodal signatures of COVID-19

Collaborators, Affiliations

Multiscale PHATE identifies multimodal signatures of COVID-19

Manik Kuchroo et al. Nat Biotechnol. 2022 May.

Abstract

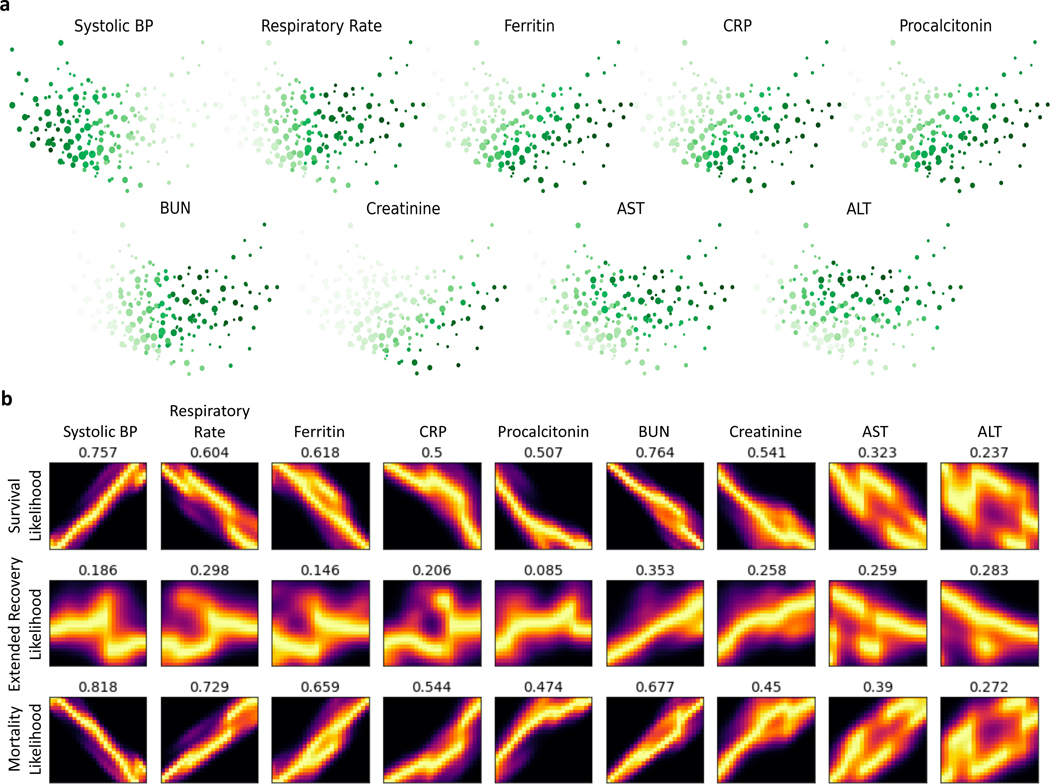
As the biomedical community produces datasets that are increasingly complex and high dimensional, there is a need for more sophisticated computational tools to extract biological insights. We present Multiscale PHATE, a method that sweeps through all levels of data granularity to learn abstracted biological features directly predictive of disease outcome. Built on a coarse-graining process called diffusion condensation, Multiscale PHATE learns a data topology that can be analyzed at coarse resolutions for high-level summarizations of data and at fine resolutions for detailed representations of subsets. We apply Multiscale PHATE to a coronavirus disease 2019 (COVID-19) dataset with 54 million cells from 168 hospitalized patients and find that patients who die show CD16hiCD66blo neutrophil and IFN-γ+ granzyme B+ Th17 cell responses. We also show that population groupings from Multiscale PHATE directly fed into a classifier predict disease outcome more accurately than naive featurizations of the data. Multiscale PHATE is broadly generalizable to different data types, including flow cytometry, single-cell RNA sequencing (scRNA-seq), single-cell sequencing assay for transposase-accessible chromatin (scATAC-seq), and clinical variables.


Conflict of interest statement

Competing interests

The remaining authors declare no competing interests.

Figures

Extended Data Fig. 1 |
Extended Data Fig. 1 |. Condensing on manifold, reproducibility and run time comparisons.
a, Visualization of toy swiss roll after performing condensation in euclidean space or on diffusion potential. Top: schematic of the movement vectors of each point when run in euclidean space or on diffusion potential for one iteration. Bottom: Visualization of toy swiss roll dataset after several iterations of diffusion condensation, running in both euclidean space and diffusion potential. b, Comparison of diffusion condensation on diffusion potential to diffusion condensation on ambient measurement dimensions on an increasingly noisy stochastic block model to simulate nonlinear noise in a high-dimensional space. In this model, increasing amounts of Gaussian noise were added to the edge weights of the adjacency matrix. c, Pipeline for identifying cellular populations enriched based on clinical variables with Multiscale PHATE and MELD. d, Comparing run time across visualization techniques on increasingly high-dimensional flow cytometry data. e, Visualization of reproduciblity of Multiscale PHATE across two different runs of PBMCs measured by scRNA-seq. Each run was initialized with a different random seed.
Extended Data Fig. 2 |
Extended Data Fig. 2 |. Visualization of differing high-dimensional biological data types.
Visualization comparison across a range of data types: 22 million PBMCs measured by flow cytometry (Lucas et al.), 49,942 PBMCs by scRNA-seq (Lee et al.), 2,135 patients admitted to YNHH by demographic and lab clinical variables, 25,528 cells from a diverse set of mouse tissues measured by scATAC-seq (Cusanovich et al.), 1,010,964 PBMCs measured by CyTOF (Hartmann et al.) and 50,000 TCRs from COVID-19 infected patients and healthy controls (Nolan et al., Corrie et al.).
Extended Data Fig. 3 |
Extended Data Fig. 3 |. Multiscale PHATE is capable of identify extractable cellular subsets from massive single-cell data.
a, Multiscale PHATE visualization of PBMCs identifies all major cell types based on cell type–specific markers. b, PHATE visualization of subsample of 25,000 PBMCs helps identify all major cell types based on cell type–specific markers using Multiscale PHATE clustering. c, Zoom in of subsection of Multiscale PHATE manifold resolves crowding in coarse grain visualization. d, Zoom in of subsection of PHATE manifold does not resolve crowding. e, Multiscale PHATE is able to identify subpopulations enriched in patients who die from COVID. The plot on the right is colored by Multiscale PHATE-identified clusters. f, PHATE and vertex frequency clustering (VFC) are unable to identify subpopulations enriched in patients who die from COVID. The plot on the right is colored by VFC identified clusters. g, Multiscale PHATE-identified populations show differing enrichments in patients who die from COVID19. One of the B cell subsets (lighter blue color) are enriched in patients who die from COVID. h, Multiscale PHATE’s hierarchical approach to clustering provides a gating strategy to isolate subsets of B cells enriched in patients who die from COVID19. i, VFC identified populations do not isolate mortality enriched cellular subsets as well as Multiscale PHATE.
Extended Data Fig. 4 |
Extended Data Fig. 4 |. Visualization of differing multiscale dimensionality reduction techniques.
a, Visualization of noisy splatter data with either path of cluster geometry embedded with algorithms created for condensation ablation study performed in Fig. 2b. b, Visualization of noisy splatter data with either path of cluster geometry embedded with algorithms created for PHATE ablation study performed in Fig. 2c. c, Quantitative study comparing embeddings produced by Multiscale PHATE and visualization strategies which either employ community based or topologically based abstractions of data on 1.7 million cells from FlowCAP I Normal Donor (ND) dataset. Comparisons were evaluated using DeMAP with increasing levels of 2 different types of biological noise, dropout and variation. Shading represents standard deviation around mean DeMAP score for each comparison. d, Quantitative study comparing embeddings produced by Multiscale PHATE and visualization strategies which visualize condensation based abstractions of data. Comparisons were run and represented as described in b.
Extended Data Fig. 5 |
Extended Data Fig. 5 |. Comparison of Multiscale PHATE with other clustering techniques on hierarchical stochastic block model.
a, Computed Adjusted Rand Index (ARI) between each algorithm’s predicted clusters and the known clusters on synthetic single-cell data generated by splatter (Zappia et al.) across a range of noise types, dropout and biological variation, and noise levels. Shading represents one standard deviation around mean ARI score for each comparison. b, Schematic of the hierarchical stochastic block model we generated for multigranular cluster comparisons. For each method, increasing amounts of random Gaussian noise were added to the adjacency matrix of stochastic block model to simulate increasing amounts of noise. While adding noise directly to data introduces simple linear noise, adding Gaussian noise to the edge weights of an adjacency matrix simulates more complex non-linear type of noise which is often present in high-dimensional biological data. c, Computed Adjusted Rand Index (ARI) between each algorithm’s predicted clusters and the known clusters across coarse and fine granularities of 2 layer stochastic block model perturbed with increasing amounts of noise. Shading represents one standard deviation around mean ARI score for each comparison. d, Computed Adjusted Rand Index (ARI) between each algorithm’s predicted clusters and the known clusters across coarse, intermediate and fine granularities of 3 layer stochastic block model perturbed with increasing amounts of noise. Shading represents one standard deviation around mean ARI score for each comparison.
Extended Data Fig. 6 |
Extended Data Fig. 6 |. Comparison of Multiscale PHATE with other clustering tools on real data.
a, Comparison of multiple clustering approaches on flow cytometry data where cell types and subtypes have been identified through gating analysis. Clusters identified by different approaches were compared to gated populations using ARI and F1 score. b, Comparison of multiple clustering techniques at identifying regions with uniform MELD likelihood scores across a range of comparable granularities. c, Comparison of multiple clustering techniques across a range of granularities on flow cytometry data with cell types and subtypes identified as done in a. d, Comparison of multiple clustering techniques across increasing amounts of noise of different types, biological variation and dropout, as done in Extended Data Fig. 3. As done in Extended Data Fig. 3, noise was added to FlowCAP I Normal Donor (ND) dataset with known clusters. Shading represents one standard deviation around mean ARI score for each comparison.
Extended Data Fig. 7 |
Extended Data Fig. 7 |. Multiscale PHATE identifies subsets of monocytes and B cells enriched in patients who died of COVID-19.
a, Zoom in of monocyte population identifies subsets based on expression of markers. Colors denote cell type and size of a dot is proportional to number of cells represented. b, Visualization of mortality likelihood score as computed by MELD in monocytes identifies subsets enriched in patients who die from COVID-19. Key associations between markers and mortality likelihood score computed by DREMI and visualized with DREVI. c, Visualization of B cells panel identifies a range of subsets based on expression of known markers. Colors denote cell type and size of a dot is proportional to number of cells represented. d, Visualization of mortality likelihood score identifies B cell subsets enriched in patients who die from COVID-19. e, Comparison of mortality likelihood score across panels reveals that granulocytes and monocytes are broadly the most enriched cell types in patients who die from COVID-19.
Extended Data Fig. 8 |
Extended Data Fig. 8 |. Multiscale PHATE analysis identifies subsets of CD8+ T cells enriched in patients with poor COVID-19 outcomes.
a, Zoom in of CD8+ T cells identifies subsets based on expression of markers. Colors denote cell type and size of a dot is proportional to number of cells represented. b, Visualization of mortality likelihood score as computed by MELD in CD8+ T cells identifies subsets enriched in patients who die from COVID-19. Key associations between Granzyme B and mortality likelihood computed by DREMI and visualized with DREVI. c, Multiscale PHATE visualization of T cell focused surface marker panel with broad T cell subtypes identified. Colors denote cell type and size of a dot is proportional to number of cells represented. d, Zoom in of CD8+ T cells identifies subsets based on expression of known markers. e, Visualization of mortality likelihood score as computed by MELD in CD8+ T cells identifies subsets enriched in patients who die from COVID-19. Key associations between markers and mortality likelihood computed by DREMI and visualized with DREVI.
Extended Data Fig. 9 |
Extended Data Fig. 9 |. Visualization of patient manifold and correlation with clinical features.
a, Visualizing clinical variables on patient manifold. Darker color indicates higher normalized numerical values. b, DREMI and DREVI association analysis between clinical variables and mortality as well as cellular populations. c, PHATE visualizations of patient manifolds created by Multiscale PHATE (top), conventional flow cytometry gating (middle) and single resolution of louvain clusters (bottom). Patients who died are highlighted in orange.
Extended Data Fig. 10 |
Extended Data Fig. 10 |. Visualization of multiscale clinical manifold and correlation with patient clinical features.
a, Visualizing clinical variables on clinical manifold as computed by Multiscale PHATE. Size of a dot is proportional to number of patients represented and darker color indicates higher normalized numerical values. b, DREMI and DREVI association analysis between clinical features and patient hospitalization outcome likelihood as computed by MELD.
Fig. 1 |
Fig. 1 |. Overview of the Multiscale PHATE algorithm.
a, Multiscale PHATE process involves four successive steps. The first step (i) learns the manifold geometry via diffusion potential calculation. The second step (ii) iteratively coarse grains the manifold construction through a fast diffusion condensation process to learn data topology. The third step (iii) involves the selection of salient granularities via gradient analysis before finally visualizing and clustering the manifold in the fourth step (iv). coef, coefficient. b, Gradient analysis identifies a range of scales for visualization by computing shifts in data density from one iteration of the diffusion condensation process to the next. c, Multiscale PHATE allows for high-level summarizations of data and zoom ins of data subsets for additional detail. d. Multiscale PHATE abstractions of data are amenable to downstream analyses with algorithms like MELD (ref. ) and DREMI (ref. ).
Fig. 2 |
Fig. 2 |. Comparison of Multiscale PHATE with other dimensionality reduction tools.
a, Visual comparison of Multiscale PHATE (MS-PHATE) with other multiscale dimensionality reduction tools on synthetic single-cell data with either path or cluster structure. In Multiscale PHATE embeddings, each point represents a group of cells that are considered close enough to merge and the size of a dot is proportional to number of cells in that group. Remaining visualizations from multiscale dimensionality reduction tools shown in Extended Data Fig. 4. b, Quantitative study comparing embeddings produced by Multiscale PHATE and dimensionality reduction strategies that used either community-based or topologically based abstractions of data. Comparisons were evaluated using DeMAP with increasing levels of two different types of biological noise, dropout and variation, as well as on data with different structures, paths and clusters. Shading represents one standard deviation around the mean DeMAP score for each comparison. c, Quantitative study comparing embeddings produced by Multiscale PHATE and alternative dimensionality reduction strategies that visualize condensation-based abstractions of data. Comparisons were run and represented as described in b.
Fig. 3 |
Fig. 3 |. The CD16hiCD66blo neutrophil subset was enriched in patients who died of COVID-19.
a, Multiscale PHATE visualization of PBMCs identifies all major cell types based on cell type-specific markers. Colors denote cell type and size of a dot is proportional to number of cells represented. b, Visualization of mortality likelihood score computed by MELD on coarse-grain Multiscale PHATE visualization of PBMCs as visualized in a. c, Visualization of mortality likelihood score computed by MELD organized by cell type revealed enrichment of granulocytes, monocytes and B cells in patients who died of COVID-19. Each dot represents a grouping of cells at the resolution visualized in a. d, Zoom in of granulocyte population identified subsets of neutrophils and eosinophils based on expression of known markers. e, Visualization of mortality likelihood score in granulocyte population identified CD16hi neutrophils enriched in patients with worse outcomes. Key associations between markers and mortality likelihood scores in neutrophils computed by DREMI and visualized with DREVI.
Fig. 4 |
Fig. 4 |. Multiscale PHATE identified Th17 cell subsets enriched in patients who died of COVID-19.
a, Multiscale PHATE visualization of a T cell-focused cytokine panel identified broad T cell subtypes. Each point is a subgroup of cells, and the size is proportional to the number of cells in the group. b, Zoom in of CD4+ Th cells identified subsets based on expression of functional markers. c, Visualization of mortality likelihood score computed by MELD identified IFN-γ+ granzyme B+ Th17 cell enrichment in patients with poor outcomes. Key associations between markers and mortality likelihood scores were computed by DREMI and visualized with DREVI. DC, dendritic cell; neut, neturophil; NK, natural killer.
Fig. 5 |
Fig. 5 |. Patient manifold corroborated cellular states associated with disease pathogenesis.
a, Visualization of patient manifold via PHATE and mortality likelihood score based on patient outcomes computed via MELD. Each point in the PHATE plot represents a patient time point. b, Visualization of key cell population enrichment trends over the manifold, with associations computed by DREMI and visualized with DREVI. A darker color in the PHATE plot indicates higher enrichment of the cell type. c, Tracing the hospital courses of three patients over the patient manifold. Patients 19 and 63 were discharged, whereas patient 54 died. d, Comparing the predictability of patient mortality using random forest classifier on Multiscale PHATE-identified populations, flow cytometry-identified populations and Louvain populations. Accuracy was derived from fivefold cross-validation. The most predictive Multiscale PHATE clusters were ranked using feature-importance analysis.
Fig. 6 |
Fig. 6 |. Multiscale manifold of patient clinical features identified cell types associated with an extended COVID-19 recovery phase.
a, Visualization of a Multiscale PHATE clinical manifold constructed on patient clinical features. Embedding is colored by likelihood scores based on patient outcomes computed via MELD. b, Zoom in on the transition point between a high extended recovery likelihood score and a high survival likelihood score. c, Patient clinical features and flow cytometry-identified cell populations associated with patient outcomes using DREMI and visualized with DREVI.

References

    1. Klein AM et al. Droplet barcoding for single-cell transcriptomics applied to embryonic stem cells. Cell 161, 1187–1201 (2015). - PMC - PubMed
    1. Macosko EZ et al. Highly parallel genome-wide expression profiling of individual cells using nanoliter droplets. Cell 161, 1202–1214 (2015). - PMC - PubMed
    1. Buenrostro JD et al. Single-cell chromatin accessibility reveals principles of regulatory variation. Nature 523, 486–490 (2015). - PMC - PubMed
    1. van der Maaten L. & Hinton G. Visualizing high-dimensional data using t-SNE. J. Mach. Learn. Res 9, 2579–2605 (2008).
    1. Becht E. et al. Dimensionality reduction for visualizing single-cell data using UMAP. Nat. Biotechnol 37, 38 (2019). - PubMed

Publication types