. 2022 Feb;4(2):284-299.
doi: 10.1038/s42255-022-00531-x. Epub 2022 Feb 28.

Single-cell multi-omics analysis of human pancreatic islets reveals novel cellular states in type 1 diabetes

Collaborators, Affiliations

Single-cell multi-omics analysis of human pancreatic islets reveals novel cellular states in type 1 diabetes

Maria Fasolino et al. Nat Metab. 2022 Feb.

Abstract

Type 1 diabetes (T1D) is an autoimmune disease in which immune cells destroy insulin-producing beta cells. The aetiology of this complex disease is dependent on the interplay of multiple heterogeneous cell types in the pancreatic environment. Here, we provide a single-cell atlas of pancreatic islets of 24 T1D, autoantibody-positive and nondiabetic organ donors across multiple quantitative modalities including ~80,000 cells using single-cell transcriptomics, ~7,000,000 cells using cytometry by time of flight and ~1,000,000 cells using in situ imaging mass cytometry. We develop an advanced integrative analytical strategy to assess pancreatic islets and identify canonical cell types. We show that a subset of exocrine ductal cells acquires a signature of tolerogenic dendritic cells in an apparent attempt at immune suppression in T1D donors. Our multimodal analyses delineate cell types and processes that may contribute to T1D immunopathogenesis and provide an integrative procedure for exploration and discovery of human pancreatic function.


Figures

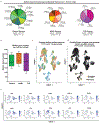
Extended Data Fig.1:
Extended Data Fig.1:. Cell numbers and clustering before complete filtering
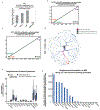
a) Pie chart displaying the cell numbers and proportions of each individual donor per donor type. b) Box plot displaying the average gene number per cell per donor type. c) UMAP visualization of cell clusters for all cells. d) Doublets and singlets, as identified using DoubletFinder, across cell clusters visualized by UMAP. e) UMAP visualization of the normalized gene expression counts of each canonical gene marker of each major cell type.
Extended Data Fig.2:
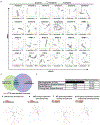
Extended Data Fig.2:. Doublet removal and UMI counts
a) Doublets and singlets, as identified using Scrublet, across cell clusters visualized by UMAP per individual. b) Venn diagram indicating the number of cells deemed doublets by DoubletFinder and Scrublet, as well as cells that were commonly identified by both approaches. c) Table indicating the number of cells removed and the resulting total cell number for each step of filtering. d) Unique molecular identifier (UMI) counts per cell projected across the dendrogram visualization and clustering of all cells from Figure 1c. Pie charts at the end of the branches display the breakdown of UMI counts per cell within that terminal cluster. Cells begin at the start pin symbol, and from there are partitioned based on similarities and differences in gene expression. e) UMI counts per cell projected across the dendrogram visualization and clustering of ductal and endocrine cells from Figure 1d. Pie charts at the end of the branches display the breakdown of UMI counts per cell within that terminal cluster. Cells begin at the start pin symbol, and from there are partitioned based on similarities and differences in gene expression. f) Expression of genes associated with mitochondrial function projected across the dendrogram visualization and clustering of all cells from Figure 1c. g) Expression of genes associated with mitochondrial function projected across the dendrogram visualization and clustering of ductal and endocrine cells from Figure 1d.
Extended Data Fig.3:
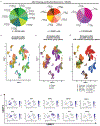
Extended Data Fig.3:. Cell numbers and clustering after complete filtering
a) Pie chart displaying the cell numbers/proportions of each individual donor per donor type. b) UMAP visualization of cell clusters for all cells. c) UMAP visualization donor groups across clusters for all cells. d) UMAP visualization of Garnett cellular classifications across clusters for all cells. e) UMAP visualization of the normalized gene expression counts of each canonical gene marker of each major cell type.
Extended Data Fig.4:
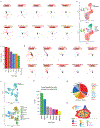
Extended Data Fig.4:. Marker gene expression confirms canonical cell types
a) Dendrograms highlighting the expression of each canonical gene marker of each major cell type across the dendrogram of all cells in Figure 1c. b) The classification of our scRNA-seq data was confirmed by a label transfer strategy using a previous single-nucleus RNA-seq data set in pancreatic islets. c) Bar plot demonstrates percentages of agreement between previous annotation and our strategy using a label-transfer strategy. d) Dendrograms highlighting the expression of each canonical gene marker of each major cell type across the dendrogram of ductal and endocrine cells in Figure 1d. e) To further validate the most closely related cell types to Hybrid cells, we used a label transfer strategy to a previous pancreatic islet scRNA-seq data set. In concordance with Garnett and canonical gene markers, we corroborated the assignment of beta, alpha, and PP cells to these Hybrid cells. f) Bar plot demonstrates annotation results of label transfer for cells grouped as Hybrid cells. g) Pie chart displaying the cell numbers/proportions of each cell type defined in Figure 1, c and d. h) Schematic of the human pancreatic islet anatomy and major cell types.
Extended Data Fig.5:
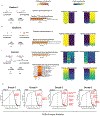
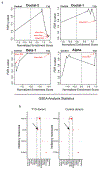
Extended Data Fig.5:. Gene and gene ontology pathways that are shared and different across disease states in Epsilon-1, Epsilon-2, and Immune cells
(a-c) (Left) For each cell type, Venn diagrams indicate the numbers of upregulated and downregulated genes, as well as overlapping genes, across the two disease states. Circles indicate the numbers of genes that are ‘T1D enriched’ or ‘AAB enriched’. p-values presented are the results of hypergeometric CDF tests (one-tailed test for overrepresentation). (Middle) For each cell type, displayed are gene ontology pathways that are shared across T1D and AAB+ cells when compared to Control cells (top) or pathways that are differently enriched in T1D cells vs AAB+ cells (bottom). The top 20 clusters are displayed and a stringent cut-off of 1e-6 was applied to determine significant gene ontology pathways. (Right) Heatmaps displaying the degree of gene expression changes of genes (rows) that are shared (top) or differential (bottom) across AAB+ and T1D disease states. (d) GSEA analysis plots of FDR q-value vs Normalized Enrichment Score. For both ductal populations, Ductal-1 and Ductal-2, T1D cells were compared to AAB+ or Control cells to determine differentially enriched gene sets. Demarcated in red and labeled are signatures of interest.
Extended Data Fig.6:
Extended Data Fig.6:. Corroboration of HLA-DR+ Ductal cells
(a-b) Dendrograms highlighting the expression of the MHC class II complex (a) or MHC class II activity (b) across the dendrogram of all cells in Figure 1C. Scale bars represent normalized transcript numbers (mean across all MHC class II complex genes (a) or MHC class II activity genes (b)). (c-d) Dendrograms highlighting the expression of the MHC class II complex (c) or MHC class II activity (d) across the dendrogram of ductal and endocrine cells in Figure 1D. Scale bars represent normalized transcript numbers (mean across all MHC class II complex genes (c) or MHC class II activity genes (d)). (e-f) Dendrograms highlighting the expression of the HLA-DPB1 (E) or KRT19 (f) across the dendrogram of ductal and endocrine cells in Figure 1D. Scale bars represent normalized transcript numbers. g) Dendrograms highlighting the expression of the immune-related genes across the dendrogram of ductal and endocrine cells in Figure 1D. Scale bars represent normalized transcript numbers. (h) Dendrograms highlighting the expression of the BMPR1A across the dendrogram of ductal and endocrine cells in Figure 1D. Scale bars represent normalized transcript numbers.
Extended Data Fig.7:
Extended Data Fig.7:. GSEA analysis across annotated cells types for dendritic cells gene sets.
a) DC1 gene signature is significantly enriched within Ductal-2 cells of T1D donors. Integrated GSEA analysis for dendritic cells gene sets from Villani et al across ranked lists of differentially expressed genes between T1D and control donors. b) Expression analysis of the inhibitory marker VSIR in dendritic cells demonstrates the high level of this gene in T1D ductal cells compared with control ductal cells.
Extended Data Fig.8:
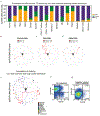
Extended Data Fig.8:. CyTOF validation of canonical cell types
a) Bar graph displaying the proportion of cells for all major pancreatic cell types from each donor group where cell annotations were obtained by our new machine-learning based strategy using CyTOF measurements across 12 donors. b) Dendrogram visualization of the immune cell cluster, CD45 positive (+) cells, as determined by the analysis of the flow cytometry by time-of-flight (CyTOF) data. c) Dendrogram visualization of the beta cell cluster, C-peptide positive (+) cells, as determined by the analysis of the CyTOF data. d) Dendrogram visualization of the alpha cell cluster, Glucagon positive (+) cells, as determined by the analysis of the CyTOF data. e) Major cell types projected on TooManyCells tree based on our machine-learning based annotation using CyTOF data (n=6,945,575 cells). f) Two-parameter CyTOF analysis of HLA-DR and cytokeratin protein expression in single cells from T1D donor #3 (HPAP023). g) Two parameter CyTOF analysis of HLA-DR and cytokeratin protein expression in single cells from Control donor #3 (HPAP034), a donor with a very low percentage of HLA-DR+ ductal cells as determined by unbiased analysis of CyTOF data with TooManyCells.
Extended Data Fig.9:
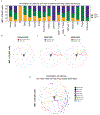
Extended Data Fig.9:. IMC validation of HLA-DR+ ductal cells
a) Bar graph displaying the proportion of cells for all major pancreatic cell types from each donor group where cell annotations were obtained by our machine-learning-based strategy using IMC measurements. Further manual inspection of CD19 and FOXP3 staining used for annotating B and Tregs indicated low quality of these markers across tissue slides. b) Dendrogram visualization of the immune cell cluster, CD45 positive (+) cells, as determined by the analysis of the imaging mass cytometry (IMC) data analysis. c) Dendrogram visualization of the beta cell cluster, C-peptide positive (+) cells, as determined by the analysis of the IMC data analysis. d) Dendrogram visualization of the alpha cell cluster, Glucagon positive (+) cells, as determined by the analysis of the IMC data analysis. e) Major cell types projected on TooManyCells tree as they were annotated by our machine-learning based strategy using IMC data (n=1,170,001 cells).
Extended Data Fig.10:
Extended Data Fig.10:. Cellular neighborhood analysis in IMC data demonstrates the enrichment of CD4+ T cells surrounding HLA-DR+ ductal cells
a) Bar plot displaying the proportion of HLA-DR+ cytokeratin+ cells from each pancreatic region determined by IMC. b-c) HLA-DR+ cytokeratin+ cells versus percentage of myeloid cells. For each donor group, the median of percentage of each annotated immune subtype and the median HLA-DR+ ductal cell percentage of total cells across all individual donors per donor group was computed. Only myeloid cells demonstrated significant correlation with respect to the number of HLA-DR+ cytokeratin+ cells across donor groups. d) Dendrogram visualization of the clusters of HLA-DR+ cytokeratin+ cells (red), cells neighboring HLA-DR+ cytokeratin+ (blue), and cells distant from HLA-DR+ cytokeratin+ cells (grey) as determined by leveraging the spatial architecture provided by IMC data. e) Boxplots showing the normalized protein expression of different canonical markers in cells neighboring HLA-DR+ cytokeratin+ cells (blue) versus cells neighboring random cells (grey). The number of random cells evaluated was equal to the number of HLA-DR+ cytokeratin+ cells. Differential marker expression significance for neighbors in the IMC analysis was determined using permutation tests. For each marker, the distribution of that marker value for each of the designated n neighbors was compared against 100 distributions derived from n random cells across the entire IMC tree. * indicates p-value < 0.01. Total number of cells in both blue and gray groups is 195,633. Box-and-whisker plots (centre, median; box limits, upper (75th) and lower (25th) percentiles; whiskers, 1.5 × interquartile range; points, outliers). f) CD4+ T cells are the number one immune subtypes enriched at the neighborhood of HLA-DR+ cytokeratin+ cells. Annotation of neighbors of HLA-DR+ cytokeratin+ cells was performed our machine-learning based strategy.
Figure 1:
Figure 1:. Discernment of human pancreatic cell types using single-cell RNA-seq
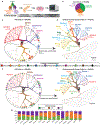
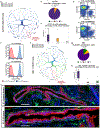
a) The transcriptome of single cells from pancreatic islets of 3 donor types (healthy Control donors, autoantibody positive (AAb+) donors, and donors with Type 1 diabetes (T1D)) was ascertained using the 10x Genomics platform. b) Pie chart displaying the proportion of cells comprised by each donor group. c) TooManyCells dendrogram visualization and clustering of all cells. Cells begin at the start pin symbol, and are then partitioned based on transcriptional similarities and differences. The color within the branches indicates the proportion of the cells that are classified by the Garnett cellular classification tool (Table S17). Each bifurcation denotes significant transcriptional differences between the two cell groups. Pie charts at the end of the branches display the breakdown of Garnett cellular classification of cells within that terminal cluster. Highlighting or dotted lines surrounding particular clusters of cells with labels define cell types based on Garnett cellular classifications and canonical gene expression. Branch thickness and pie-chart size is proportional to cell number. Branch length is not indicative of any factor, but is merely a means by which to display cells within a defined space. Beta cells (INS high), alpha cells (GCG high), delta cells (SST high), PP cells (PPY high), epsilon cells (GHRL high), acinar cells (CPA1 high), ductal cells (KRT19 high), endothelial cells (VWF high), stellate cells (RSG10 high), and immune cells (PTPRC, also known as CD45 or leukocyte common antigen, high). Percentages provided represent the percentage of total cells. d) Dendrogram visualization and clustering of ductal and endocrine cells. Highlighting or dotted lines surrounding particular clusters of cells with labels define cell types based on Garnett cellular classifications and canonical gene expression. (e-f) Group donor type projected across the dendrogram visualization and clustering of all cells from Figure 1C (e) or of endocrine and ductal cells from Figure 1D (f). Pie charts at the end of the branches display the breakdown of donor type within that terminal cluster. (g) Bar graph displaying the proportion of cells from each donor group for all major pancreatic cell types. The p-values are calculated by the Chi-squared test
Figure 2:
Figure 2:. AAb+ and T1D donors have both common and distinct transcriptomic changes in endocrine and exocrine cell types
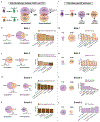
a) For each cell type, two pairwise differential comparisons were carried out: (1) T1D versus Control (referred to as ‘T1D upregulated’ (T1D/Control) or ‘T1D downregulated’ (Control/T1D)) and (2) AAB+ versus Control (referred to as ‘AAB+ upregulated’ (AAB+/Control) or ‘AAB+ downregulated’ (Control/AAB+)). T1D upregulated genes were then compared to AAB+ upregulated genes to find commonly upregulated genes, and subsequently commonly upregulated gene ontologies and pathways, across these two donor groups; this exact same approach was carried out for downregulated genes as well. (b-e) (Left) For each cell type, Venn diagrams indicate the numbers of upregulated and downregulated genes, as well as overlapping genes, across the two donor states. (Right) Bar graph displaying notable gene ontologies that are shared across disease states for upregulated and downregulated genes. The p-values presented are the results of hypergeometric CDF tests (one-tailed test for overrepresentation). (f) Transcriptional differences between cells from T1D and AAb+ donors were determined by directly comparing T1D to AAB+ cells to generate lists of differentially expressed genes that are enriched in T1D cells or AAB+ cells, and enriched gene ontology pathways were discovered from these differential gene lists. (g-j) (Left) For each cell type, circles indicate the numbers of genes that are ‘T31D enriched’ or ‘AAB enriched’. (Right) Bar graph displaying notable gene ontologies that are enriched for each donor state.
Figure 3:
Figure 3:. The gene signature of Beta-1 cells in GAD+ donors is correlated with donors’ anti-GAD autoantibody titers.
a) Transcriptional outputs of Beta-1 cells positively correlate with the anti-GAD AAb titer in AAb+ donors. In every annotated cell type, we searched for genes whose expression level correlated with anti-GAD AAb levels in normoglycemic GAD+ donors (R2>0.99 and p-value<0.05). b) Plotting the average expression levels of cells from each GAD+ donor for the top 1,473 genes in Beta-1 cells with statistically significant correlation with the GAD titers corroborated our query. The total number of cells is 6,904. The plot shows a box-and-whisker plot of the given values. Lower 25th percentile (Q1), Interquartile range (IQR), Median (Q2), Upper 75th percentile (Q3). Minimum (Minimum value in the data, Q1-1.5 * IQR), Maximum (Maximum value in the data, Q3+1.5*IQR). The dots represents potential outliers. c) A gene-ontology analysis in 1,473 genes related to Beta-1 cells using metaScape highlighted the relevance of endocytosis, protein processing in ER and MapK signaling pathway in Beta-1 cells. d) Comparison of the cell clustering of the one normoglycemic AAb+ donor expressing two autoantibodies (IA-2 and ZnT8) with GAD+ donors using clumpiness revealed the distinct transcriptional signature of the double autoantibody-expressing autoantibody donor and the single autoantibody-expressing GAD+ donors. Clumpiness is a measure for finding the level of aggregation between labels distributed among the leaves of a hierarchical tree and extensively measures the relationships between metadata. Here, each leaf of the dendrogram contains a collection of labels (different AAB donor group). The more the labels group together within the dendrogram, the higher the clumpiness value. This analysis also demonstrates the overall similarity of GAD+ donors, which modestly displayed GAD level-dependent cell co-segregation.
Figure 4:
Figure 4:. Single-cell RNA-seq profiling enables the identification of MHC Class II-expressing ductal cells with transcriptional similarities to dendritic cells in T1D
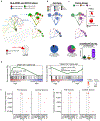
a) (Left Top) Dendrogram visualization of co-expression of HLA-DPB1 and KRT19 gene transcripts in individual cells by scRNA-seq across the ductal and endocrine dendrogram from Figure 1D. (Left Bottom) Pie chart demonstrating HLA-DPB1+KRT19+ cells as percentage of total cells. (Right) Magnified view of the clusters of cells with high percentage (25% or greater) of HLA-DPB1+KRT19+ cells with HLA-DPB1 and KRT19 status displayed across these clusters (outlined in red dashed lines) and neighboring clusters of cells. Cells begin at the start pin symbol and from there are partitioned based on similarities and differences in gene expression. b) (Top) Dendrogram visualization of cellular classification status across the magnified clusters of cells with high percentage (25% or greater) of HLA-DPB1+KRT19+ cells (outlined in red dash lines) and neighboring clusters of cells. (Bottom) Pie chart displaying the relative proportion of cellular classification status of HLA-DPB1+KRT19+ cells. The p-value presented is the result of the Chi-squared test. c) (Top Left) Dendrogram visualization of donor group across the magnified clusters of cells with a high percentage (25% or greater) of HLA-DPB1+KRT19+ cells (outlined in red) as well as neighboring clusters of cells. (Top Right) Pie chart displaying the relative proportion of HLA-DPB1+KRT19+ cells in Control (top) or T1D (bottom) Ductal-1 cells. The p-value presented is the result of the Fisher exact test. (Bottom Left) Pie chart displaying the relative proportion of donor group of HLA-DPB1+KRT19+ cells. The p-value presented is the result of the Chi-squared test. (Bottom Right) Box plots displaying the HLA-DPB1+KRT19+ cell percentage of total cells per individual across donor groups. 24 total donors: 11 controls, 8 AAB+,and 5 T1D. A box-and-whisker plot is depicted with the box extending from the 25th to 75th percentiles, the line in the middle representing the median, whiskers extending from the minimum to the maximum, and all data points shown. d) T1D ductal cells are transcriptionally similar to tolerogenic dendritic cells. Gene-set enrichment analysis was performed using gene signatures of DC subtypes, which were recently defined using scRNA-seq in human blood. The DC1 dendritic cell gene signature was enriched in Ductal-2 cells but not Beta-1 cells of T1D donors. e) The co-stimulatory proteins CD80 or CD86 are not expressed in T1D ductal cells. f) Ductal cells of T1D donors express interferon-associated genes including ISG20, ICAM1, and IRF7 compared with those of control donors.
Figure 5:
Figure 5:. Three single-cell resolution protein-based approaches corroborate the existence of MHC Class II-expressing ductal cells in T1D
a) Dendrogram visualization of co-expression of HLA-DR and cytokeratin protein coexpression in single cells analyzed with flow cytometry by time-of-flight (CyTOF). b) Pie chart displaying HLA-DR+ cytokeratin+ cells and the relative proportions of each donor group from the CyTOF data. The p-value was calculated by the Chi-squared test. c)Box plots displaying HLA-DR+ cytokeratin+ cell percentage of total cells per individual across donor groups derived from the CyTOF data (p-value=0.00507). Number of donors: AAB+ : 4; Control : 4; T1D : 4. Figure depicts box-and-whisker plot showing the quartiles, minimum non-outlier calculated by (Q1 – 1.5*IQR), 25th percentile/lower quartile Q1, 50th percentile/median Q2, 75th percentile/upper quartile Q3, maximum non-outlier calculated by (Q3 + 1.5*IQR) of the variable (hybrid percentage of total cells per individual) while the whiskers extend to show the rest of the distribution, except for points that are determined to be “outliers” (dots outside whiskers) using a method that is a function of the inter-quartile range. d) Two-parameter CyTOF analysis of HLA-DR and cytokeratin protein expression in single cells from T1D donor #4 (HPAP028) and T1D donor #5 (HPAP032). e) CD45 (PTPRC) expression levels in HLA-DR+ cytokeratin+ and HLA-DR+ cytokeratin- single cells. f) Dendrogram visualization of co-expression of HLA-DR and cytokeratin proteins in single cells analyzed by imaging mass cytometry (IMC). g) Pie chart displaying HLA-DR+ cytokeratin+ cells and the relative proportions of each donor group from the IMC data. The p-value was calculated by the Chi-squared test. The p-value shows 0.000 by both Chi-square function from scipy.stats (python) for the observed frequency array [34983,3711,4635] : [T1D,AAB+,Control], and cannot provide exact p-value. h) Box plots displaying HLA-DR+ cytokeratin+ cells as a percentage of total cells per individual across donor groups from the IMC data (p-value=1e-16). Number of donors: AAB+ : 7; Control : 5; T1D : 4. p-value is obtained from a one-way ANOVA test. i) Representative confocal microscopy image from the pancreas of a T1D donor (top) and Control donor (bottom) displaying HLA-DR+ cytokeratin+ labeled by immunofluorescence (IF). Control (n=3) and T1D (n=2).
Figure 6:
Figure 6:. Representative examples of IMC measurement corroborates that MHC Class II positive ductal cells are present in pancreatic tissues.
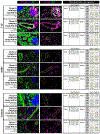
(Left) Imaging mass cytometry (IMC) in a region of interest (ROI) in pancreatic tissue from three representative individual donors for each donor group type (T1D, AAB+, and Control). HLA-DR is a general marker of MHC Class II (HLA-DR) expression, CD99 is a general islet marker, KRT (pan-keratin) is a ductal cell marker, and CD45 (PTPRC) is a general immune cell marker. Notably, HLA-DR+ ductal cells were primarily located in large ductal structures (outlined in yellow). The images presented here are publicly available at https://www.pancreatlas.org/datasets/508. (Right) HLA typing performed by next-generation sequencing. Comprehensive clinical information about each donor is provided in PANC-DB: https://hpap.pmacs.upenn.edu/. Highlighted in yellow are the particular HLA alleles contributing to the susceptible or protective genotypes, which are abbreviated for each donor on the left side of the figure as follows. The four susceptible genotypes assessed were (1) HLA-DRB1*03:01-HLA-DQA1*05:01-HLA-DQB1*02:01 (abbreviated as ‘DR3’, referring to the haplotype bearing the DRB1*03 allele); (2) HLA-DRB1*04:01/02/04/05/08-HLA-DQA1*03:01-HLA-DQB1*03:02/04 (or HLA-DQB1*02) (abbreviated as ‘DR4’, referring to the haplotype bearing the DRB1*04 allele); (3) HLA-A*24:02; and (4) HLA-B*39:06. The two protective genotypes assessed were (1) HLA-DRB1*15:01-HLA-DQB1*06:02 and (2) HLA-DRB1*07:01-HLA-DQB1*03:03,,. Notably, HLA-DR+ ductal cells were found across all HLA genotypes, including both susceptible and protective genotypes.

References

    1. Powers AC Type 1 diabetes mellitus: much progress, many opportunities. J Clin Invest 131, doi:10.1172/JCI142242 (2021). - DOI - PMC - PubMed
    1. Michels AW, Redondo MJ & Atkinson MA The pathogenesis, natural history, and treatment of type 1 diabetes: time (thankfully) does not stand still. Lancet Diabetes Endocrinol, doi:10.1016/S2213-8587(21)00344-2 (2021). - DOI - PMC - PubMed
    1. Boldison J & Wong FS Immune and Pancreatic beta Cell Interactions in Type 1 Diabetes. Trends Endocrinol Metab 27, 856–867, doi:10.1016/j.tem.2016.08.007 (2016). - DOI - PubMed
    1. Unanue ER & Wan X The Immunoreactive Platform of the Pancreatic Islets Influences the Development of Autoreactivity. Diabetes 68, 1544–1551, doi:10.2337/dbi18-0048 (2019). - DOI - PMC - PubMed
    1. Barrett JC et al. Genome-wide association study and meta-analysis find that over 40 loci affect risk of type 1 diabetes. Nat Genet 41, 703–707, doi:10.1038/ng.381 (2009). - DOI - PMC - PubMed

Publication types

MeSH terms

Substances