. 2022 Feb;3(2):156-172.
doi: 10.1038/s43018-022-00331-y. Epub 2022 Feb 28.

Pharmacological targeting of MTHFD2 suppresses acute myeloid leukemia by inducing thymidine depletion and replication stress

Nadilly Bonagas #  1 Nina M S Gustafsson #  1 Martin Henriksson #  1 Petra Marttila #  1 Robert Gustafsson  2 Elisée Wiita  1 Sanjay Borhade  1 Alanna C Green  3 Karl S A Vallin  1 Antonio Sarno  4 Richard Svensson  5 Camilla Göktürk  1 Therese Pham  1 Ann-Sofie Jemth  1 Olga Loseva  1 Victoria Cookson  3 Nicole Kiweler  6 Lars Sandberg  7 Azita Rasti  1 Judith E Unterlass  1 Martin Haraldsson  8 Yasmin Andersson  9 Emma R Scaletti  2   10 Christoffer Bengtsson  7 Cynthia B J Paulin  1 Kumar Sanjiv  1 Eldar Abdurakhmanov  11 Linda Pudelko  1 Ben Kunz  1 Matthieu Desroses  1 Petar Iliev  1 Katarina Färnegårdh  7 Andreas Krämer  12 Neeraj Garg  13 Maurice Michel  1 Sara Häggblad  14 Malin Jarvius  15 Christina Kalderén  1 Amanda Bögedahl Jensen  1 Ingrid Almlöf  1 Stella Karsten  1 Si Min Zhang  1 Maria Häggblad  14 Anders Eriksson  16 Jianping Liu  16 Björn Glinghammar  8 Natalia Nekhotiaeva  16 Fredrik Klingegård  7 Tobias Koolmeister  1 Ulf Martens  14 Sabin Llona-Minguez  1 Ruth Moulson  1 Helena Nordström  11 Vendela Parrow  15 Leif Dahllund  9 Birger Sjöberg  8 Irene L Vargas  1 Duy Duc Vo  13 Johan Wannberg  13 Stefan Knapp  12 Hans E Krokan  4 Per I Arvidsson  8 Martin Scobie  1 Johannes Meiser  6 Pål Stenmark  2   10 Ulrika Warpman Berglund  1 Evert J Homan  1 Thomas Helleday  17   18
Affiliations

Pharmacological targeting of MTHFD2 suppresses acute myeloid leukemia by inducing thymidine depletion and replication stress

Nadilly Bonagas et al. Nat Cancer. 2022 Feb.

Abstract

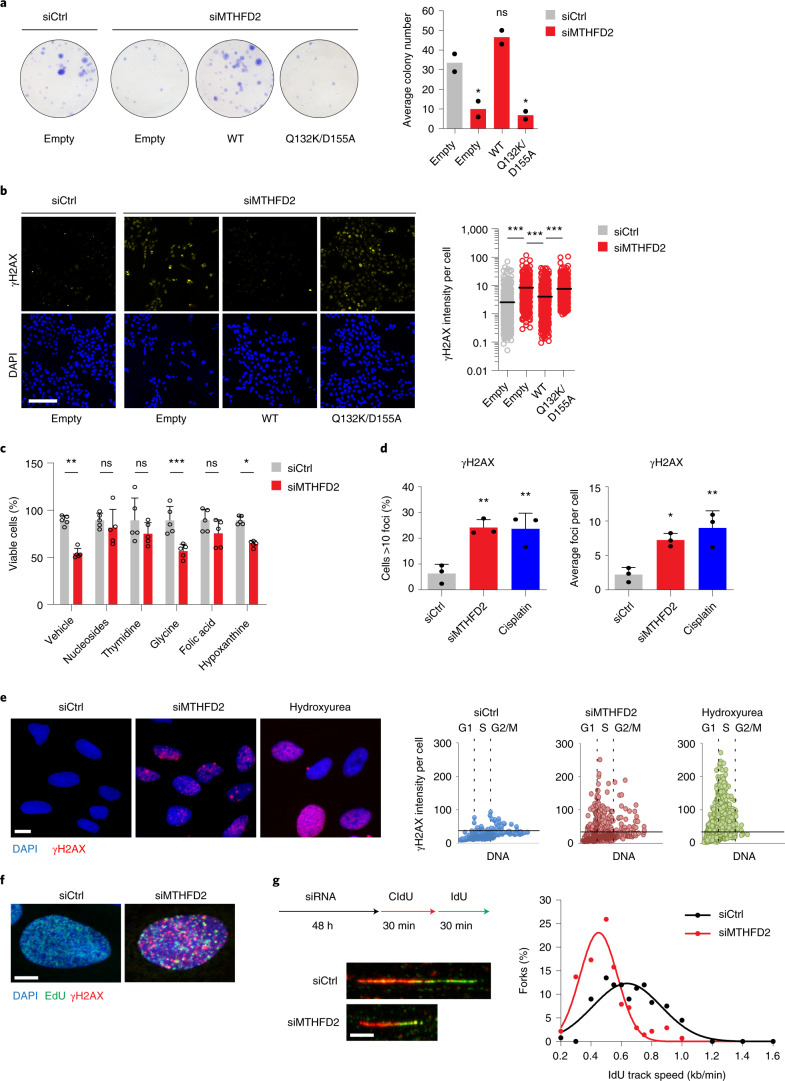
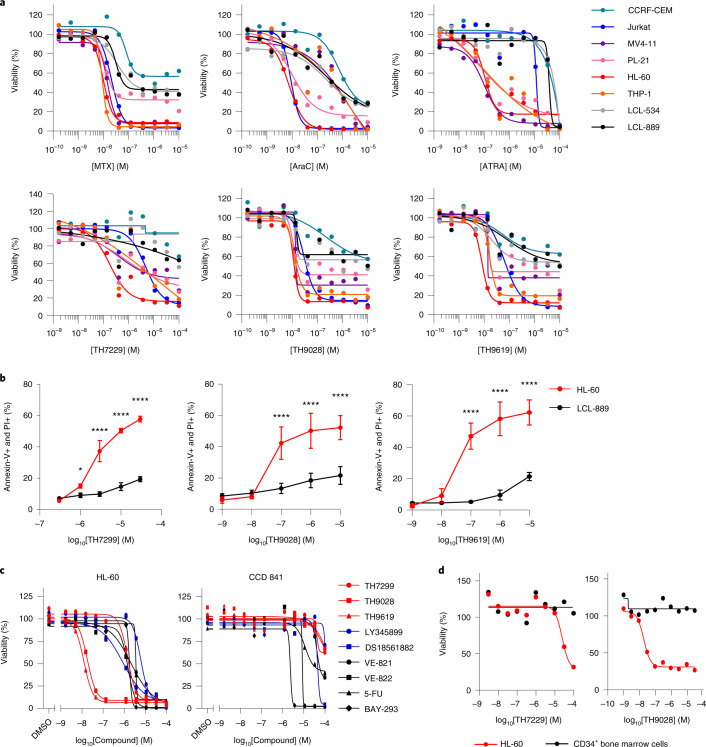
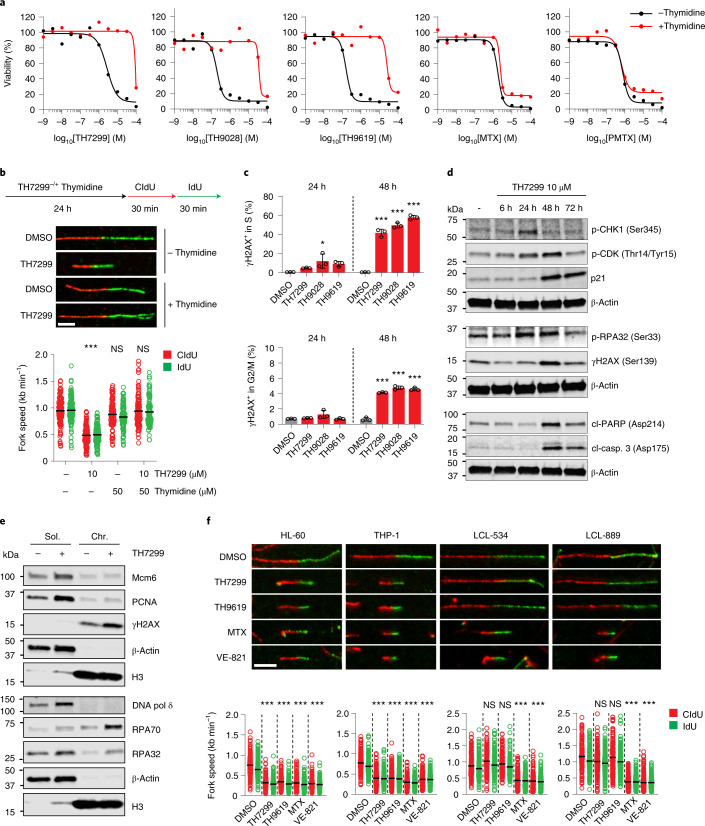
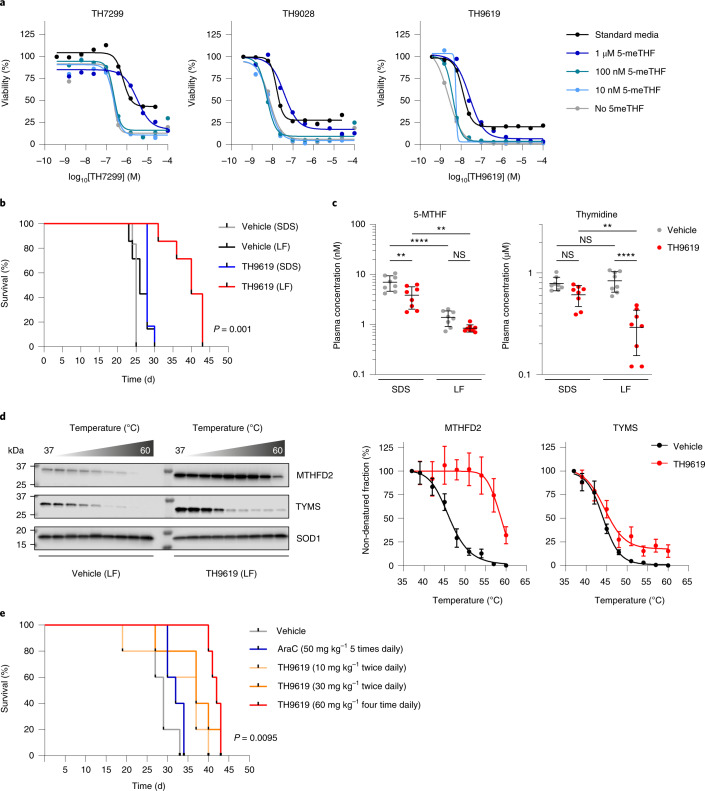
The folate metabolism enzyme MTHFD2 (methylenetetrahydrofolate dehydrogenase/cyclohydrolase) is consistently overexpressed in cancer but its roles are not fully characterized, and current candidate inhibitors have limited potency for clinical development. In the present study, we demonstrate a role for MTHFD2 in DNA replication and genomic stability in cancer cells, and perform a drug screen to identify potent and selective nanomolar MTHFD2 inhibitors; protein cocrystal structures demonstrated binding to the active site of MTHFD2 and target engagement. MTHFD2 inhibitors reduced replication fork speed and induced replication stress followed by S-phase arrest and apoptosis of acute myeloid leukemia cells in vitro and in vivo, with a therapeutic window spanning four orders of magnitude compared with nontumorigenic cells. Mechanistically, MTHFD2 inhibitors prevented thymidine production leading to misincorporation of uracil into DNA and replication stress. Overall, these results demonstrate a functional link between MTHFD2-dependent cancer metabolism and replication stress that can be exploited therapeutically with this new class of inhibitors.


Conflict of interest statement

C.B., S.B., M. Häggblad, T.H., M. Henriksson, E.H., C.P., L.S., M.S., P.S. and K.V. are named inventors on patent application PCT/EP2019/059919. MTHFD2 inhibitors are developed toward the clinic by the company One-Carbon Therapeutics AB, currently owned by The Helleday Foundation (THF), a not-for-profit charitable foundation. T.H. and U.W.B. are members of the board of THF. The remaining authors declare no competing interests.

Figures

Fig. 1
Fig. 1. MTHFD2 supports cancer cell survival through DNA replication.
a, Colony formation of U2OS cells on siMTHFD2 and coexpression of WT MTHFD2, catalytically dead mutant (Gln132Lys/Asp155Ala) or empty vector. Bars represent means (n = 2 independent experiments). b, Confocal analysis of DNA damage, γH2AX, on 24-h siMTHFD2 and coexpression of WT MTHFD2 or the Gln132Lys/Asp155Ala mutant in U2OS cells. Scale bar, 100 μm. Dot plots show γH2AX intensity per cell; bars represent means (n (cells) = 1,020 (siCtrl), 612 (siMTHFD2), 791 (WT) and 1,269 (Gln132Lys/Asp155Ala)). ***P < 0.001; one-way ANOVA (F = 141.9, degrees of freedom (d.f.) = 3). c, Metabolic rescue of siMTHFD2 U2OS cell viability with nucleosides (adenosine 30 μM, cytidine 30 μM, uridine 30 μM, guanosine 30 μM), thymidine 250 μM, glycine 250 μM, folic acid 250 μM or hypoxanthine 250 μM (72 h). Bars represent means + s.d. (n = 5 independent cell cultures). *P = 0.0161, **P = 0.0026, ***P < 0.001; two-way ANOVA (FsiRNA = 45.42, Ftreatment = 7.466, d.f.siRNA = 1, d.f.treatment = 5); NS, not significant. One of two independent experiments is shown. d, Confocal analysis of γH2AX in U2OS cells after siMTHFD2 (24 h) or cisplatin treatment (10 μM, 16 h) (n = 3 independent experiments (>500 cells per treatment)); the bars represent means + s.d. Cells >10 foci: **PsiMTHFD2 = 0.0048, **PCisplatin = 0.0055; one-way ANOVA (F = 15.69, d.f. = 2). Average foci per cell: *P = 0.0172, **P = 0.0043; one-way ANOVA (F = 13.64, d.f. = 2). e, Image-based cytometry analysis of γH2AX in U2OS cells on siMTHFD2 (24 h) or hydroxyurea (HU; 2 mM, 2 h). Scale bar, 50 μm. Single-cell analysis shows γH2AX intensity plotted against DNA content (DAPI) (n (cells) = 1,670 (siCtrl), 3,432 (siMTHFD2), 2,731 (HU)). f, Confocal analysis of DNA damage at replication sites, γH2AX and EdU, on 48 h siMTHFD2 in U2OS cells. Scale bar, 50 μm. g, DNA fiber assay on siMTHFD2 (48 h) in U2OS cells. Scale bar, 5 μm. Graphs show the distribution of RF speed per treatment (n (fibers/condition) = 133 (siCtrl) and 137 (siMTHFD2)). One of three independent experiments is shown. Source data
Fig. 2
Fig. 2. Development of first-in-class MTHFD2 inhibitors.
a, Schematic description of the drug discovery process toward the identification of MTHFD2 inhibitors. Intensive SAR-guided lead optimization efforts resulted in a series of low-nanomolar, cell-active MTHFD2 inhibitors, exemplified in the present study by TH9028 and TH9619. AA, amino acid. b, Relationship between enzymatic IC50 and HL-60 EC50 of MTHFD2 inhibitors. In total, >300 compounds were synthesized, biochemically characterized and evaluated for inhibition of viability in cells. c, Cocrystal structures of TH7299 and TH9619 bound to human MTHFD2. To the left, the overall structure of MTHFD2 shown as a blue cartoon representation. The bound TH7299 inhibitor and NAD+ cofactor are shown as sticks, colored yellow and gray, respectively. To the right are structural details of TH9619 (yellow) binding to MTHFD2. Important residues in the binding site are marked. Water molecules are displayed as red spheres, and hydrogen bond interactions are shown as dashed lines. The 2FoFc electron density map around TH9619 is contoured at 1.3 σ in blue and the FoFc maps are contoured at −3.0 σ in red and +3.0 σ in green (Supplementary Table 3). Figures were produced using PyMOL. d, Isothermal dose–response fingerprint CETSAITDRF showing target engagement and thermal stabilization of MTHFD2 by TH7299, TH9028 and TH9619 in intact HL-60 and LCL-889 cells. [MTHFD2i], concentration of MTHFD2 inhibitor. The graph shows the nondenatured MTHFD2 fraction at 57 °C, displayed as means (n = 2). Representative images are shown for one of two independent experiments. e, Viability dose–response curves of WT and CRISPR–Cas9 MTHFD2−/− knockout SW620 colorectal cancer cells on treatment with MTHFD2 inhibitor TH9619, MTX or 5-FU, evaluated after 96 h. Data are pooled from three independent experiments, represented as means ± s.d. One-way, extra sum-of-squares F test: TH9619 (***P < 0.001, F = 40.65, d.f. = 1), MTX (P = 0.0448, F = 2.607, d.f. = 1) and 5-FU (P = 0.1499, F = 1.757, d.f. = 1). Source data
Fig. 3
Fig. 3. MTHFD2 inhibitors display high potency and cancer selectivity in AML models.
a, Evaluation of the MTHFD2 inhibitors TH7299, TH9028 and TH9619 compared with MTX, AraC and ATRA on cell viability at 96 h of treatment across a panel of leukemia cell lines. LCLs LCL-534 and LCL-889 established from healthy primary B cells are shown as nontumorigenic controls (Extended Data Fig. 4). Data are shown as means (n = 2 independent cell cultures). A representative of two independent experiments is shown. b, Annexin-V/PI flow cytometry analysis of apoptosis in HL-60 and LCL-889 cells on TH7299, TH9028 or TH9619 for 96 h (Extended Data Fig. 4). Approximately 20,000 events were analyzed per condition. The quantification of double-positive (annexin-V positive and PI positive) late apoptotic populations is shown as pooled means ± s.d. from two independent experiments performed in duplicate. *P = 0.0168, ****P < 0.0001; two-way ANOVA (FTH7299 = 650.9, FTH9028 = 80.27, FTH9619 = 246, d.f. = 1). c, Viability dose–response curves of CCD 841 normal colon epithelial cells compared with HL-60 cells on treatment with MTHFD2 inhibitors (TH7299, TH9028, TH9619, LY345899 and DS18561882), ATR inhibitors (VE-821, VE-822), 5-FU or KRASi (BAY-293) evaluated after 96 h (Extended Data Fig. 4). Data are shown as means (n = 2). A representative of two independent experiments is shown. d, Cell viability dose–response curves of primary CD34+ bone marrow cells from healthy donors compared with HL-60 cells on treatment with TH7299, TH9028 or DMSO, evaluated after 72 h. Data from one representative experiment are displayed as means (n = 2 independent cell cultures). Source data
Fig. 4
Fig. 4. MTHFD2 inhibitors induce DNA damage and apoptosis via thymine-less death.
a, HL-60 cell viability on MTHFD2 inhibitors, MTX or PMTX ± thymidine 50 μM at 96 h. Data from one representative experiment of two performed in duplicate are displayed as means. b, Thymidine rescue of DNA replication on TH7299 in THP-1 cells. Scale bar, 5 μm. Scatter dot plots show the mean and distribution of RF speeds per treatment (n (fibers per condition) = 105 (except TH7299 + thymidine, n = 100)). ***P < 0.001; one-way ANOVA (F = 99.79, d.f. = 3). NS, not significant. c, Cell-cycle analysis of DNA damage (γH2AX) on MTHFD2 inhibitors (TH7299 3 μM, TH9028/TH9619 50 nM) in HL-60 cells. Per sample, at least 15,000 events were gated (Extended Data Fig. 5). Graphs show the percentage of γH2AX-positive cells as means ± s.d. from one of two independent experiments performed in triplicate. *P = 0.0179, ***P < 0.001; one-way ANOVA (FS(24h) = 4.937, FS(48h) = 303.4, FG2/M(24h) = 2.968, FG2/M(48h) = 310, d.f. = 3). d, THP-1 cell protein levels of checkpoint and cell death markers on TH7299. β-Actin was used as a loading control. A representative experiment is shown (n = 2). e, Subcellular fractionation of THP-1 cells for replication markers on TH7299 (24 h, 10 μM). Chr., chromatin-bound fraction; Sol., soluble fraction (cytoplasmic and nuclear). Histone H3 and β-actin were used as loading controls for the chromatin-bound and soluble fractions, respectively. A representative experiment is shown (n = 2). f, DNA fiber assay on TH7299 (3 μM), TH9619/MTX (50 nM) and VE-821 (1 μM) in HL-60 and THP-1 cells compared with nontumorigenic LCL-534 and LCL-889 cells. Scale bar, 5 μm. Scatter dot plots show the mean and distribution of RF speeds for each treatment. From left to right: n (fibers per condition) = 198, 227, 244, 182, 255, 201, 278, 461, 240, 219, 229, 223, 152, 250, 165, 176, 344, 183, 447 and 326. A representative of two independent experiments is shown. ***P < 0.001; one-way ANOVA with Holm–Šídák correction for multiple comparisons (FHL-60 = 233.9, FTHP-1 = 187, FLCL-534 = 165.3, FLCL-889 = 435.1, d.f. = 4). Source data
Fig. 5
Fig. 5. MTHFD2 inhibitors exacerbate uracil misincorporation into DNA.
a, Proposed mechanism for the antitumor effect of MTHFD2 inhibitors via thymine-less-induced RS. MTHFD2 supports de novo thymidylate synthesis by providing CH2-THF. On MTHFD2 inhibition, accumulation of dUMP promotes uracil misincorporation, causing DNA damage. Failing to repair these lesions, cells undergo RF collapse and cell death. A combination of MTHFD2 and dUTPase inhibitors further increases uracil misincorporation and apoptosis. Thymidine supplementation bypasses this, rescuing DNA replication and cell viability. CDA, cytidine deaminase; DSBs, double-strand breaks; dUTPasei, dUTPase inhibitor; TK, thymidine kinase. b, Comet assay in THP-1 cells. Scale bar, 2 μm. Dot plots represent comet tail moment per cell and bars display the mean (n = 200 cells per condition). ****P < 0.0001; one-way Kruskal–Wallis test with Dunn’s multiple comparison correction (F = 904.2, d.f. = 9). c, Genomic uracil incorporation on TH7299 in THP-1 cells (10 μM, 48 h). Bars represent dU lesions as fold-change over DMSO displayed as means (n = 2). One of two independent experiments is shown. **P < 0.01, ***P < 0.001; one-way ANOVA (F = 156.4, d.f. = 2). d, Genomic uracil incorporation in HL-60 cells (TH9619 100 nM ± dUTPase inhibitor 10 µM, MTX 100 nM, 5-FU 10 μM ± thymidine 10 μM, 48 h). Bars represent dU lesions per million deoxynucleotides (MdN). Data are displayed as pooled means ± s.d. from two independent experiments performed in triplicate. **P = 0.0063, ****P < 0.0001; two-way ANOVA with Holm–Šídák correction for multiple comparisons (Ftreatment = 48.64, Fthymidine = 87.47, d.f.treatment = 5, d.f.thymidine = 1). e, Comet assay in THP-1 cells on TH7299 ± dUTPase inhibitor (10 μM, 24 h). Dot plots represent tail moment per cell and bars display the mean (n = 200 cells per condition). ***P < 0.001, ****P < 0.0001; one-way Kruskal–Wallis test with Dunn’s multiple comparison correction (F = 361.4, d.f. = 9). f, THP-1 cell viability on TH9028–dUTPase inhibitor combination ± thymidine 10 μM at 72 h. One of three independent experiments is shown. Data are displayed as means (n = 2). g, Apoptosis analysis in THP-1 cells. Approximately 15,000 events per condition were analyzed. Bars represent annexin-V-positive populations as means (n = 2). *P24h = 0.0151, *P72h = 0.0213, **P = 0.0029, ***P = 0.0002; one-way ANOVA (F = 43.89, d.f. = 5). One of two independent experiments is shown. Source data
Fig. 6
Fig. 6. MTHFD2 inhibitor TH9619 impairs cancer progression in vivo.
a, Cell viability of HL-60 cells on TH7299, TH9028 and TH9619 treatment for 96 h under increasing concentrations of medium folate supplementation. Representatives of three independent experiments are shown. Data are displayed as means (n = 2 independent cell cultures). b, Kaplan–Meier curve showing overall survival of NOG mice with HL-60 IV xenograft tumors after treatment with TH9619 versus vehicle control, on standard chow (SDS) or LF (n (SDS groups) = 6 mice, n (LF groups) = 7 mice). P = 0.001 calculated using a one-way Mantel–Cox log-rank test. c, Plasma concentration of 5-MTHF and thymidine at the time of sacrifice. Data are displayed as median ± s.d. (n = 8 mice per group). **P5-MTHF(SDS) = 0.0015, **P5-MTHF(TH9619 SDS-LF) = 0.0026, **Pthymidine = 0.0013, ****P < 0.0001; two-way ANOVA with Tukey’s correction for multiple comparisons (F5-MTHF(diet) = 63.93, F5-MTHF(treatment) = 11.82, Fthymidine(diet) = 6.307, Fthymidine(treatment) = 46.01, d.f.diet = 1, d.f.treatment = 1); NS, not significant. d, Target engagement of MTHFD2 and TYMS in tumor samples analyzed using CETSA. Representative images are shown for one of two independent experiments. Graphs show the nondenatured target fraction from TH9619-treated animals and vehicle controls from the LF group, displayed as means ± s.d. (n = 4). MTHFD2 melting temperature (ΔTm) = 17 °C, TYMS ΔTm = 1 °C. e, Kaplan–Meier curve showing overall survival of NSG mice on LF with HL-60 IV xenograft tumors after treatment with TH9619 10 mg kg−1 twice daily, TH9619 30 mg kg−1 twice daily, TH9619 60 mg kg−1 four times daily, AraC 50 mg kg−1 five times daily or vehicle control (n = 5 mice per group). There was significantly improved survival in the TH9619 group receiving 60 mg kg−1 four times daily compared with the AraC and vehicle groups. P = 0.0095 calculated using a one-way Mantel–Cox log-rank test. Source data
Extended Data Fig. 1
Extended Data Fig. 1. MTHFD2 inhibitor DS18561882 is a weak and unselective inhibitor of MTHFD2.
(a) Depletion of MTHFD2 induces accumulation of DNA damage in early S phase. Confocal analysis of DNA damage (γH2AX) in U2OS cells expressing the FUCCI sensor system following siRNA knock-down of MTHFD2 (24 h) or hydroxyurea (HU) treatment (2 mM, 24 h). Scale bar, 50 μm. Shown is a representative out of three independent experiments; n (cells/treatment) = 335 (siCtrl), 229 (siMTHFD2), 186 (HU). (b) Structure of the small molecule DS18561882. (c) Dose-response curve (DRC) for the biochemical inhibition of hMTHFD2 by DS18561882 assessed using the NAD(P)H-Glo assay. Graph represents pooled results from four independent experiments carried out in duplicate, with average IC50 value reported (n = 4). Data are displayed as means ± SD. (d) DRC for the biochemical inhibition of hMTHFD1 (DC domain) by DS18561882 assessed using the NAD(P)H-Glo assay. Graph represents pooled results from four independent experiments carried out in duplicate, with average IC50 value reported (n = 4). Data are displayed as means ± SD. (e) Cell viability DRC for DS18561882 in HL-60 cells, evaluated after 96 h. Graph represents pooled results from four independent experiments carried out in duplicate, with average EC50 value reported (n = 4). Data are displayed as means ± SD. Source data
Extended Data Fig. 2
Extended Data Fig. 2. Biochemical characterization of MTHFD2i target selectivity.
(a) HTS of ~11,000 compounds (10 µM). LY345899 served as positive control (red) and assay buffer as negative control (blue). (b) Representative inhibition DRCs for human recombinant MTHFD2 (hMTHFD2) and HL-60 cell viability upon TH9619 and TH11737, (S)- and (R)- enantiomers respectively. Data is displayed as means ± SD, n = 6 (TH11737) and n = 2 (TH9619). (c) Representative inhibition DRCs for hMTHFD2 by TH7299, TH9028 and TH9619. IC50 values correspond to the representative run (n = 2). Data are displayed as means ± SD. (d) SPR analysis of MTHFD2i and hMTHFD2. Black lines correspond to a fitted 1:1 Langmuir interaction model. RU: response units, s: seconds. Shown is a representative out of two independent experiments. (e) DHFR activity upon MTHFD2i (100 µM) compared to DHFR inhibitors methotrexate (MTX) and pemetrexed (PMTX). Data is displayed as means, n = 2. (f) SHMT1, SHMT2 and TYMS activity upon MTHFD2i (100 μM) compared to lometrexol (LMTX) and raltitrexed (RLTX). Bars represent means ± SD. From left to right, n (replicates/condition) = 3; 3; 3; 3; 3; 2; 3; 3; 4; 4; 4; 1. (g) DARTS analysis upon TH9619 treatment of HL-60 cells. Protein levels were normalized to non-digested (ND) controls. Representative graphs are shown for one out of two independent experiments. (h) Representative immunoblot images corresponding to DARTS experiment in (g) are shown for one out of two independent experiments. (i) CETSA of MTHFD2, TYMS and DHFR upon TH9619 treatment (1 µM). Protein levels were normalized against SOD1. Shown is a representative image out of two independent experiments. (j) Viability of MTHFD1-/- and MTHFD2-/- knockout SW620 cell clones or wildtype cells treated with TH9619 for 96 h. Data from three independent experiments are displayed as means ± SD, n = 3. (k) Viability of MTHFD1-/- clones at 96 h relative to wildtype SW620 cells. Data from three independent experiments are displayed as means ± SD, n = 3. (l) Representative images of MTHFD1 and MTHFD2 expression in wildtype SW620 cells compared to MTHFD1-/- and MTHFD2-/- knockout clones, respectively. Representative graphs are shown for one out of three independent experiments. Source data
Extended Data Fig. 3
Extended Data Fig. 3. Co-crystal structures of TH7299 and TH9028 bound to human MTHFD2.
(a, b) Structural details of (a) TH7299 (yellow) and (b) TH9028 (magenta) binding to MTHFD2. Important residues in the binding site are marked. Water molecules are displayed as red spheres. Hydrogen bond interactions are shown as dashed lines. The 2Fo-Fc electron density maps around TH7299 and TH9028 are contoured at 1.3σ (blue) and the Fo-Fc maps are contoured at −3.0σ (red) and +3.0σ (green). (c) Comparison of the binding sites of MTHFD2 bound with TH7299 (blue) and TH9028 (white). TH7299 and TH9028 are shown as sticks colored yellow and magenta, respectively. (d) Comparison of the binding sites of MTHFD2 bound with TH7299 (blue) and LY345899 (white). TH7299 and LY345899 are shown as sticks colored yellow and magenta, respectively. Figures were produced with PyMOL. (e) Fo-Fc electron density maps prior to ligand refinement for TH9028, TH7299 and TH9619. Important residues in the binding site pocket are marked. The Fo-Fc maps are contoured at −3.0σ (red) and +3.0σ (green). Figures were produced with PyMOL.
Extended Data Fig. 4
Extended Data Fig. 4. MTHFD2i display high cancer selectivity in AML models.
(a) Table summarizing average pEC50 values from cell viability experiments upon treatment with MTHFD2 inhibitors TH7299, TH9028 and TH9619 compared to methotrexate (MTX), cytarabine (AraC) and all-trans retinoic acid (ATRA) across a panel of leukemia cell lines (n = 2). Lymphoblastic cell lines LCL-534 and LCL-889 established from healthy primary B cells are shown as non-malignant controls. (b) Basal protein levels of folate enzymes in AML cells compared to non-malignant LCL cells. β-actin was used as loading control. Shown is a representative out of two independent experiments. (c) Apoptosis as assessed by Annexin-V/PI staining of HL-60 and LCL-889 cells upon increasing doses of TH7299, TH9028 and TH9619 for 96 h. Approximately 20,000 events were gated per condition. Shown is a representative from two independent experiments performed in duplicate. (d) Cell viability dose-response curves of MCF10A non-transformed breast epithelial cells compared to SW620 colorectal cancer cells upon treatment with MTHFD2i (TH7299, TH9028, TH9619, LY345899, DS18561882), ATRi (VE-821, VE-822), 5-fluorouracil (5-FU), KRASi (BAY-293) or cytarabine (AraC), evaluated after 96 h. Data are shown as means, n = 2. Shown is a representative out of two independent experiments. Source data
Extended Data Fig. 5
Extended Data Fig. 5. MTHFD2i induce replication stress selectively in cancer cells, rescuable by thymidine.
(a) THP-1 cell viability upon MTHFD2i or methotrexate (MTX) ± thymidine 50 μM (96 h). Data from one representative experiment are displayed as means, n = 2. (b) SW620 cell viability upon TH7299, TH9619, MTX or 5-fluorouracil (5-FU) ± thymidine 50 μM (96 h). Data from one representative experiment are displayed as means, n = 2. (c) TH9619 reduces serine-derived carbon-flux into purine synthesis. Graphs show mass isotopologue distribution (MID) of intracellular ATP, ADP, and AMP upon [U-13C]-serine tracer in response to 24 h treatment with 0.3, 1, or 20 μM TH9619 or 50 nM MTX in HL-60 cells; mean ± SEM of three independent experiments each measured in triplicate. wells. Reduced labelling from [U-13C]-serine of ATP, ADP, and AMP as well as increased relative percentage of unlabeled M + 0 isotopologues of ATP, ADP, and AMP is indicative of a reduced flux of 13C-carbon units from serine to purine synthesis upon TH9619 treatment. MTX serves as a positive control for purine synthesis inhibition. (d) DNA fiber assay upon TH9028 50 nM, MTX 50 nM and VE-821 1 μM in AML and non-malignant cells. Scale bar, 5 μm. Dotplots show the distribution and calculated mean of replication fork speed per treatment. From left to right, n (fibers/condition) = 165; 345; 192; 227; 220; 284; 237; 279; 142; 192; 218; 171; 192; 170; 114; 248. Shown is a representative out of two independent experiments. * P < 0.05, *** P < 0.001; one-way ANOVA with Dunnett’s multiple comparison test (FHL-60 = 492.6, FTHP-1 = 771.6, FLCL-534 = 624, FLCL-889 = 770.6, DF = 3). (e) Replication origin firings upon TH7299 (10 μM, 24 h) in THP-1 cells. Data are displayed as means ± SD, n = 20. *** P < 0.001; one-way Mann-Whitney rank test (F = 39, DF = 1). (f) Cell cycle analysis of DNA damage (γH2AX) induction upon MTHFD2i treatment in HL-60 cells. Per sample, at least 15,000 events were gated. (g) Thymidine rescue of cell cycle progression upon TH7299 treatment in THP-1 cells. At least 10,000 events were analyzed/condition. Bar graphs represent the percentage of cells in each phase, displayed as means, n = 2. Source data
Extended Data Fig. 6
Extended Data Fig. 6. MTHFD2i induce differentiation of AML blasts.
(a) Flow cytometry analysis of CD11b expression in HL-60 cells after 96 h incubation with TH7299 3 μM, TH9028 50 nM, ATRA 1 μM, or ATRi VE-821 1 μM, in presence or absence of thymidine 5 μM supplementation. To the left, representative histograms, and to the right, bar graphs showing the percentage of CD11b positive cells, displayed as means, n = 2. *** P < 0.001; one-way ANOVA (F = 1983, DF = 9). Shown is a representative out of two independent experiments. (b) CD11b/PI live staining of HL-60 cells upon incubation with ATRA 1 μM, TH7299 5 μM or TH9619 50 nM, assessed at each indicated time point. Approximately 20,000 events were gated per condition. Bar graphs represent the percentage of double-negative, single positive and double-positive populations as means ± SD. Shown is a representative experiment out of two independent experiments conducted in triplicate. Source data
Extended Data Fig. 7
Extended Data Fig. 7. MTHFD2i sensitize cancer cells to ATR signaling blockade.
(a, b) Synergy score matrices for HL-60 (a) and THP-1 (b) cells following 72 h of combined TH7299 and ATRi VE-821 treatment. Normalized cell viability results were used to calculate synergy matrix heat-maps to visualize the interaction landscape for each drug pair using the SynergyFinder zero-interaction potency (ZIP) score model with baseline correction. Synergy scores (δ-scores) between 0 and 10 suggest the interaction between the two drugs is likely additive, while synergy scores larger than 10 indicate the interaction between the two drugs is probably synergistic. Shown is a representative out of two independent experiments. (c) Synergy score matrix for THP-1 cells following 96 h of combined TH9619 and ATRi VE-822 treatment. Shown is a representative out of two independent experiments. (d) Annexin-V/PI flow cytometry analysis of apoptosis in THP-1 cells upon TH9619 50 nM treatment, alone or in combination with low (100 nM), medium (250 nM) or high (500 nM) doses of ATRi VE-822, for 72 h or 96 h. Approximately 20,000 events were analyzed per condition. Shown is the quantification of annexin-V and PI double-positive apoptotic populations as fold-change over DMSO control, bars represent means, n = 2. *** P < 0.001 (72 h low VE-822-TH9619 + VE-822 P = 0.0002; 96 h low VE-822-TH9619 + VE-822 P = 0.0007; 96 h high VE-822-TH9619 + VE-822 P = 0.0002); two-way ANOVA analysis (Ftime = 85.52, Ftreatment = 153.2, DFtime = 1, DFtreatment = 7). This is a representative out of four independent experiments. (e, f) Synergy score matrices for HL-60 cells following 96 h of combined TH9619 and CHK1i (CCT245737) (e), or combined TH9619 and WEE1i (MK-1775) (f) treatment. Shown is a representative out of two independent experiments. (g, h) Synergy score matrix for U2OS and TC71 cells following 96 h of combined TH9619 and ATRi VE-822 treatment. Shown is a representative out of two independent experiments. Source data
Extended Data Fig. 8
Extended Data Fig. 8. In vitro selectivity and safety evaluation of TH9619.
(a) DSF-based selectivity screen of TH9619 12 µM against a curated library of 44 kinases, using staurosporine as a positive control. Bars represent the mean change in protein melting temperature (ΔTm) of one experiment performed in triplicate. (b) Selectivity of TH9619 10 µM against the SafetyScreen44 panel from Eurofins. Bars represent mean inhibition in percentage of one experiment performed in duplicate. Source data
Extended Data Fig. 9
Extended Data Fig. 9. In vivo profiling of TH9619 in mouse models.
(a) Plasma concentration and pharmacokinetic (PK) evaluation of TH9619 following subcutaneous administration of 10 mg/kg in female NOG mice. Data are displayed as means ± SD, n = 3. (b) Dose tolerability study after repeated subcutaneous administrations of TH9619 in female NOD-SCID mice. TH9619 90 mg/kg was administered twice daily on four occasions (twice per week for two weeks). Body weight data are displayed as means ± SD, n = 4. (c) Body weight measurements for animals included in the HL-60 xenograft efficacy study. Data are displayed as means + SD, n (mice/group) = 7 (vehicle SDS), 8 (vehicle LF), 6 (TH9619 SDS), 7 (TH9619 LF). Dotted line indicates treatment initiation on day 11. (d) Summary of hematology parameters upon sacrifice of HL-60 xenograft efficacy study animals and satellite control mice. Total count of red blood cells (RBC), white blood cells (WBC) and platelets per liter are displayed as means + SD. From left to right, n (mice/group) = 7; 8; 6; 7; 3; 4; 3. (e) Spleen weight upon sacrifice of HL-60 xenograft efficacy study animals and satellite control mice. Data are displayed as means ± SD. From left to right, n (mice/group) = 7; 8; 6; 7; 3; 4; 3. (f) Plasma concentration of alanine transaminase (ALT) upon sacrifice of HL-60 xenograft efficacy study animals and satellite control mice. Data are displayed as means ± SD. From left to right, n (mice/group) = 7; 8; 6; 7; 3; 4; 3. (g) Body weight measurements for animals included in the HL-60 xenograft efficacy study comparing to standard of care cytarabine (AraC). Data are displayed as means + SD, n = 5 per group. Dotted line indicates treatment initiation on day 6. Source data
Extended Data Fig. 10
Extended Data Fig. 10. In vivo profiling of TH9028 and TH9619 in mouse models.
(a) Kaplan-Meier curve showing overall survival of NOG mice with HL-60 IV xenograft tumors after treatment with TH9028 (30 mg/kg bid) or TH9619 (30 mg/kg bid) versus vehicle control, on low folate diet, n = 6–7 per group. P = 0.001 calculated using a one-way Mantel-Cox log-rank test. (b) Body weight measurements. Mouse body weight was monitored for two weeks before treatment start and followed throughout the study. At day 37 of treatment the remaining animals regained weight after diet shift from low folate diet to standard chow diet. Data are displayed as means + SEM, n = 7 (TH9028) or 8 (vehicle/TH9619) per group. Dotted line indicates treatment initiation on day 1. (c) Plasma concentration levels at 15 min and 30 min after the last administration of TH9028 (30 mg/kg bid) or TH9619 (30 mg/kg bid) in xenograft mice, n = 3 per group. Data are displayed as means ± SD. (d) Intratumor levels of TH9619, monoglutaminated TH9619 (TH9619-1G), 5-meTHF and thymidine at the time of sacrifice, measured by LC-MS and displayed as means ± SD, n = 2 (vehicle) or 3 (treated). * P < 0.05 calculated by unpaired two-tailed t-test (PTH9619 = 0.0449, tTH9619 = 3.324, DFTH9619 = 1; PTH9619-1G = 0.0168, tTH9619-1G = 4.841, DFTH9619-1G = 1). (e) Target engagement of MTHFD2 in tumor samples analyzed using CETSA. Graphs show the non-denatured target fraction from TH9028- and TH9619-treated animals and vehicle controls, displayed as means ± SD, n = 2 (vehicle) or 3 (treated). MTHFD2 ΔTm (TH9028) = 6.4 °C, MTHFD2 ΔTm (TH9619) = 5.9 °C. Source data

Comment in

  • Beating cancer one carbon at a time.
    Dionellis VS, Halazonetis TD. Dionellis VS, et al. Nat Cancer. 2022 Feb;3(2):141-142. doi: 10.1038/s43018-022-00333-w. Nat Cancer. 2022. PMID: 35228750 No abstract available.

References

    1. Bartkova J, et al. DNA damage response as a candidate anti-cancer barrier in early human tumorigenesis. Nature. 2005;434:864–887. - PubMed
    1. Bartkova J, et al. Oncogene-induced senescence is part of the tumorigenesis barrier imposed by DNA damage checkpoints. Nature. 2006;444:633–637. - PubMed
    1. Halazonetis TD, Gorgoulis VG, Bartek J. An oncogene-induced DNA damage model for cancer development. Science. 2008;319:1352–1355. - PubMed
    1. Di Micco R, et al. Oncogene-induced senescence is a DNA damage response triggered by DNA hyper-replication. Nature. 2006;444:638–642. - PubMed
    1. Gorgoulis, V. G. et al. Activation of the DNA damage checkpoint and genomic instability in human precancerous lesions. Nature10.1038/nature03485 (2005). - PubMed

Publication types

MeSH terms