. 2022 Mar;28(3):535-544.
doi: 10.1038/s41591-022-01695-5. Epub 2022 Feb 28.

Cross-cohort gut microbiome associations with immune checkpoint inhibitor response in advanced melanoma

Affiliations

Cross-cohort gut microbiome associations with immune checkpoint inhibitor response in advanced melanoma

Karla A Lee et al. Nat Med. 2022 Mar.

Abstract

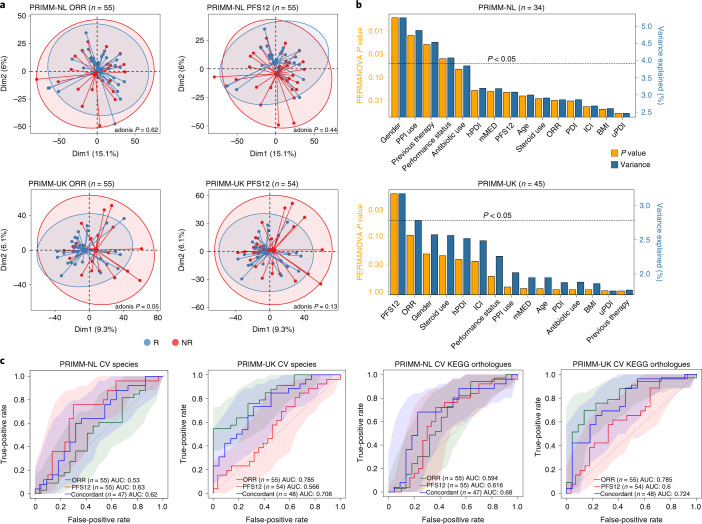
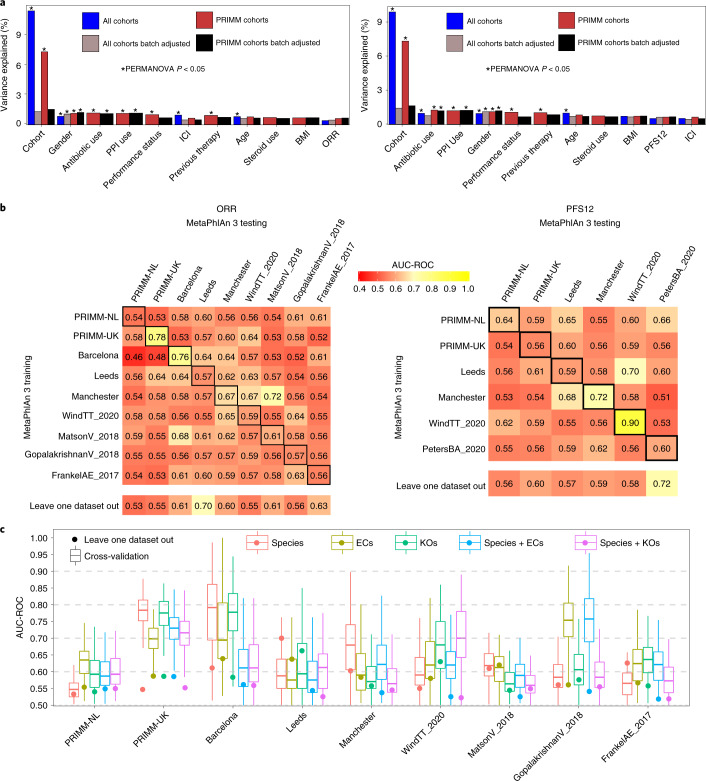
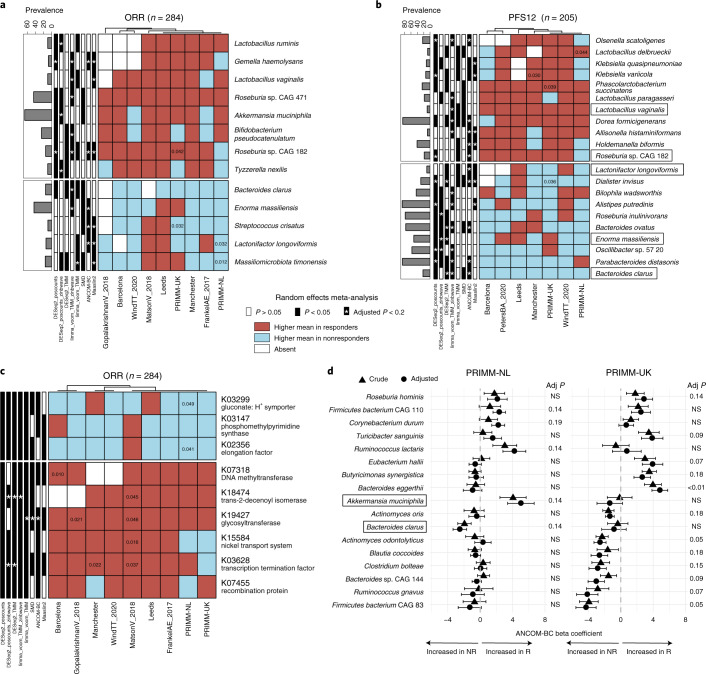
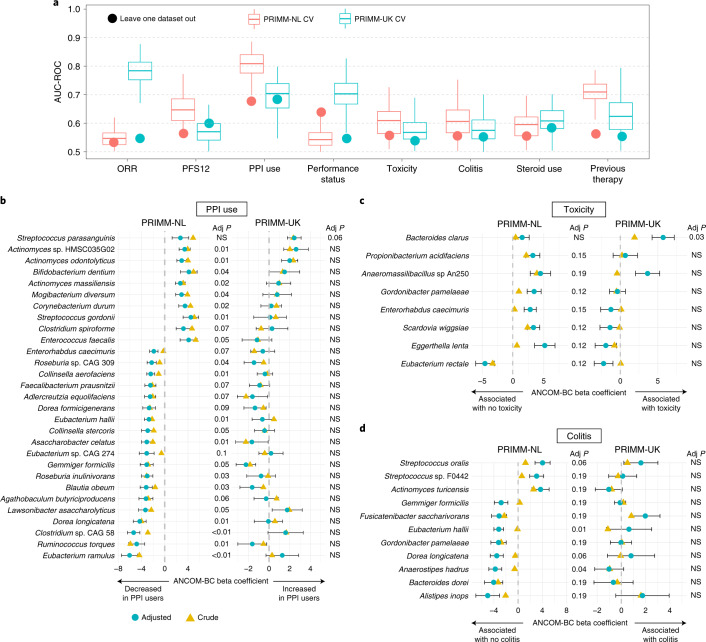
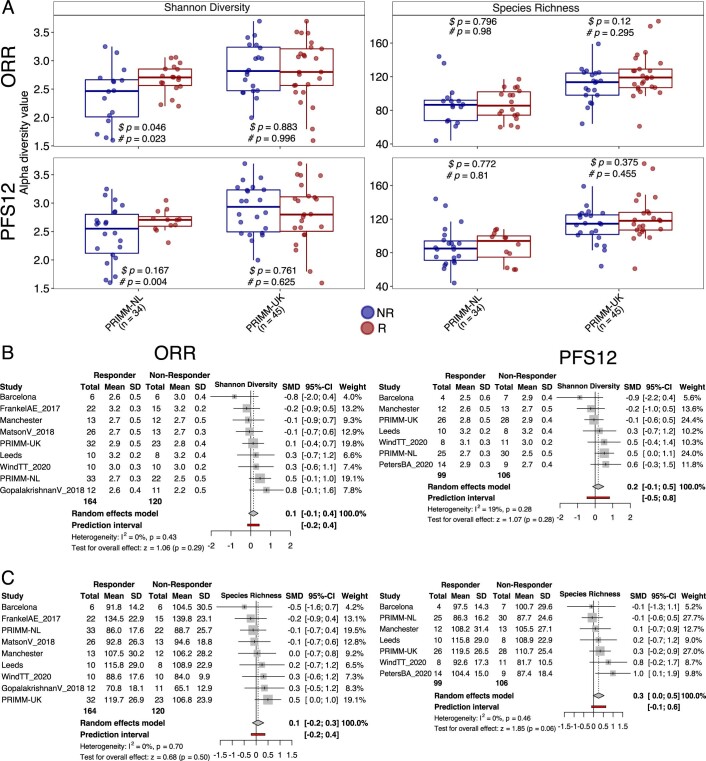
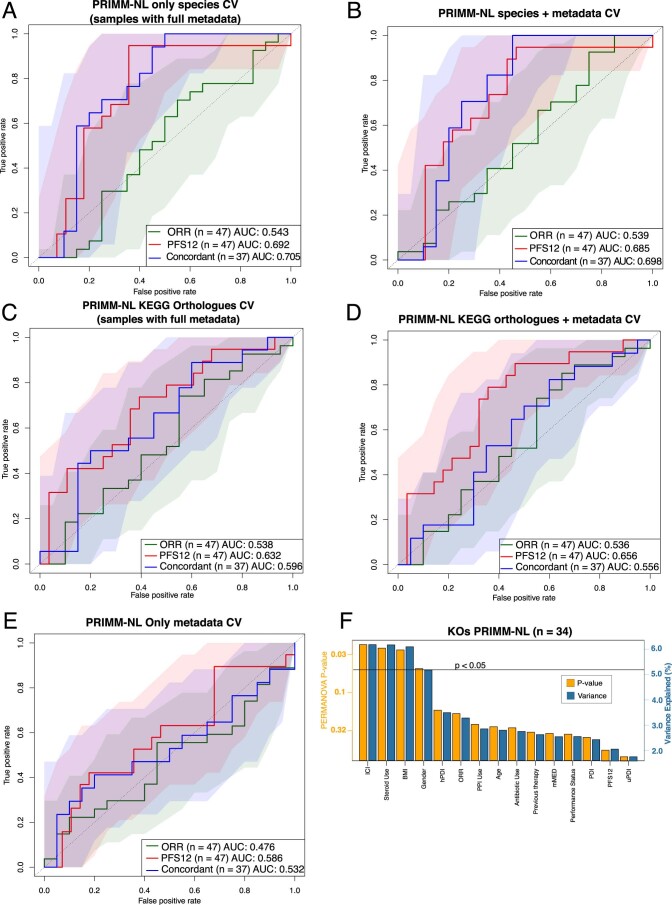
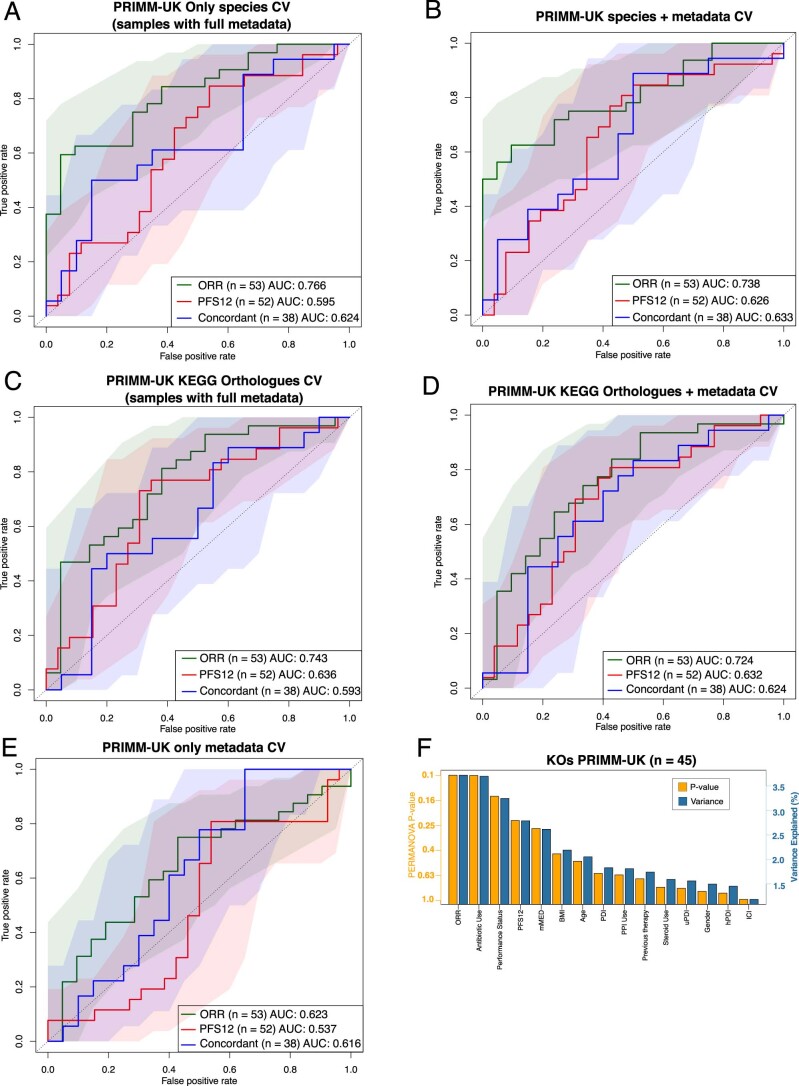
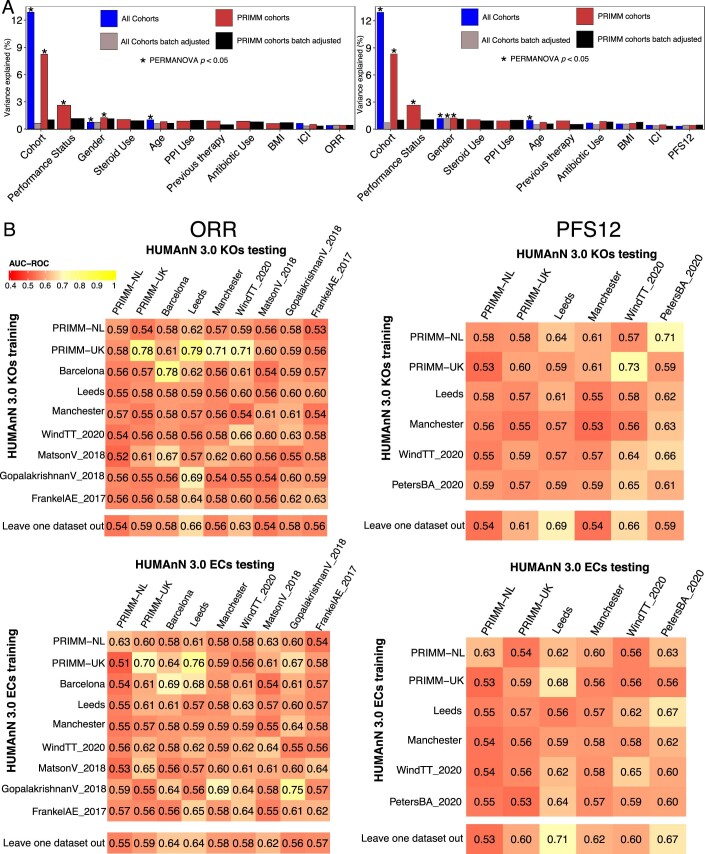
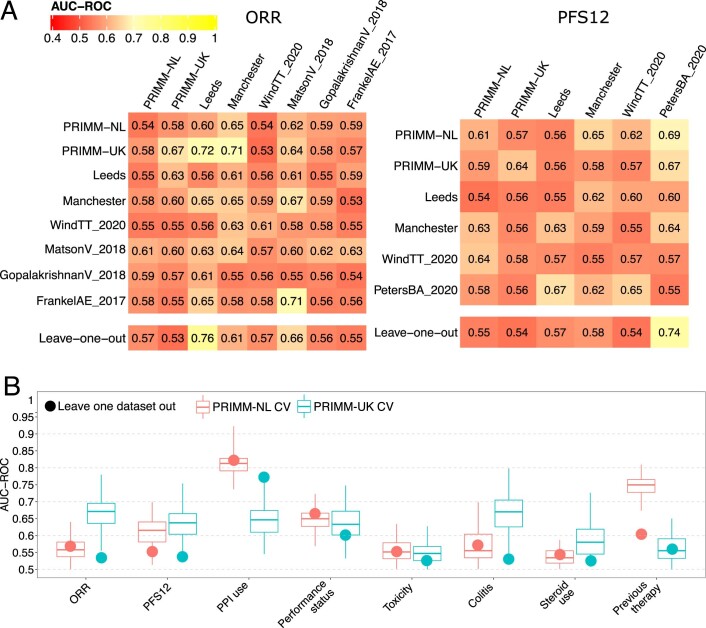
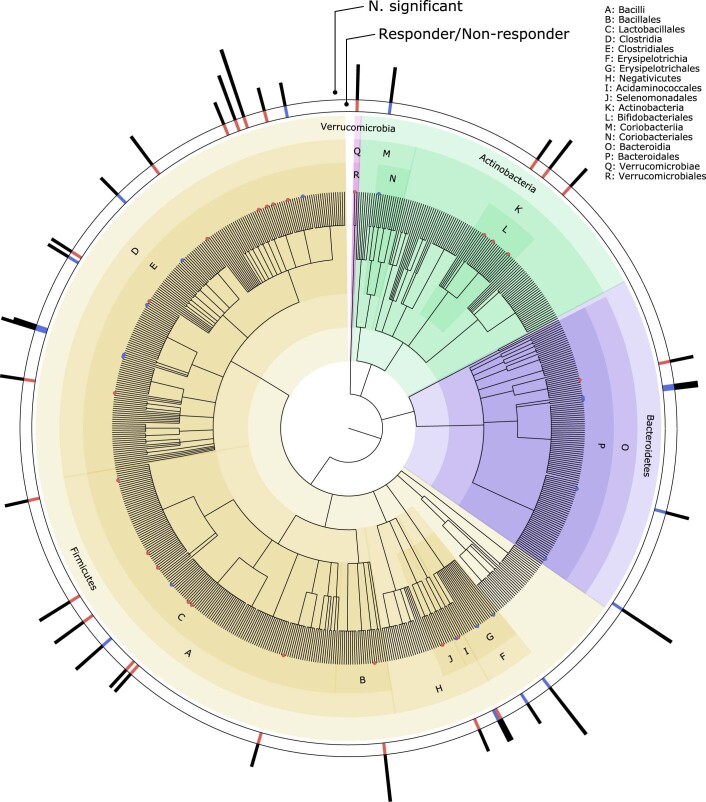
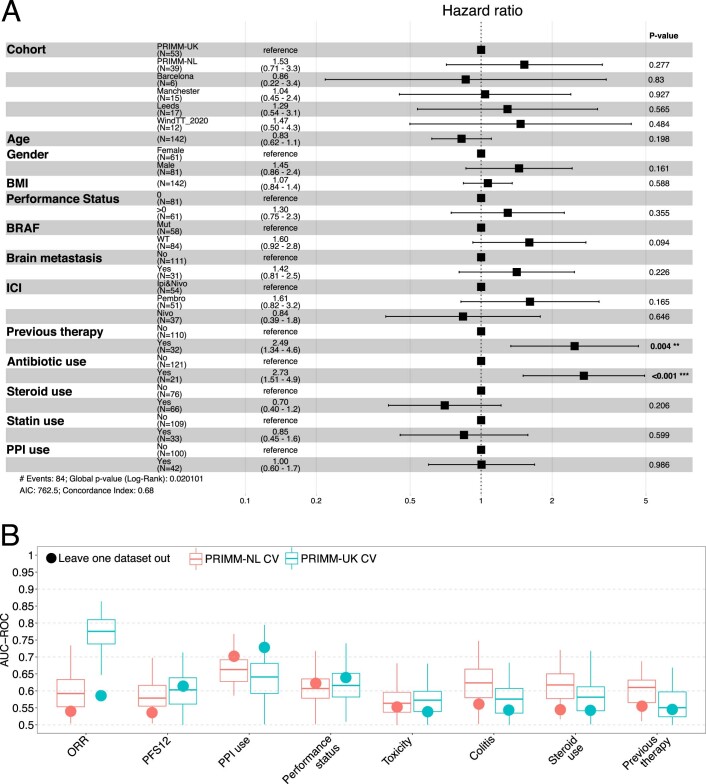
The composition of the gut microbiome has been associated with clinical responses to immune checkpoint inhibitor (ICI) treatment, but there is limited consensus on the specific microbiome characteristics linked to the clinical benefits of ICIs. We performed shotgun metagenomic sequencing of stool samples collected before ICI initiation from five observational cohorts recruiting ICI-naive patients with advanced cutaneous melanoma (n = 165). Integrating the dataset with 147 metagenomic samples from previously published studies, we found that the gut microbiome has a relevant, but cohort-dependent, association with the response to ICIs. A machine learning analysis confirmed the link between the microbiome and overall response rates (ORRs) and progression-free survival (PFS) with ICIs but also revealed limited reproducibility of microbiome-based signatures across cohorts. Accordingly, a panel of species, including Bifidobacterium pseudocatenulatum, Roseburia spp. and Akkermansia muciniphila, associated with responders was identified, but no single species could be regarded as a fully consistent biomarker across studies. Overall, the role of the human gut microbiome in ICI response appears more complex than previously thought, extending beyond differing microbial species simply present or absent in responders and nonresponders. Future studies should adopt larger sample sizes and take into account the complex interplay of clinical factors with the gut microbiome over the treatment course.


Conflict of interest statement

R.K.W. acted as a consultant for Takeda; received unrestricted research grants from Takeda, Johnson & Johnson, Tramedico and Ferring; and received speaker fees from MSD, AbbVie and Janssen Pharmaceuticals. E.R.L. is a consultant for ZOE Global. E.G.E.d.V. reports an advisory role at Daiichi Sankyo, NSABP and Sanofi (paid to University Medical Center Groningen) and research funding from Amgen, AstraZeneca, Bayer, Chugai Pharma, CytomX Therapeutics, G1 Therapeutics, Genentech, Nordic Nanovector, Radius Health, Regeneron, Roche, Servier and Synthon (paid to University Medical Center Groningen). S.P. received speaker fees from Almirall, BMS, ISDIN, La Roche Posay, Leo Pharma, Regeneron, Roche and Sanofi; acted as advisory board member of Almirall, ISDIN, La Roche Posay, Pfizer, Roche, Regeneron, Sanofi and Sun Pharma; and received research funding from Abbie, AMGEN, ISDIN, La Roche Posay, Leo Pharma and Novartis. R.B. has received honoraria from, and sits on advisory boards of, Novartis, BMS and MSD. All other authors declare no competing interests.

Figures

Fig. 1
Fig. 1. Association between the gut microbiome and response in the PRIMM-NL and PRIMM-UK cohorts.
a, Response evaluated by ORR (Methods) is associated with the overall microbiome structure for PRIMM-UK (P = 0.05), but not for PRIMM-NL or PFS12, as represented visually using principal-component analysis (PCA) of species-level centered log-ratio-transformed relative abundances. P values were calculated using adonis and 999 permutations (Extended Data Figs. 2 and 3 show additional beta diversity analysis). Dim1, dimension 1; Dim2, dimension 2. b, Multivariate analysis showing the amount of inferred variance explained (R2, blue vertical bars) by each identified covariate and their respective P value (orange vertical bars) as determined by PERMANOVA on species-level centered log-ratio-transformed relative abundances. c, Machine learning association analysis between taxonomic (species abundance) and functional profiles (KEGG ortholog abundances) of the microbiome and response showed consistent associations with both response types (ORR or PFS12). The ‘concordant’ label includes only patients who did not progress between 6 and 12 months. AUC-ROC curves are computed using Lasso models trained using 100-repeated fivefold-stratified cross-validations. Shaded areas represent AUC-ROCs from each individual machine learning model. ICI indicates the use of a combination of ipilimumab and nivolumab or single agent. AUC, area under the curve; CV, cross-validation; hPDI, healthy plant-based diet index; PDI, plant-based diet index; uPDI, unhealthy plant-based diet index; mMED, modified Mediterranean diet score.
Fig. 2
Fig. 2. Integrated analysis of newly sequenced and publicly available datasets for cross-cohort response–microbiome association.
a, Contribution of variables to the overall microbial community composition highlights the heterogeneity of the microbiome structure across cohorts that has a substantially higher effect than both anthropometric and clinical parameters. We either used all available cohorts or newly sequenced cohorts for which additional metadata were available. Batch-correction methods were applied to species-level abundances prior to distance calculations. The plot on the left uses ORR as the outcome variable, whereas the plot on the right adopts PFS12. b, Prediction matrix for microbiome-based prediction of response assessed via ORR (left matrix) and PFS12 (right matrix) within each cohort (values on the diagonal), across pairs of cohorts (one cohort used to train the model and the other for testing) and in the leave-one-cohort-out setting (training the model on all but one cohort and testing on the left-out cohort). We report the AUC-ROC values obtained from Lasso models on species-level relative abundances. Values on the diagonal refer to the median AUC-ROC values of 100-repeated fivefold-stratified cross-validations. Off-diagonal values refer to AUC-ROC values obtained by training the classifier on the cohort of the corresponding row and applying it to the cohort of the corresponding column. The leave-one-out row refers to the performances obtained by training the model using all but the cohort of the corresponding column and applying it to the cohort of the corresponding column. The same prediction matrix using functional microbiome profiles are available in Extended Data Fig. 4. c, ORR (n = 284) cross-validation AUC-ROC values obtained from Lasso models trained using 100-repeated fivefold-stratified cross-validations (boxplots) and leave-one-dataset-out AUC-ROC values from Lasso models obtained by training the model using species-level relative abundances and all but the corresponding (circles). The lower and upper hinges of boxplots correspond to the 25th and 75th percentiles, respectively. The midline is the median. The upper and lower whiskers extend from the hinges to the largest (or smallest) value no further than 1.5× interquartile range from the hinge, defined as the distance between the 25th and 75th percentiles. EC, enzyme category.
Fig. 3
Fig. 3. A panel of potential taxonomic and function microbiome biomarkers for response across cohorts.
a, Species associated with ORR identified by a meta-analysis using different differential abundance methods. Species shown have random-effects model P values < 0.05 in at least three methods. Values inside the cells refer to unadjusted P values < 0.05 obtained by two-tailed Wilcoxon tests on differences in the relative abundance of responders and nonresponders. The color of the cell was determined by comparing the mean relative abundance in responders to nonresponders; if the mean was higher in responders, then the cells were colored red; if it was higher in nonresponders, then it was colored blue. b, Species associated with PFS12 identified by a meta-analysis using different differential abundance methods. Species shown have random-effects model P values < 0.05 in at least three methods. Values inside the cells refer to unadjusted P values < 0.05 obtained by two-tailed Wilcoxon tests on differences in the relative abundance of responders and nonresponders. c, KOs associated with response status identified by a meta-analysis using different differential abundance methods. The KEGG orthologues shown have random-effects model P values < 0.05 in at least six methods. Values inside the cells refer to unadjusted P values < 0.05 obtained by two-tailed Wilcoxon tests on differences in the relative abundance of responders and nonresponders. d, Species associated with ORR in the two PRIMM cohorts (PRIMM-NL (n = 47) and PRIMM-UK (n = 53)) before and after adjusting for covariates that included PPI, antibiotic and steroid use; gender, performance status; previous therapy; age; and ICIs. Species shown have covariate-adjusted multiple hypothesis testing-corrected q < 0.2 in one of the cohorts identified by ANCOM-BC. Symbols (circles and triangles) show the ANCOM-BC beta coefficient, and error bars represent standard error. Adj, adjusted; NR, nonresponders; R, responders; SMD, standardized mean differences.
Fig. 4
Fig. 4. Covariate associations with the gut microbiome from the PRIMM cohorts.
a, Cross-validation AUC-ROC values obtained from Lasso models trained using 100-repeated fivefold-stratified cross-validations (boxplots) and leave-one-dataset-out AUC-ROC values from Lasso models obtained by training the model using species-level relative abundances and all but the corresponding PRIMM cohort (circles). The lower and upper hinges of boxplots correspond to the 25th and 75th percentiles, respectively. The midline is the median. The upper and lower whiskers extend from the hinges to the largest (or smallest) value no further than 1.5× interquartile range from the hinge, defined as the distance between the 25th and 75th percentiles (PRIMM-NL, n = 55; PRIMM-UK, n = 55). bd, Species associated with PPI use (<3 months after the start of ICI), toxicity and colitis identified by ANCOM-BC with and without covariate adjustment (PRIMM-NL, n = 47; PRIMM-UK, n = 53). Covariates included in all models were ORR, performance status, previous therapy, age, ICIs (combination of ipilimumab and nivolumab or single agent), gender and antibiotic and steroid use. PPI use was also included as a covariate when analyzing colitis and toxicity. Species shown have covariate-adjusted multiple hypothesis testing-corrected q < 0.2 in one of the cohorts identified by ANCOM-BC. Symbols (circles and triangles) show the ANCOM-BC beta coefficient, and error bars represent standard error.
Extended Data Fig. 1
Extended Data Fig. 1. Associations between alpha diversity and response.
(a) Alpha diversity measures in the two PRIMM cohorts. # p refers to P values calculated using limma linear models including PPI, antibiotic and steroid use, gender, performance status, previous therapy, age, plant-based diet index, unhealthy plant-based diet index, mediterranean diet score and ICI in the model. $ p refers to p values calculated using the Wilcoxon Rank-Sum Test. The lower and upper hinges of boxplots correspond to the 25th and 75th percentiles, respectively. The midline is the median. The upper and lower whiskers extend from the hinges to the largest (or smallest) value no further than ×1.5 interquartile range from the hinge, defined as the distance between the 25th and 75th percentiles. Meta-analysis results obtained using standardized mean differences between responders and nonresponders using (b) Shannon diversity and (c) species richness. The centre of the error bars (grey shaded squares) represent the standardized mean difference for each cohort.
Extended Data Fig. 2
Extended Data Fig. 2. Machine learning association analysis of the microbiome and response in PRIMM-NL.
(a-e) Machine learning association analysis of the microbiome and response using either metadata alone or in combination with taxonomic (species abundance) and functional profiles (KEGG orthologs’ abundances) in PRIMM-NL. AUC-ROC curves are computed using LASSO models trained using 100-repeated fivefold-stratified cross-validations. Metadata used in the models included: age, gender, performance status, PPI use, antibiotic use, steroid use, ICI and previous therapy. Shaded areas represent AUC-ROCs from each individual machine learning model. (f) Multivariate analysis showing the amount of inferred variance explained (R2, blue vertical bars) by each identified covariate and their respective p value (orange vertical bars) as determined by PERMANOVA on KEGG clr-transformed relative abundances.
Extended Data Fig. 3
Extended Data Fig. 3. Machine learning association analysis of the microbiome and response in PRIMM-UK.
(a-e) Machine learning association analysis of the microbiome and response using either metadata alone or in combination with taxonomic (species abundance) and functional profiles (KEGG orthologs’ abundances) in PRIMM-UK. AUC-ROC curves are computed using LASSO models trained using 100-repeated fivefold stratified cross-validations. Metadata used in the models included: age, gender, performance status, PPI use, antibiotic use, steroid use, ICI and previous therapy. Shaded areas represent AUC-ROCs from each individual machine learning model. (f) Multivariate analysis showing the amount of inferred variance explained (R2, blue vertical bars) by each identified covariate and their respective p value (orange vertical bars) as determined by PERMANOVA on KEGG clr-transformed relative abundances.
Extended Data Fig. 4
Extended Data Fig. 4. Cross-cohort response–microbiome associations at the functional level.
(a) Contribution of variables to the overall microbial community composition. Batch-correction methods were applied to KEGG abundances prior to distance calculations. The plot on the left uses ORR as the outcome variable, whereas the plot on the right adopts PFS12. (b) Prediction matrix for microbiome-based prediction of response assessed via ORR (left matrix) and PFS12 (right matrix) within each single cohort (values on the diagonal), across pairs of cohorts (one cohort used to train the model and the other for testing), and in leave-one-cohort-out setting (training the model on all but one cohort and testing on the left-out cohort). We report the AUC-ROC values obtained from LASSO models on KEGG relative abundances (top) and level 4 enzyme categories (bottom). Values on the diagonal refer to the median AUC-ROC values of 100-repeated fivefold stratified cross-validations. Off-diagonal values refer to AUC-ROC values obtained by training the classifier on the cohort of the corresponding row and applying it to the cohort of the corresponding column. The leave-one-out row refers to the performances obtained by training the model using all but the cohort of the corresponding column and applying it to the cohort of the corresponding column.
Extended Data Fig. 5
Extended Data Fig. 5. Machine learning association analysis using random forest.
(a) Prediction matrix for microbiome-based prediction of response assessed via ORR (left matrix) and PFS12 (right matrix) within each single cohort (values on the diagonal), across pairs of cohorts (one cohort used to train the model and the other for testing), and in leave-one-cohort-out setting (training the model on all but one cohort and testing on the left-out cohort). We report the AUC-ROC values obtained from Random Forest models on species-level relative abundances. Values on the diagonal refer to the median AUC-ROC values of 100-repeated fivefold stratified cross-validations. Off-diagonal values refer to AUC-ROC values obtained by training the classifier on the cohort of the corresponding row and applying it to the cohort of the corresponding column. The leave-one-out row refers to the performances obtained by training the model using all but the cohort of the corresponding column and applying it to the cohort of the corresponding column. (b) Cross-validation AUC-ROC values obtained from Random Forest models trained using 100-repeated fivefold stratified cross-validations (boxplots) and leave-one-dataset-out AUC-ROC values from Random Forest models obtained by training the model using species-level relative abundances and all but the corresponding PRIMM cohort (circles). PRIMM-NL (n = 55) and PRIMM-UK (n = 55). The lower and upper hinges of boxplots correspond to the 25th and 75th percentiles, respectively. The midline is the median. The upper and lower whiskers extend from the hinges to the largest (or smallest) value no further than ×1.5 interquartile range from the hinge, defined as the distance between the 25th and 75th percentiles.
Extended Data Fig. 6
Extended Data Fig. 6. Taxonomic overview of species associations with response.
Cladogram showing species associated with Responders (red) and nonresponders (blue) using ORR and identified by a minimum of 2 meta-analysis methods. The height of the outer bar plots reflects the number of meta-analysis methods supporting the association.
Extended Data Fig. 7
Extended Data Fig. 7. Reproducible biomarkers for colorectal cancer across cohorts.
Species associated with CRC identified by a meta-analysis using different differential abundance methods. Species shown have random-effects model p values < 0.05 in at least 6 methods out of 8 methods. Values inside the cells refer to unadjusted p values < 0.05 obtained by two-tailed Wilcoxon tests on differences in the relative abundance of patients with CRC and controls.
Extended Data Fig. 8
Extended Data Fig. 8. Microbiome biomarkers of response across cohorts.
(a) KEGG orthologues associated with PFS12 identified by a meta-analysis using different differential abundance methods. KEGGs shown have random-effects model p values < 0.05 in at least 6 methods out of 8 methods. Values inside the cells refer to unadjusted p values < 0.05 obtained by two-tailed Wilcoxon tests on differences in the relative abundance of responders and nonresponders. (b) Level 4 enzyme categories associated with PFS12 identified by a meta-analysis using different differential abundance methods. ECs shown have random-effects model p values < 0.05 in at least 6 methods out of 8 methods. Values inside the cells refer to unadjusted p values < 0.05 obtained by two-tailed Wilcoxon tests on differences in the relative abundance of responders and nonresponders. (c) Species associated with PFS12 in the two PRIMM cohorts before and after adjusting for confounders that included PPI, antibiotic and steroid use, gender, performance status, previous therapy, age and ICI. PRIMM-NL (n = 47) and PRIMM-UK (n = 52). Species shown have covariate-adjusted multiple hypothesis testing-corrected q < 0.2 in one of the cohorts identified by ANCOM-BC. Symbols (circles and triangles) show the ANCOM-BC beta coefficient and error lines represent the standard error. (d) Level 4 enzyme categories associated with ORR identified by a meta-analysis using different differential abundance methods. ECs shown have random-effects model p values < 0.05 in at least 6 methods out of 8 methods. Values inside the cells refer to unadjusted p values < 0.05 obtained by two-tailed Wilcoxon tests on differences in the relative abundance of responders and nonresponders.
Extended Data Fig. 9
Extended Data Fig. 9. Clinical parameters associated with response and the microbiome.
(a) Forest plot showing Cox logistic regression multivariate analysis of progression-free survival. Error lines represent the 95% confidence interval of the hazard ratio. (b) Cross-validation AUC-ROC values obtained from LASSO models trained using 100-repeated fivefold stratified cross-validations (boxplots) and leave-one-dataset-out AUC-ROC values from LASSO models obtained by training the model using KEGG relative abundances and all but the corresponding PRIMM cohort (circles). PRIMM-NL (n = 55) and PRIMM-UK (n = 55). The lower and upper hinges of boxplots correspond to the 25th and 75th percentiles, respectively. The midline is the median. The upper and lower whiskers extend from the hinges to the largest (or smallest) value no further than ×1.5 interquartile range from the hinge, defined as the distance between the 25th and 75th percentiles.

Comment in

References

    1. Larkin J, et al. Five-year survival with combined nivolumab and ipilimumab in advanced melanoma. N. Engl. J. Med. 2019;381:1535–1546. doi: 10.1056/NEJMoa1910836. - DOI - PubMed
    1. Ascierto PA, et al. Survival outcomes in patients with previously untreated BRAF wild-type advanced melanoma treated with nivolumab therapy: three-year follow-up of a randomized phase 3 trial. JAMA Oncol. 2019;5:187–194. doi: 10.1001/jamaoncol.2018.4514. - DOI - PMC - PubMed
    1. Larkin J, et al. Combined nivolumab and ipilimumab or monotherapy in untreated melanoma. N. Engl. J. Med. 2015;373:23–34. doi: 10.1056/NEJMoa1504030. - DOI - PMC - PubMed
    1. Amaria RN, et al. Neoadjuvant immune checkpoint blockade in high-risk resectable melanoma. Nat. Med. 2018;24:1649–1654. doi: 10.1038/s41591-018-0197-1. - DOI - PMC - PubMed
    1. Matson V, et al. The commensal microbiome is associated with anti–PD-1 efficacy in metastatic melanoma patients. Science. 2018;359:104–108. doi: 10.1126/science.aao3290. - DOI - PMC - PubMed

Publication types

MeSH terms

Substances