Meta-Analysis
. 2022 Mar;28(3):545-556.
doi: 10.1038/s41591-022-01698-2. Epub 2022 Feb 28.

Intestinal microbiota signatures of clinical response and immune-related adverse events in melanoma patients treated with anti-PD-1

Affiliations
Meta-Analysis

Intestinal microbiota signatures of clinical response and immune-related adverse events in melanoma patients treated with anti-PD-1

John A McCulloch et al. Nat Med. 2022 Mar.

Abstract

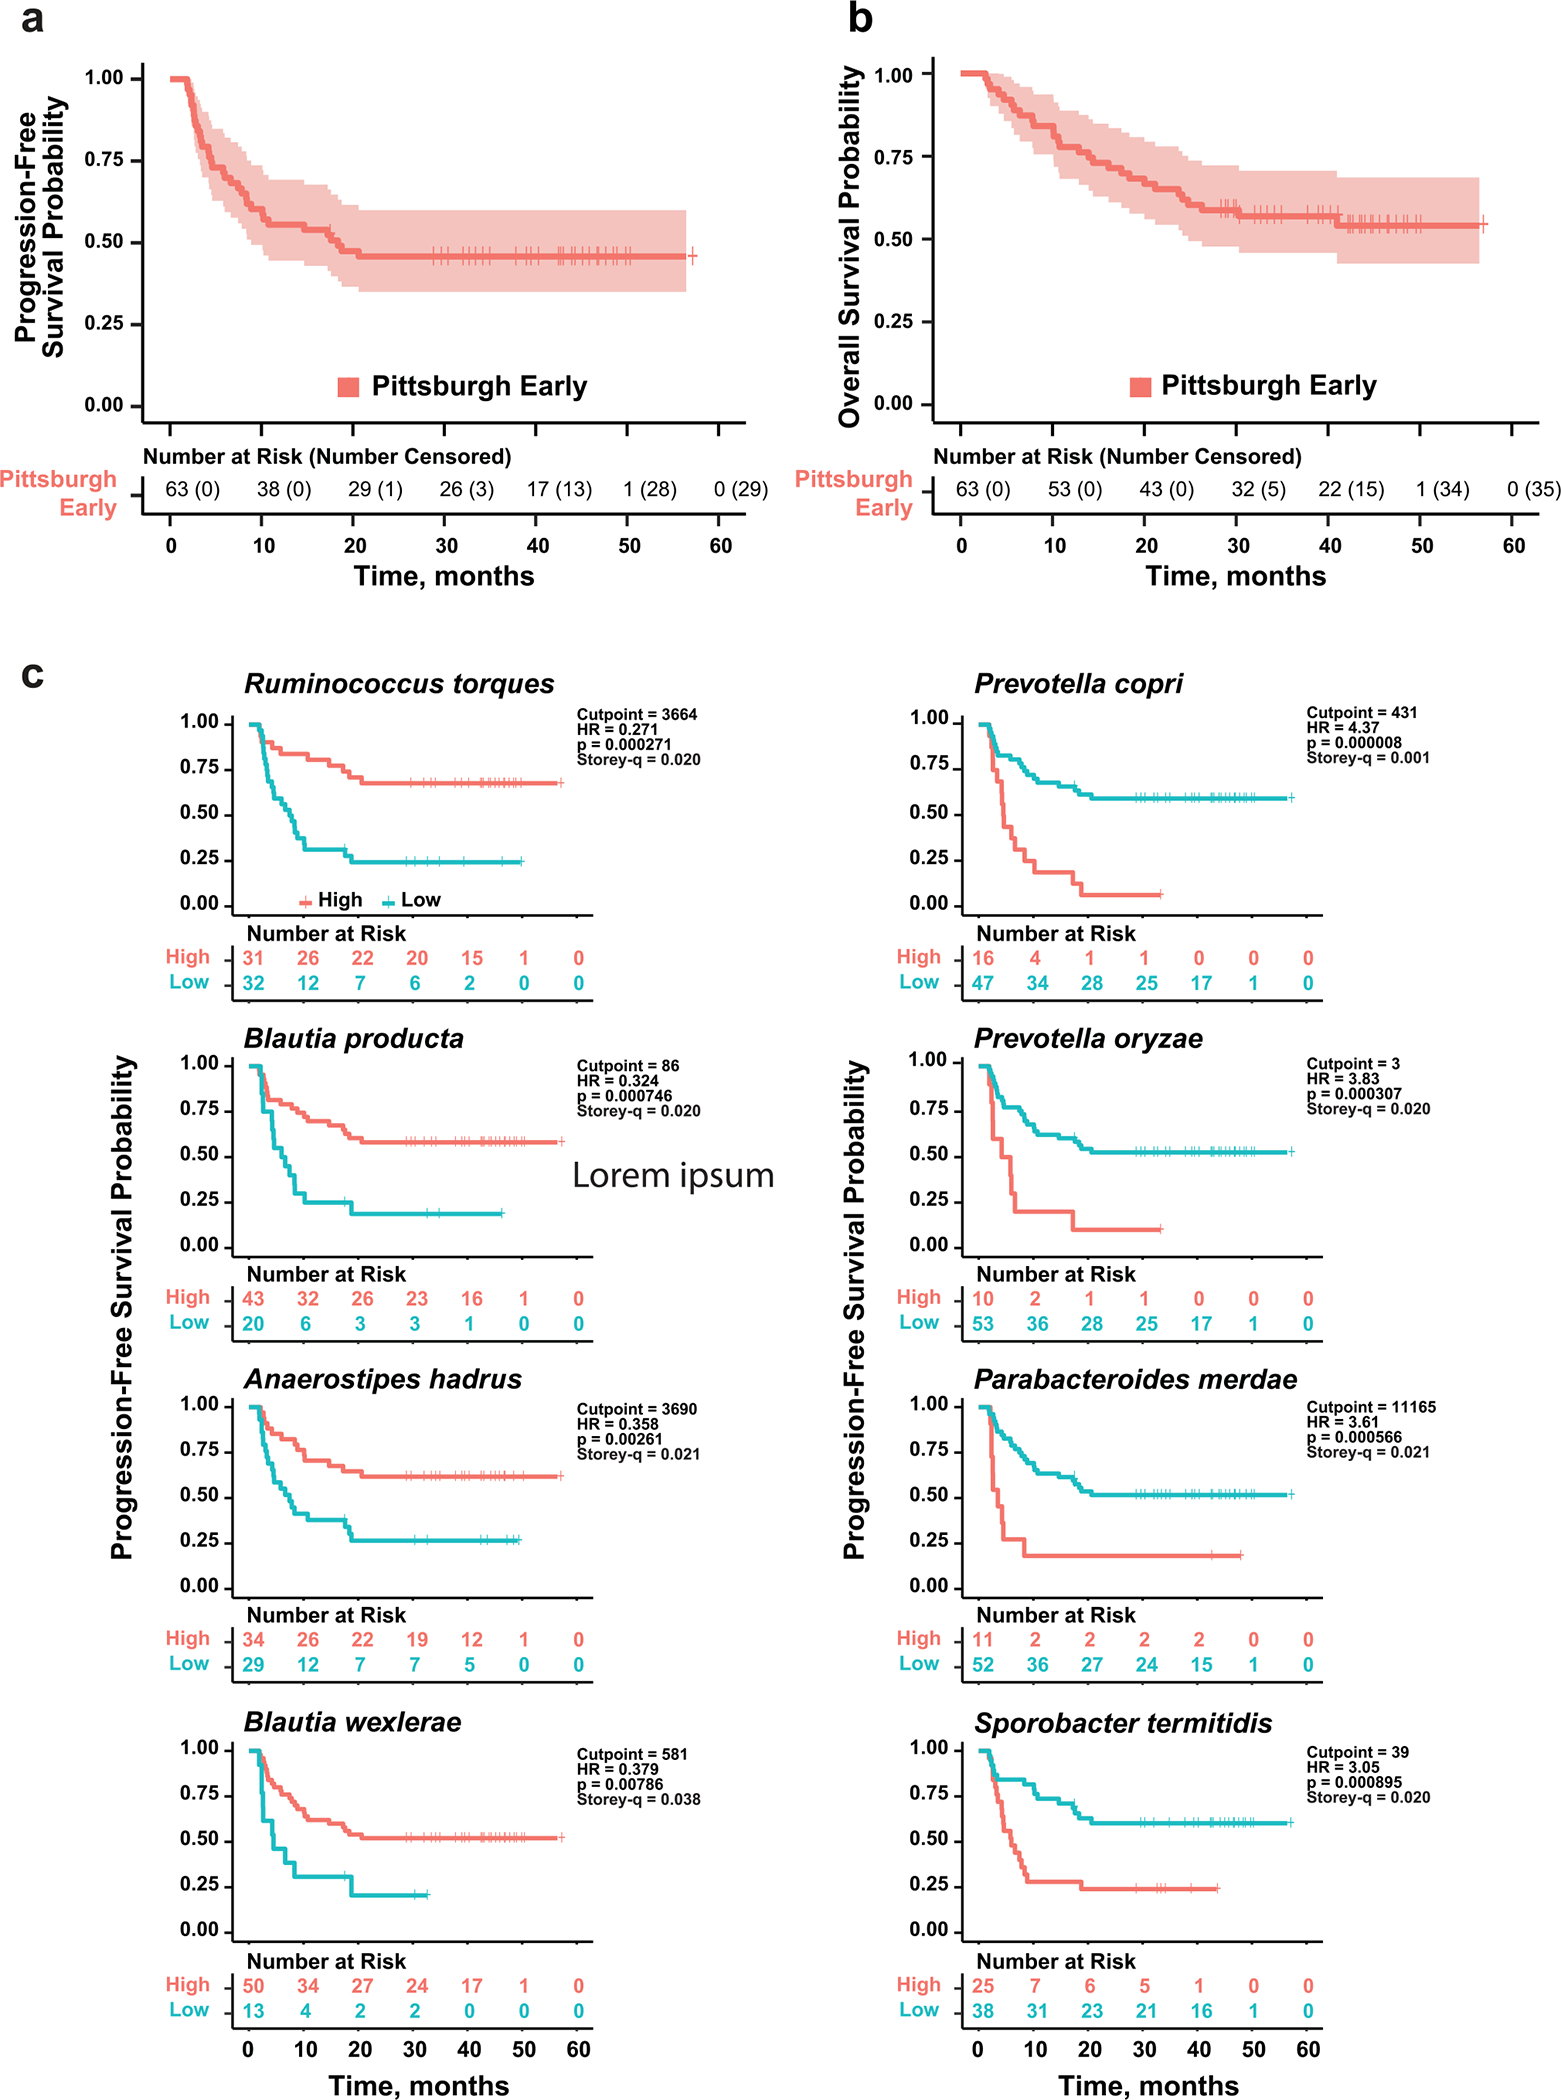
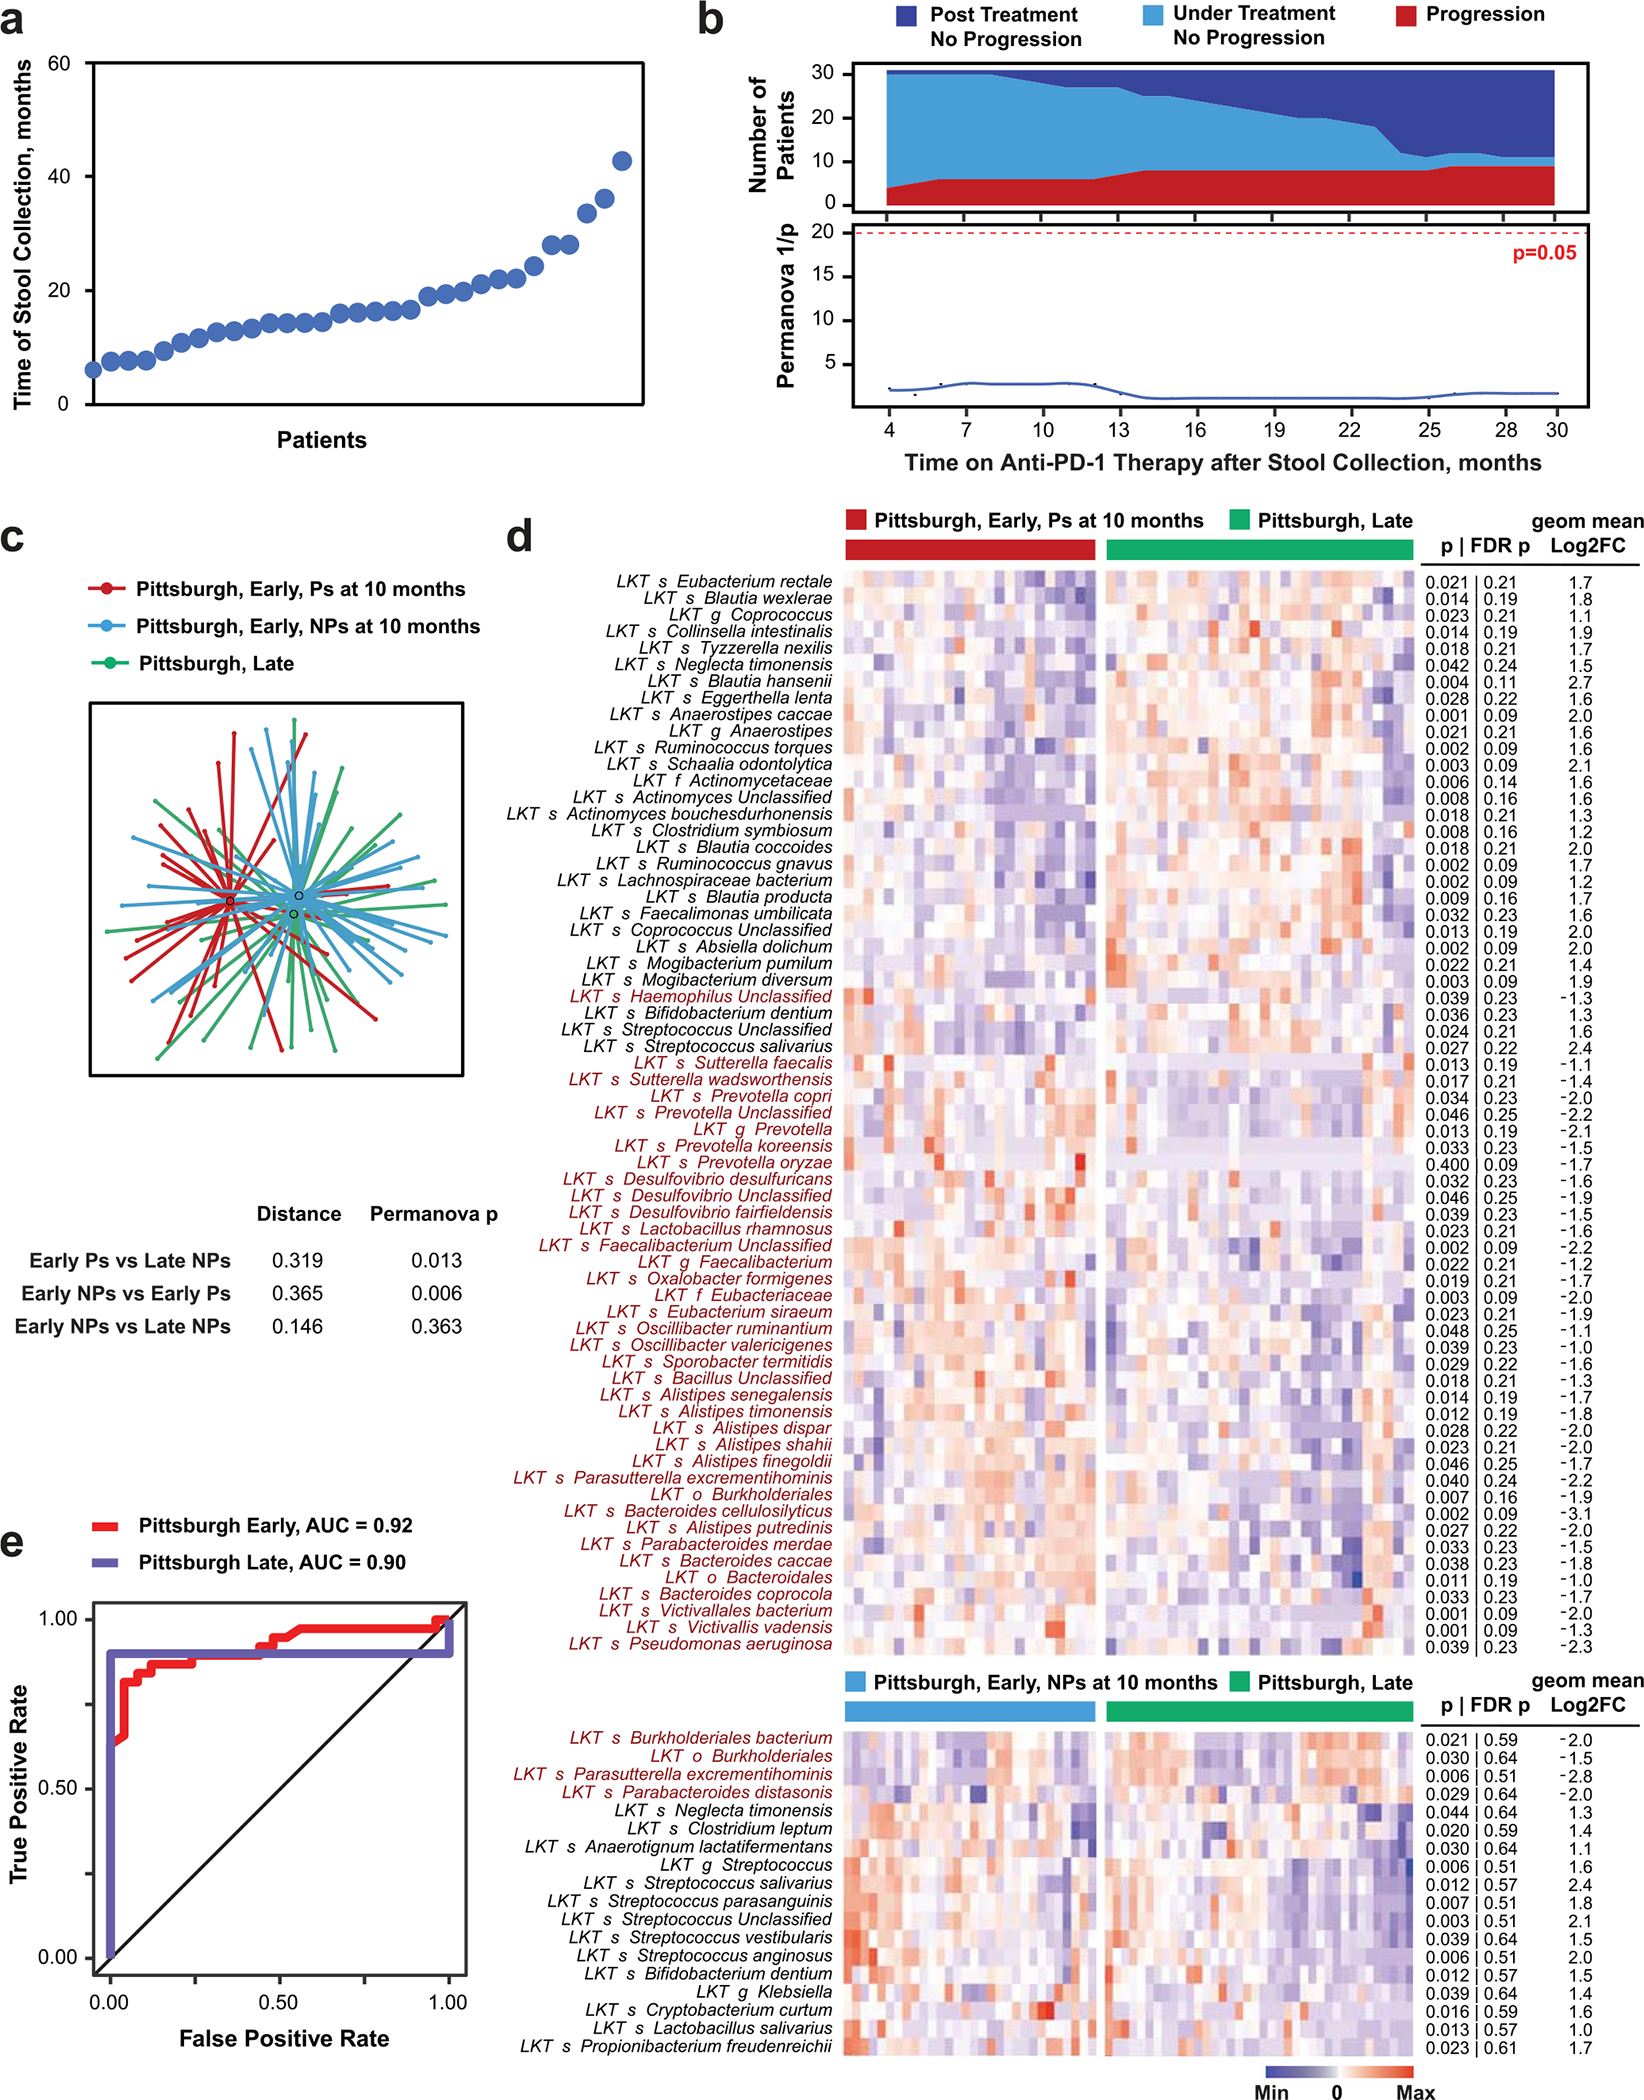
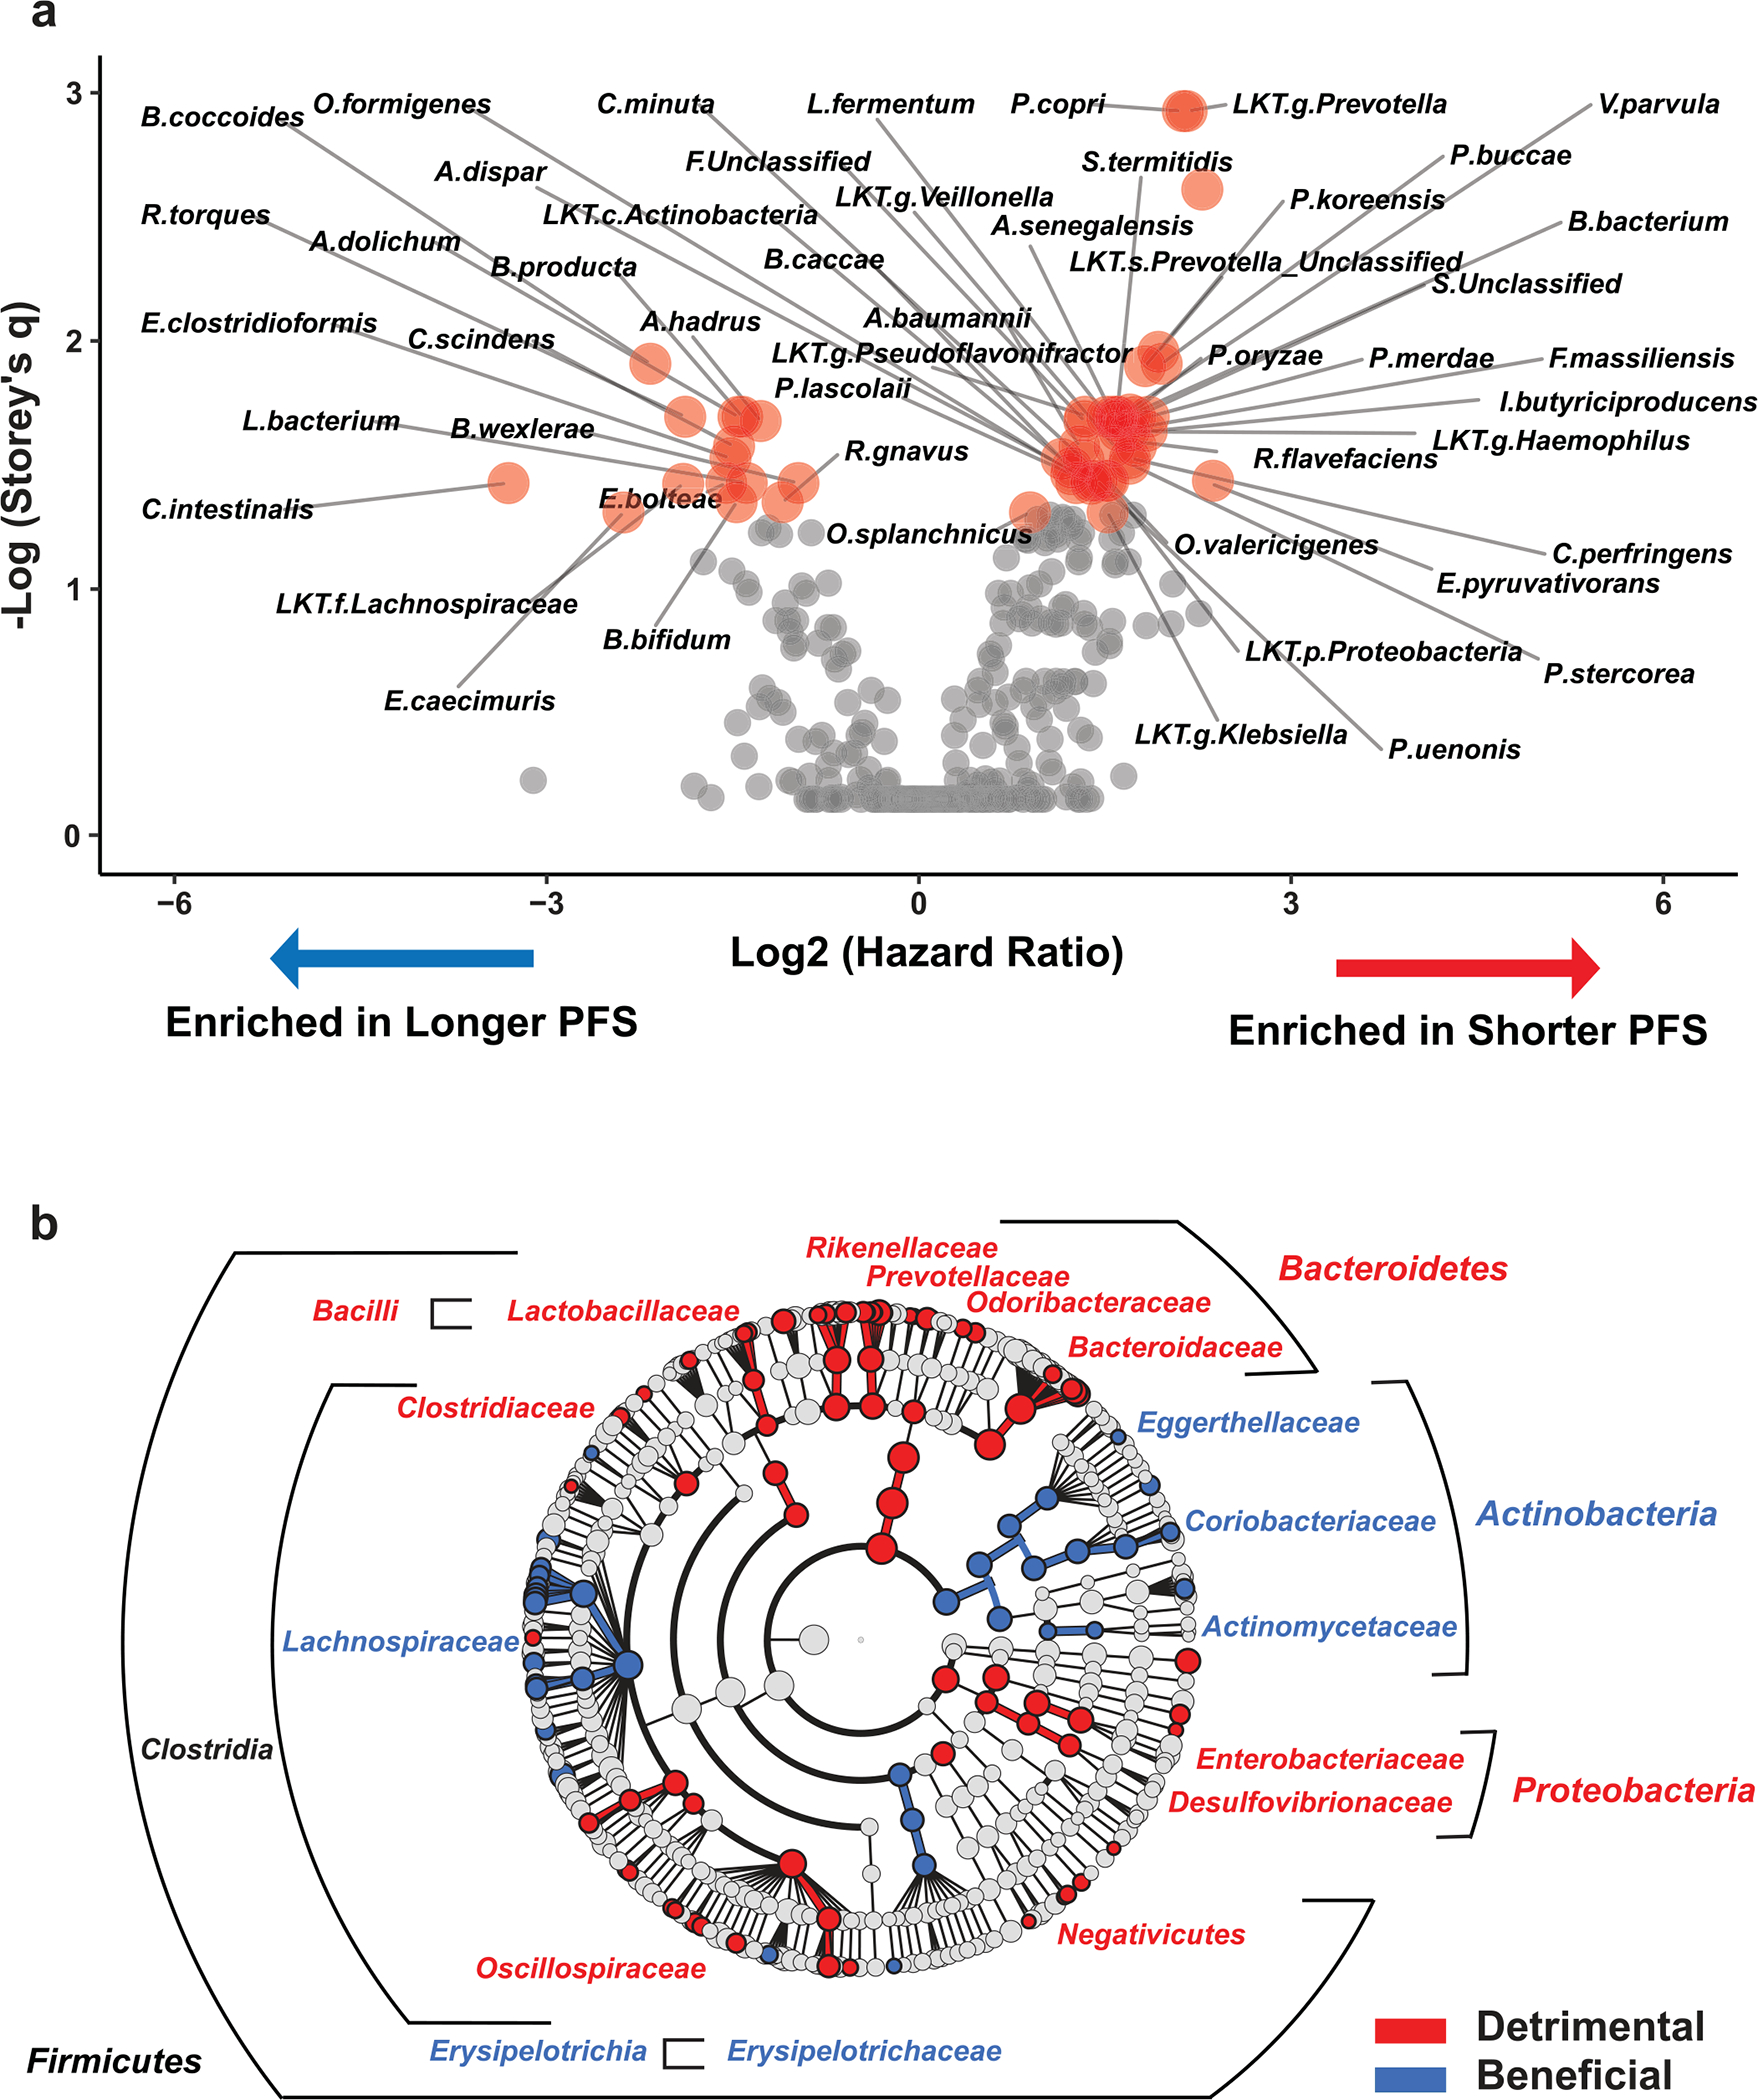
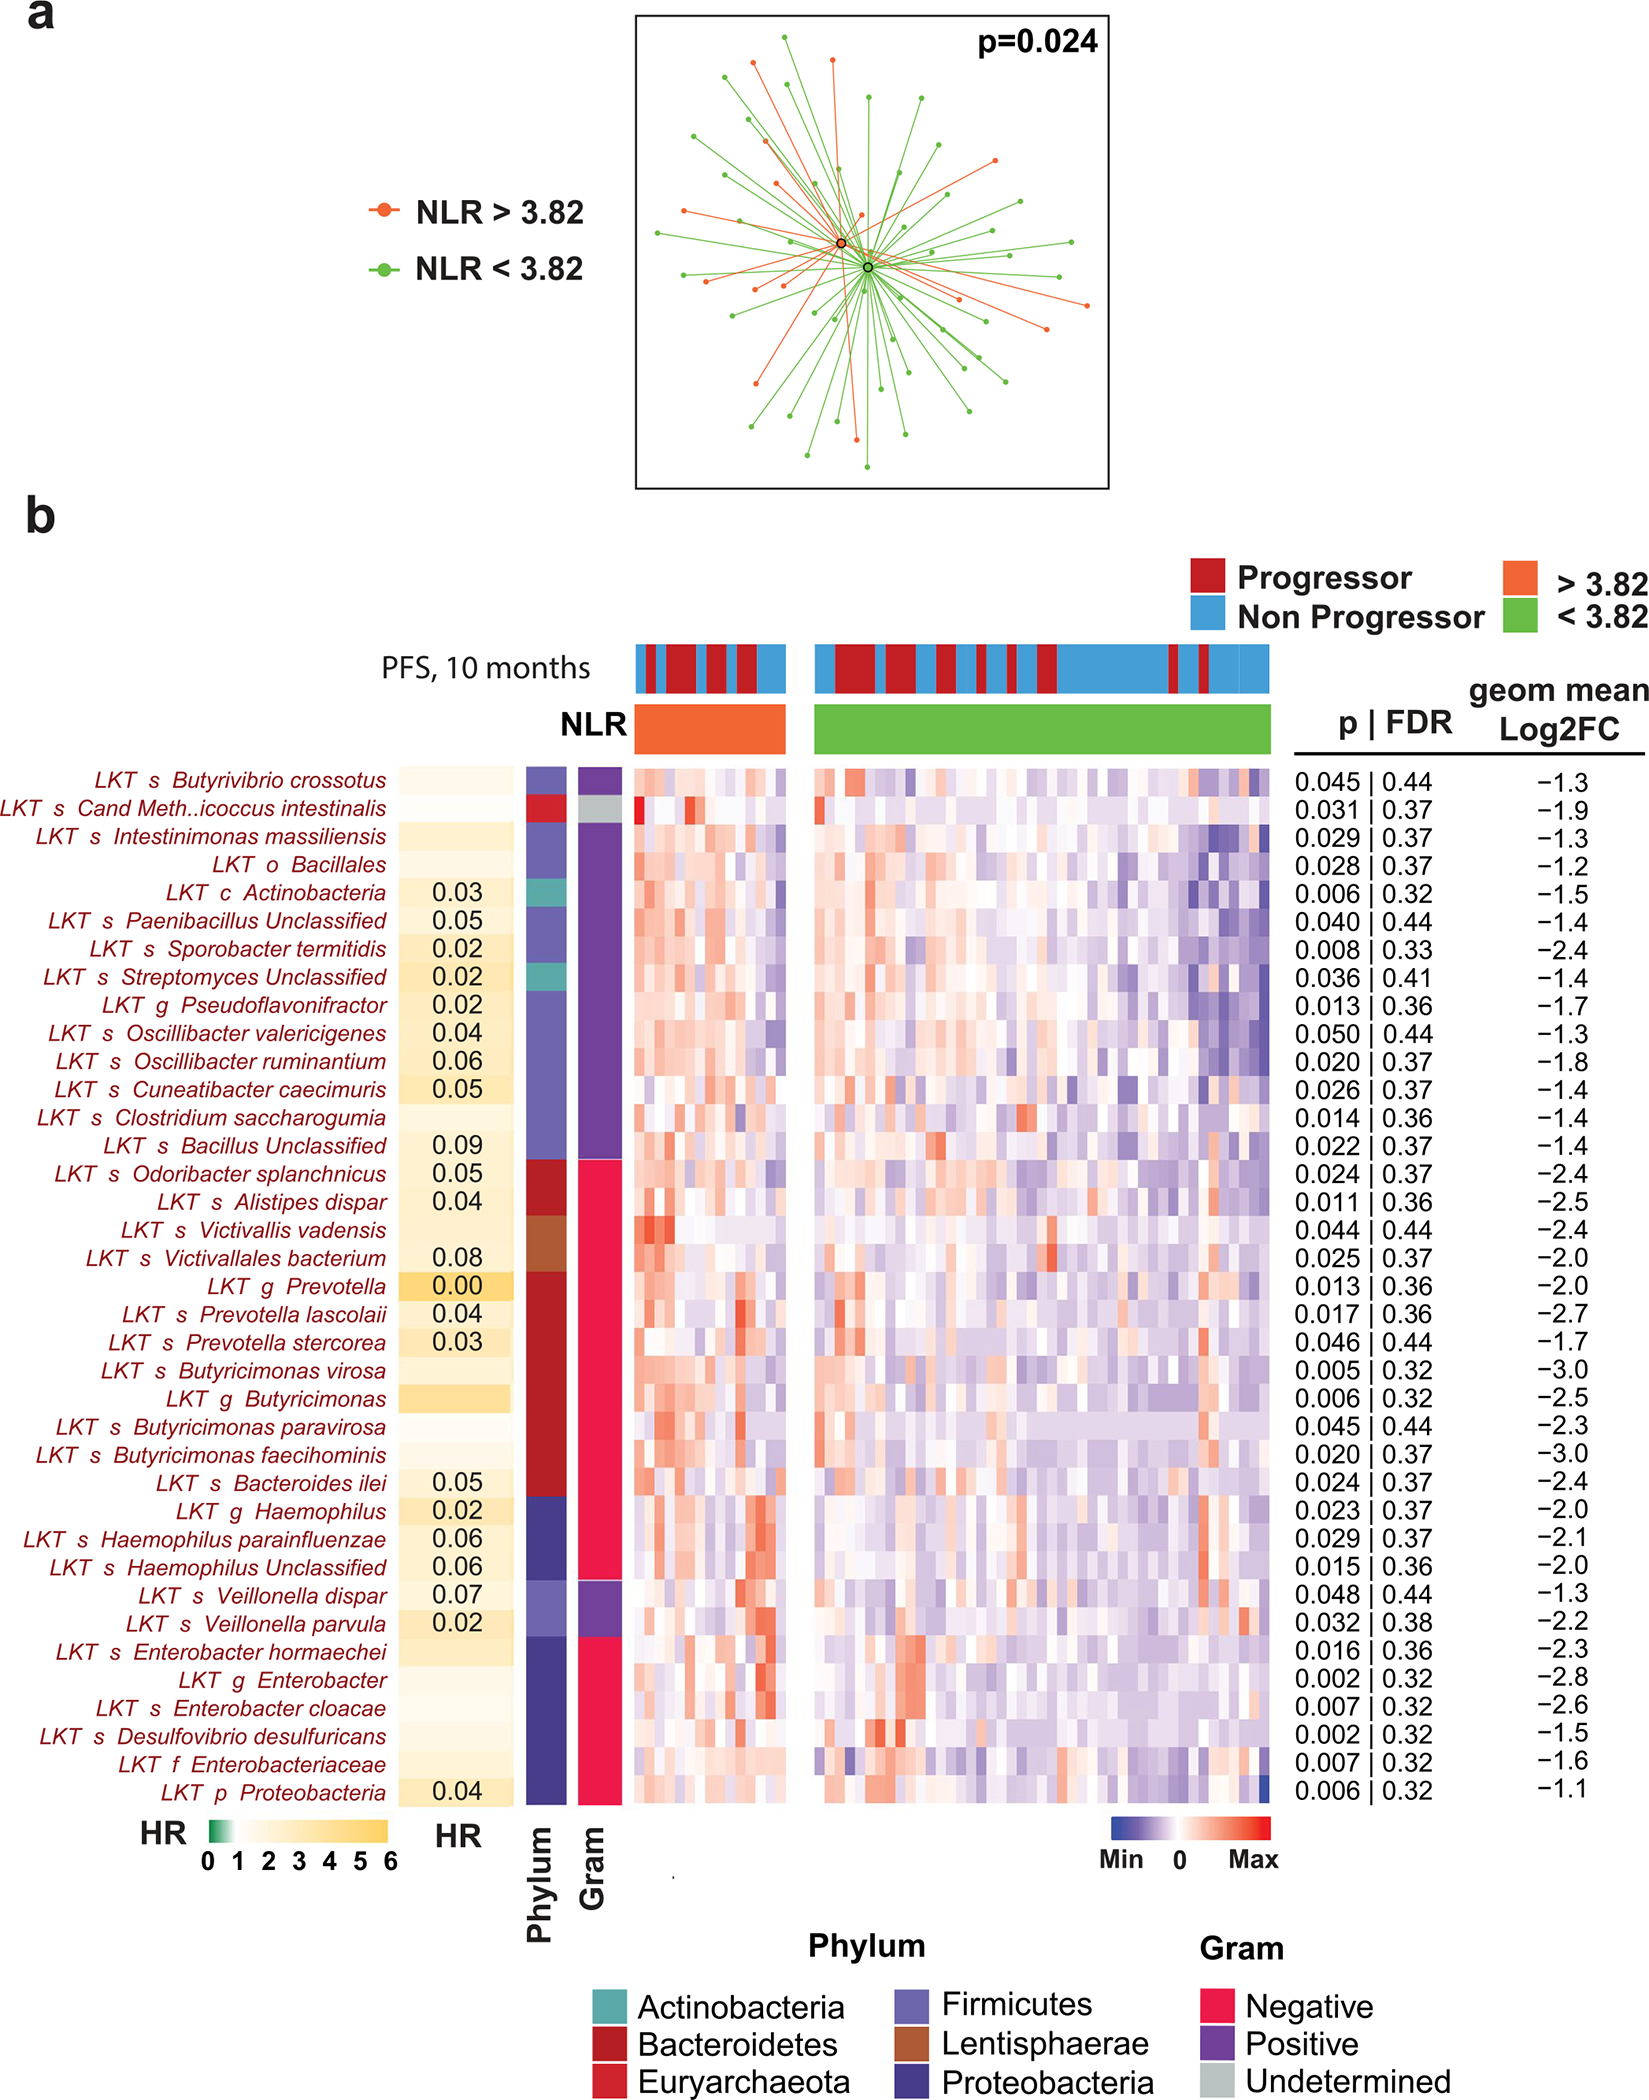
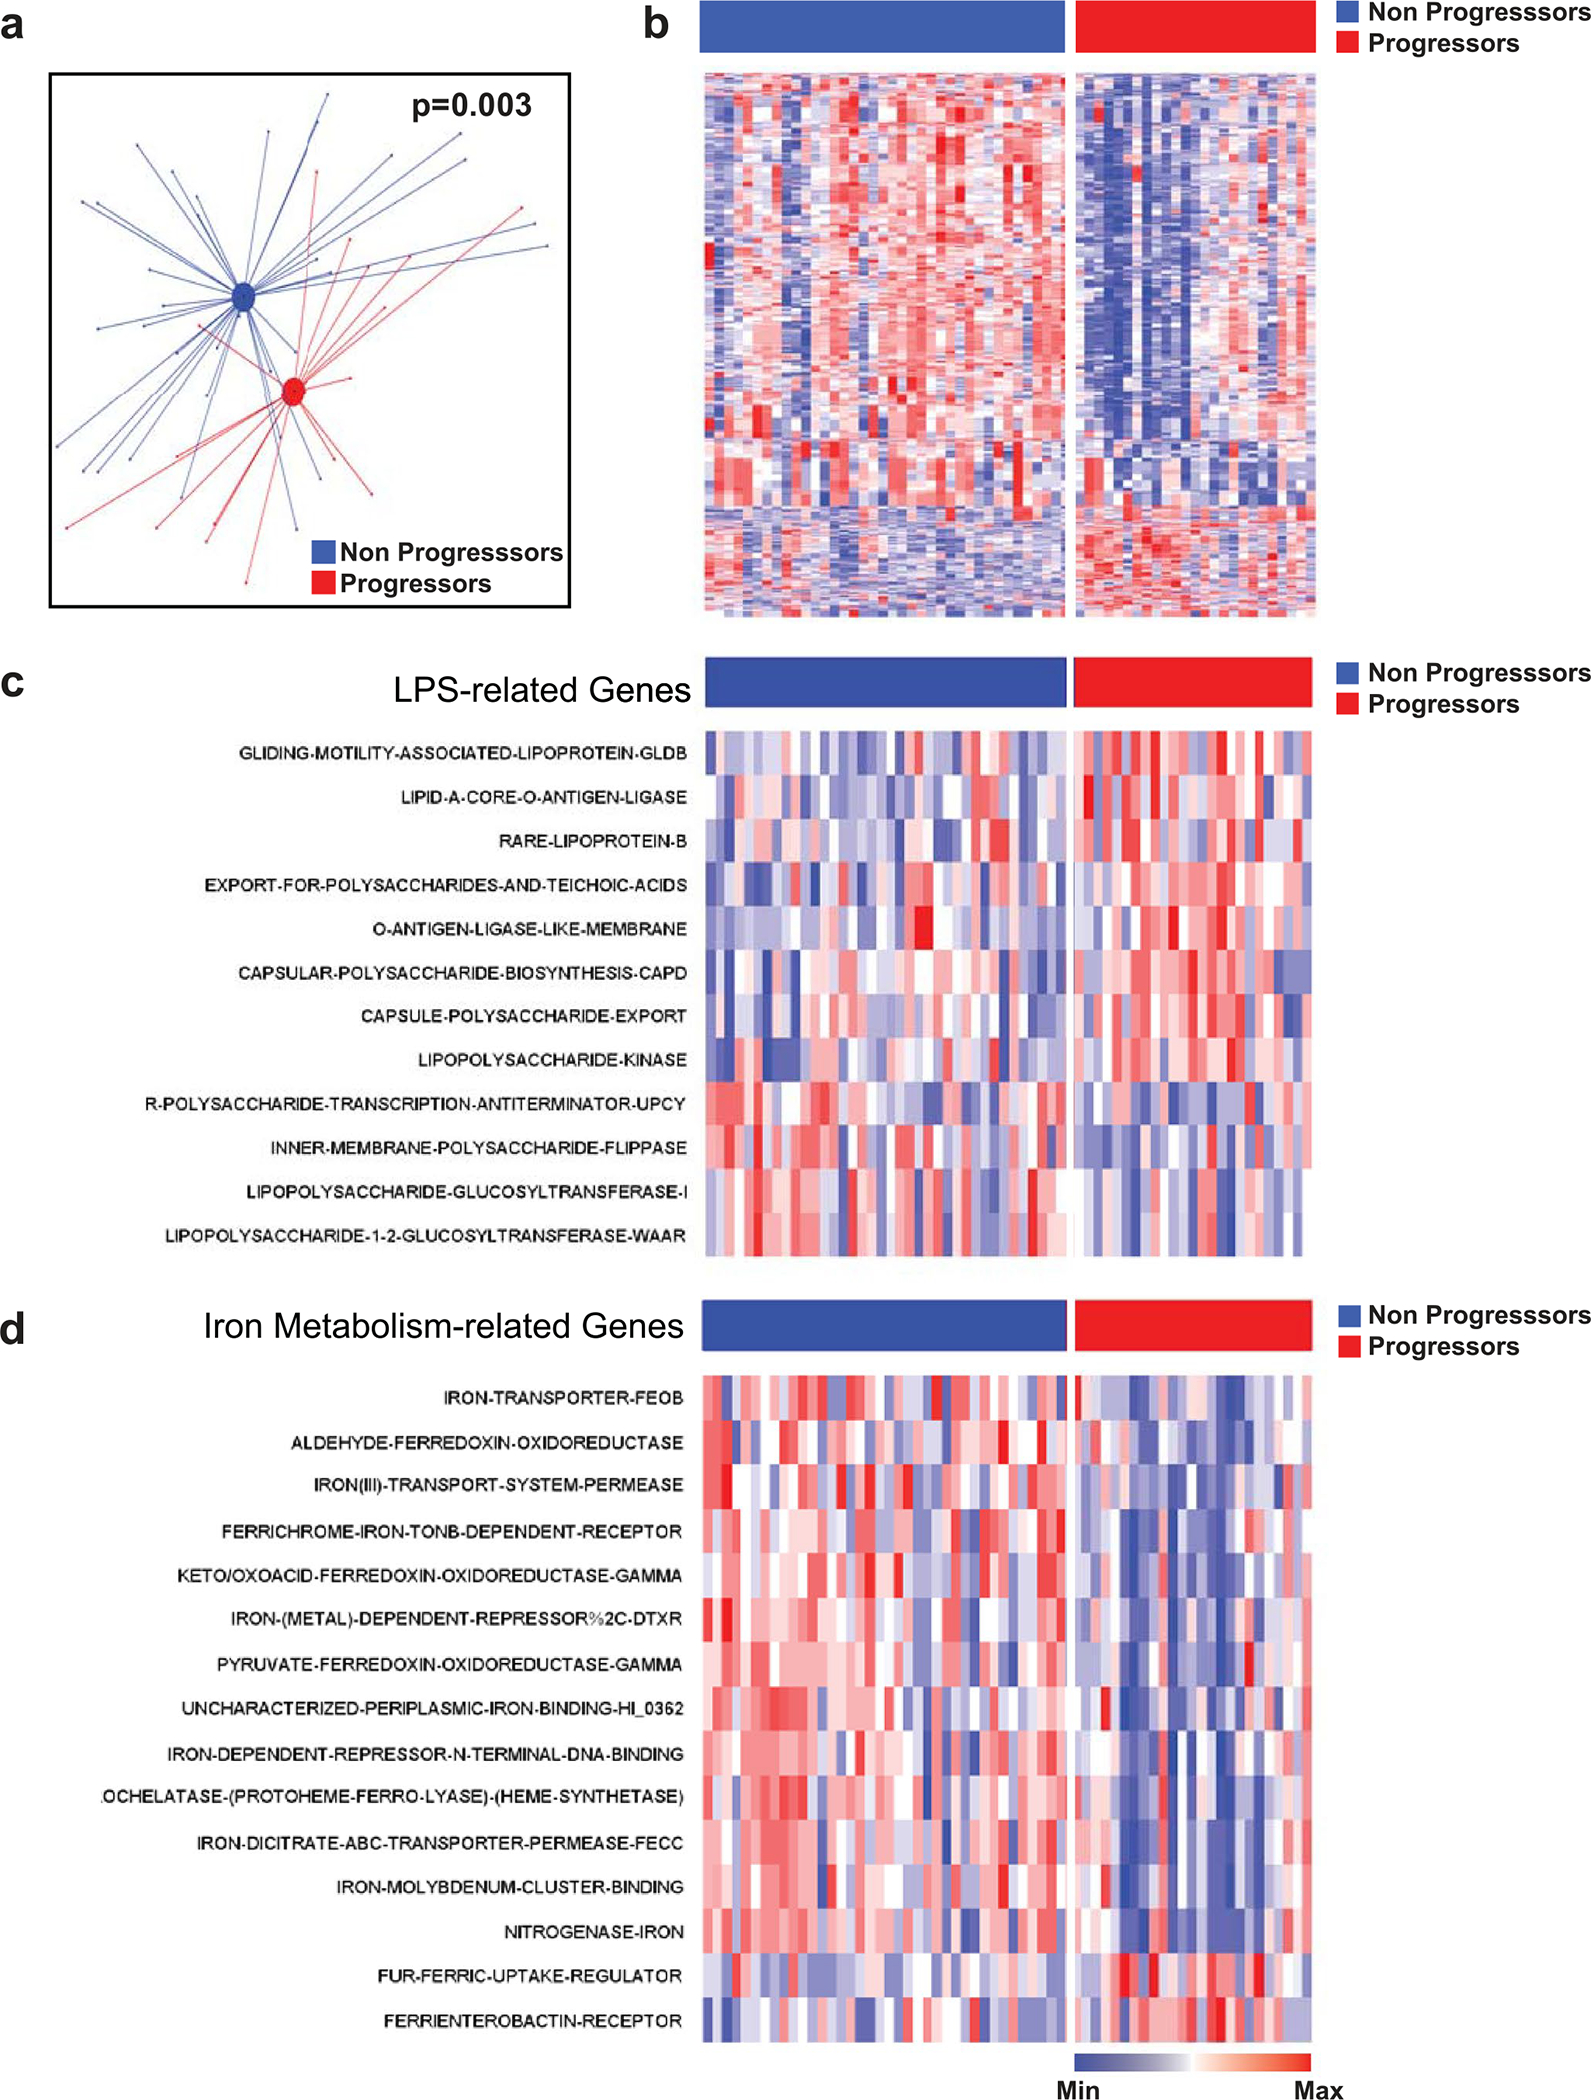
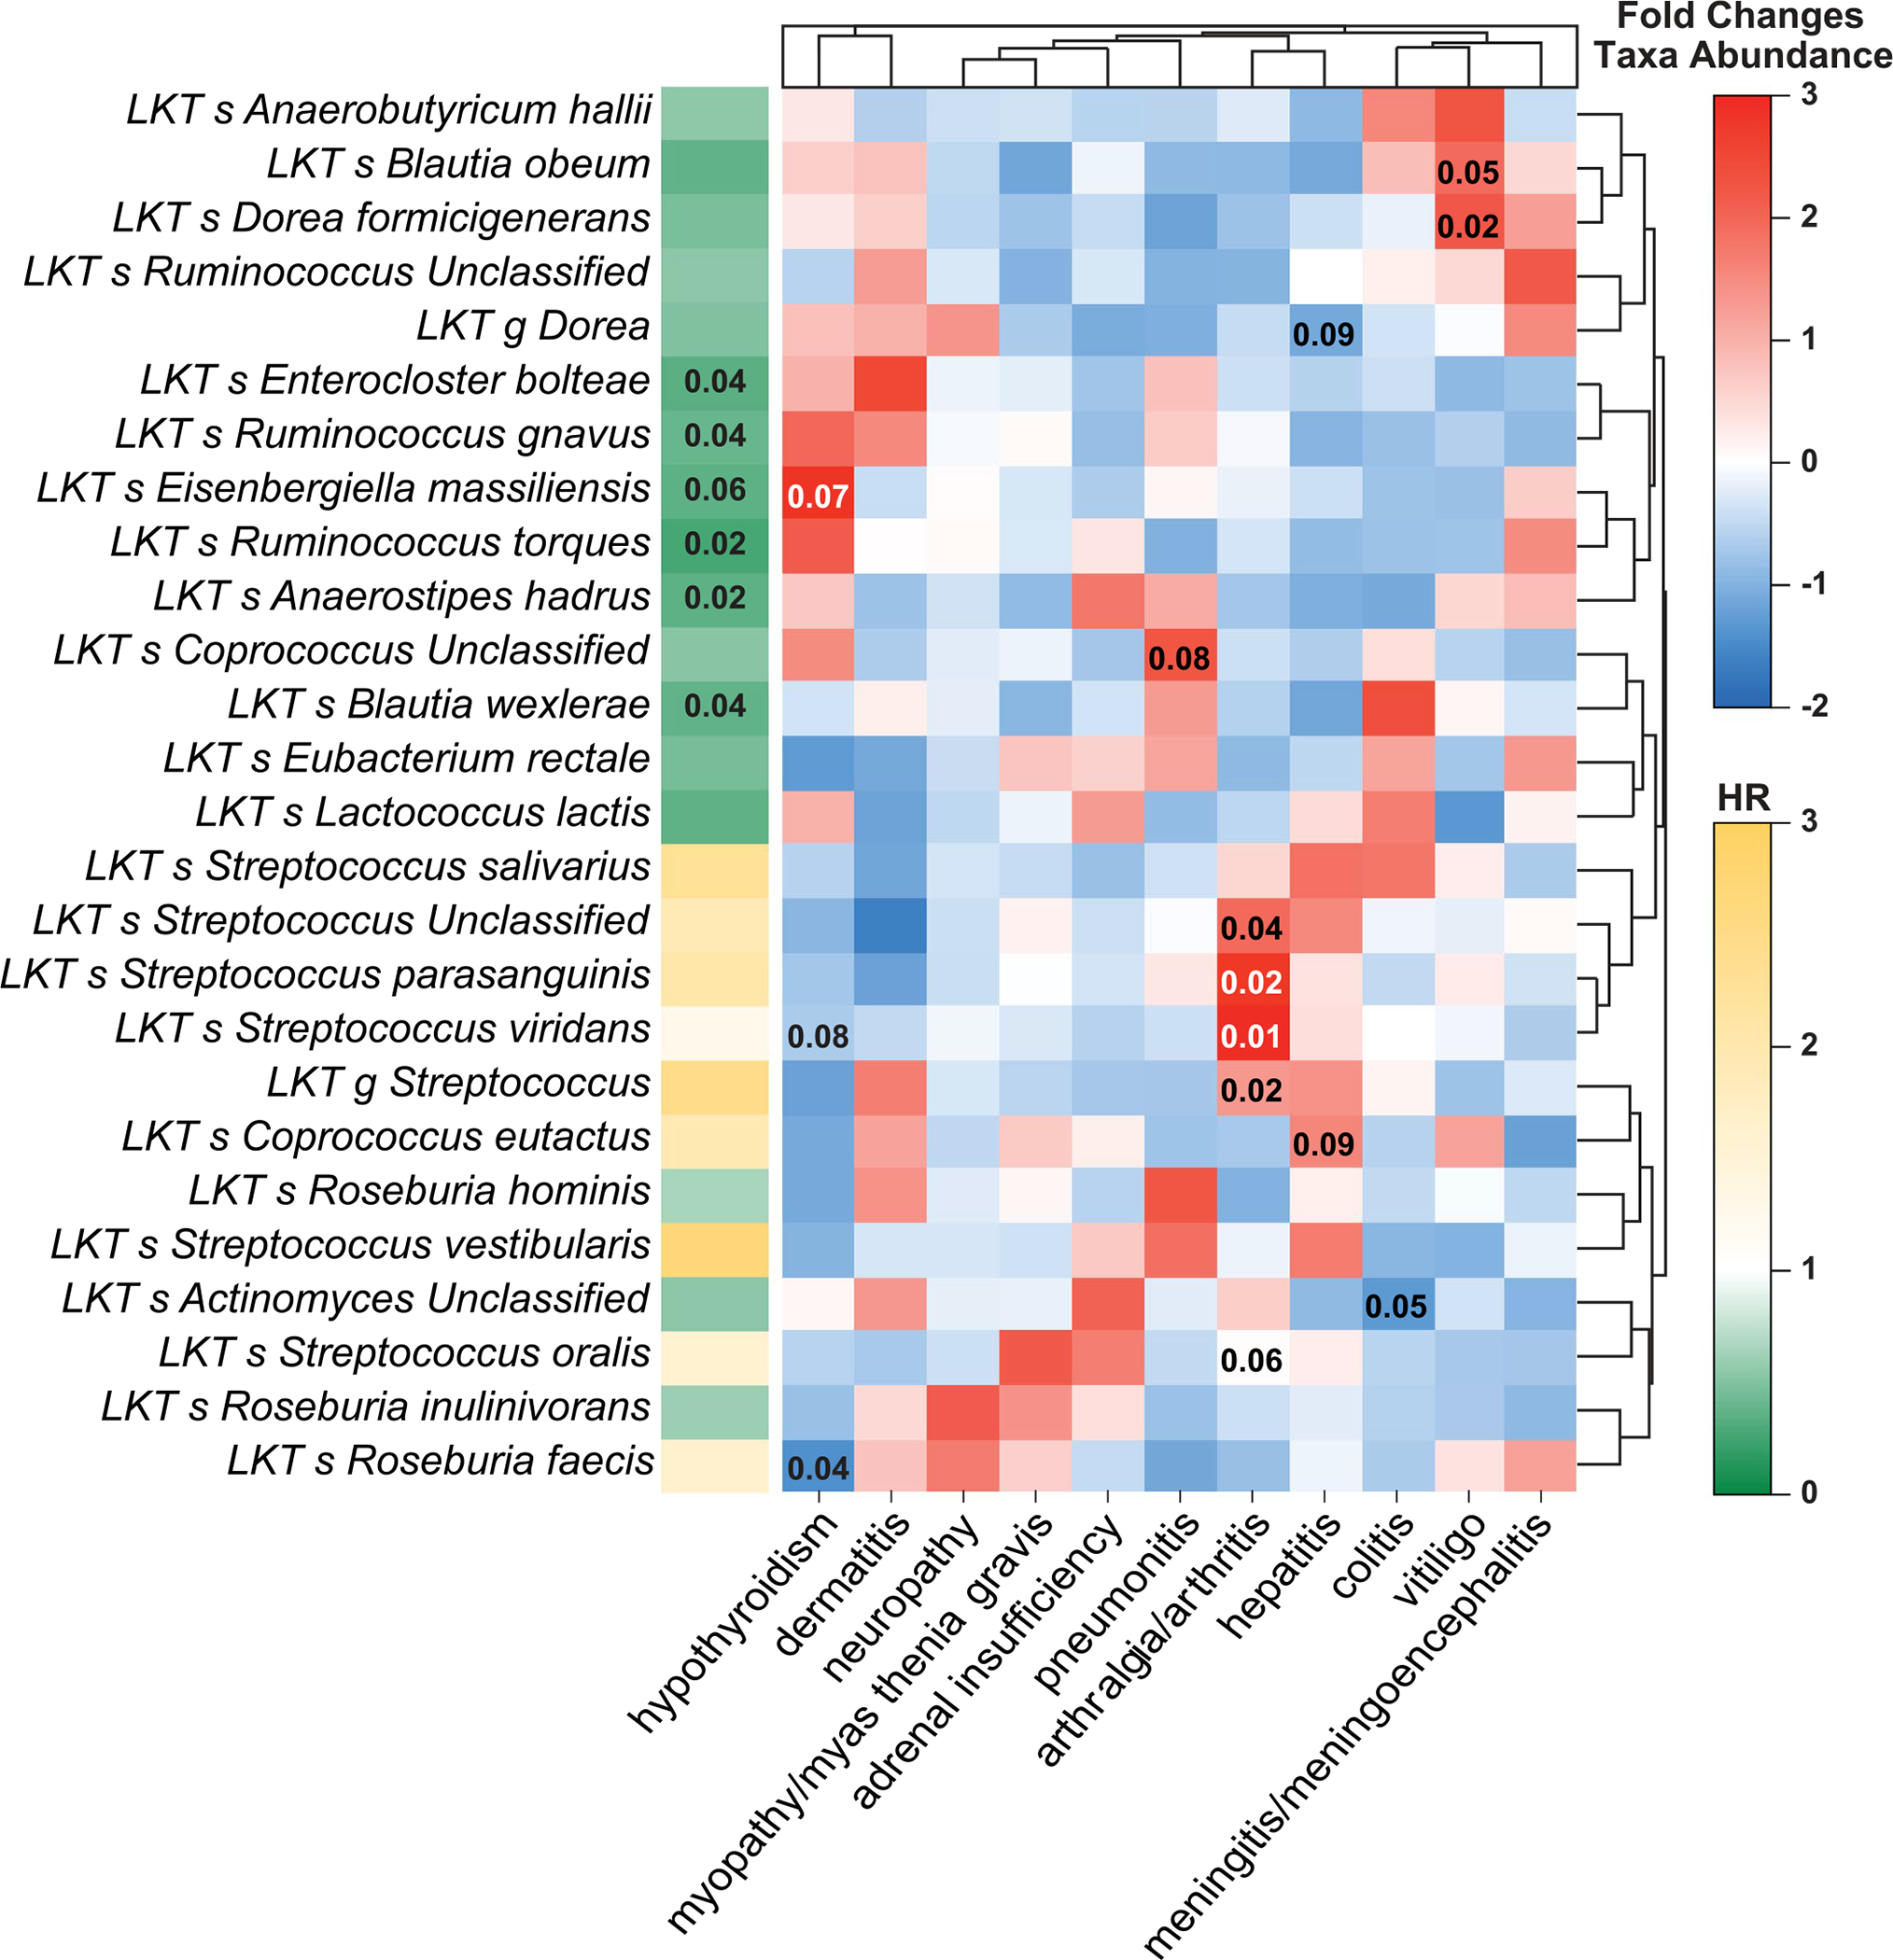
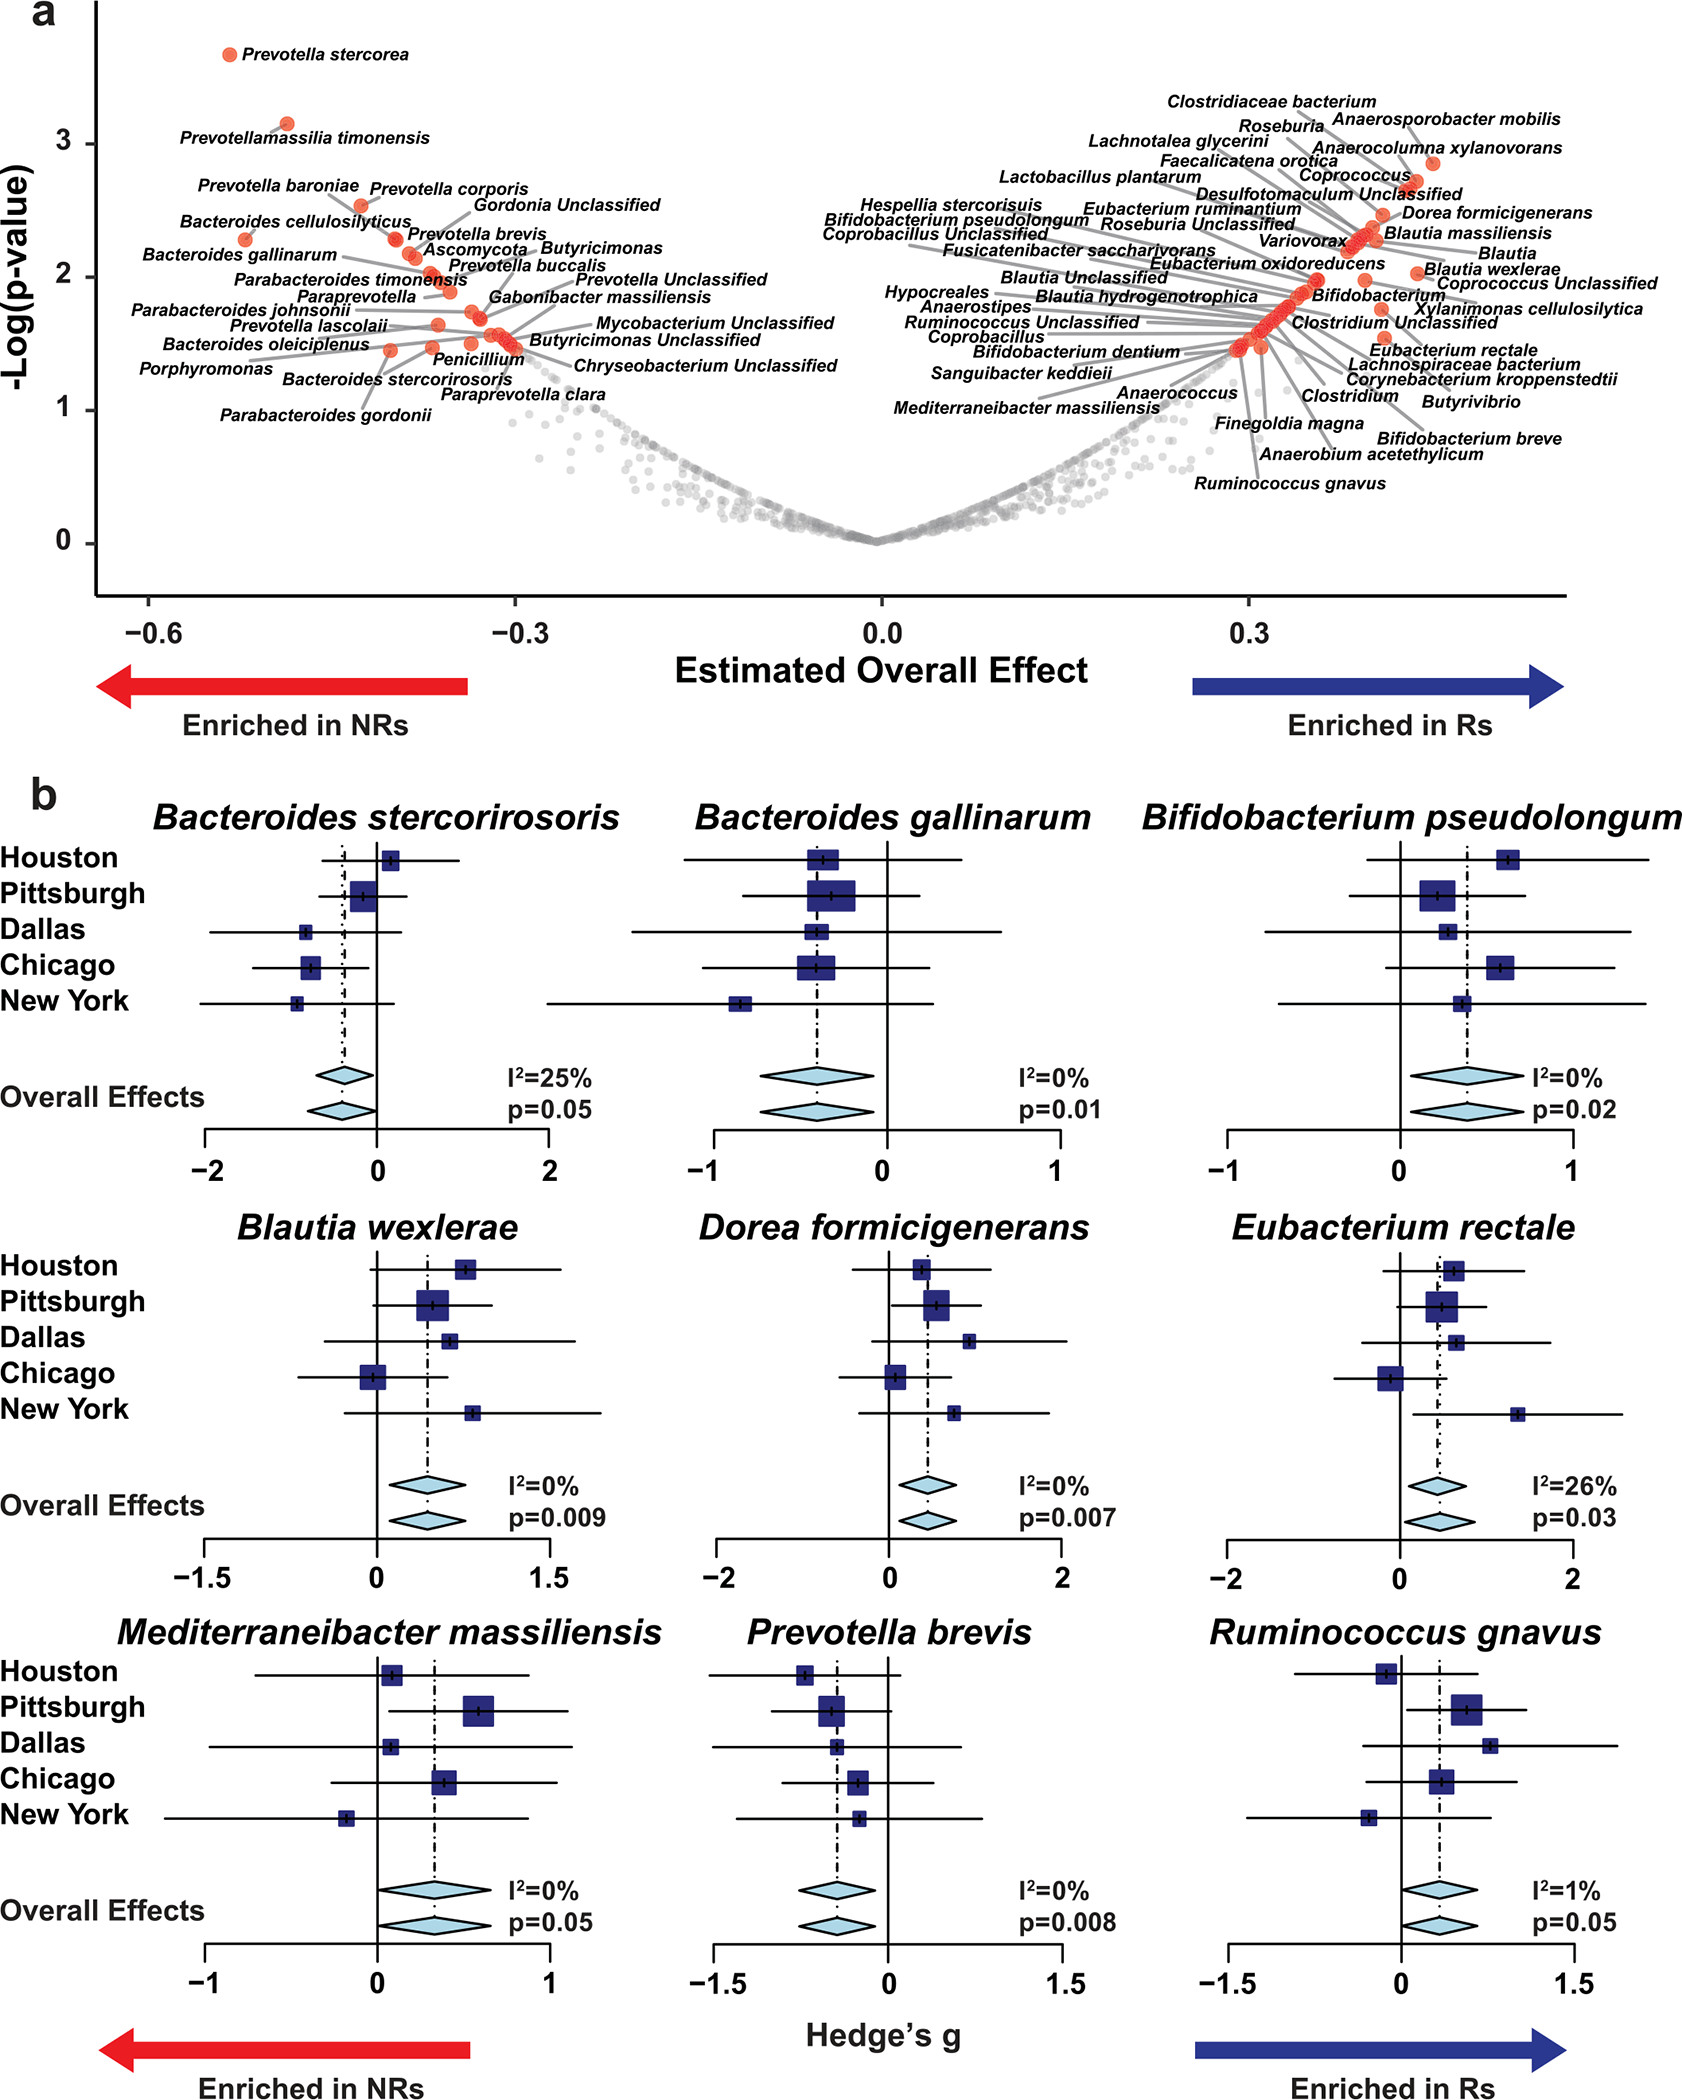
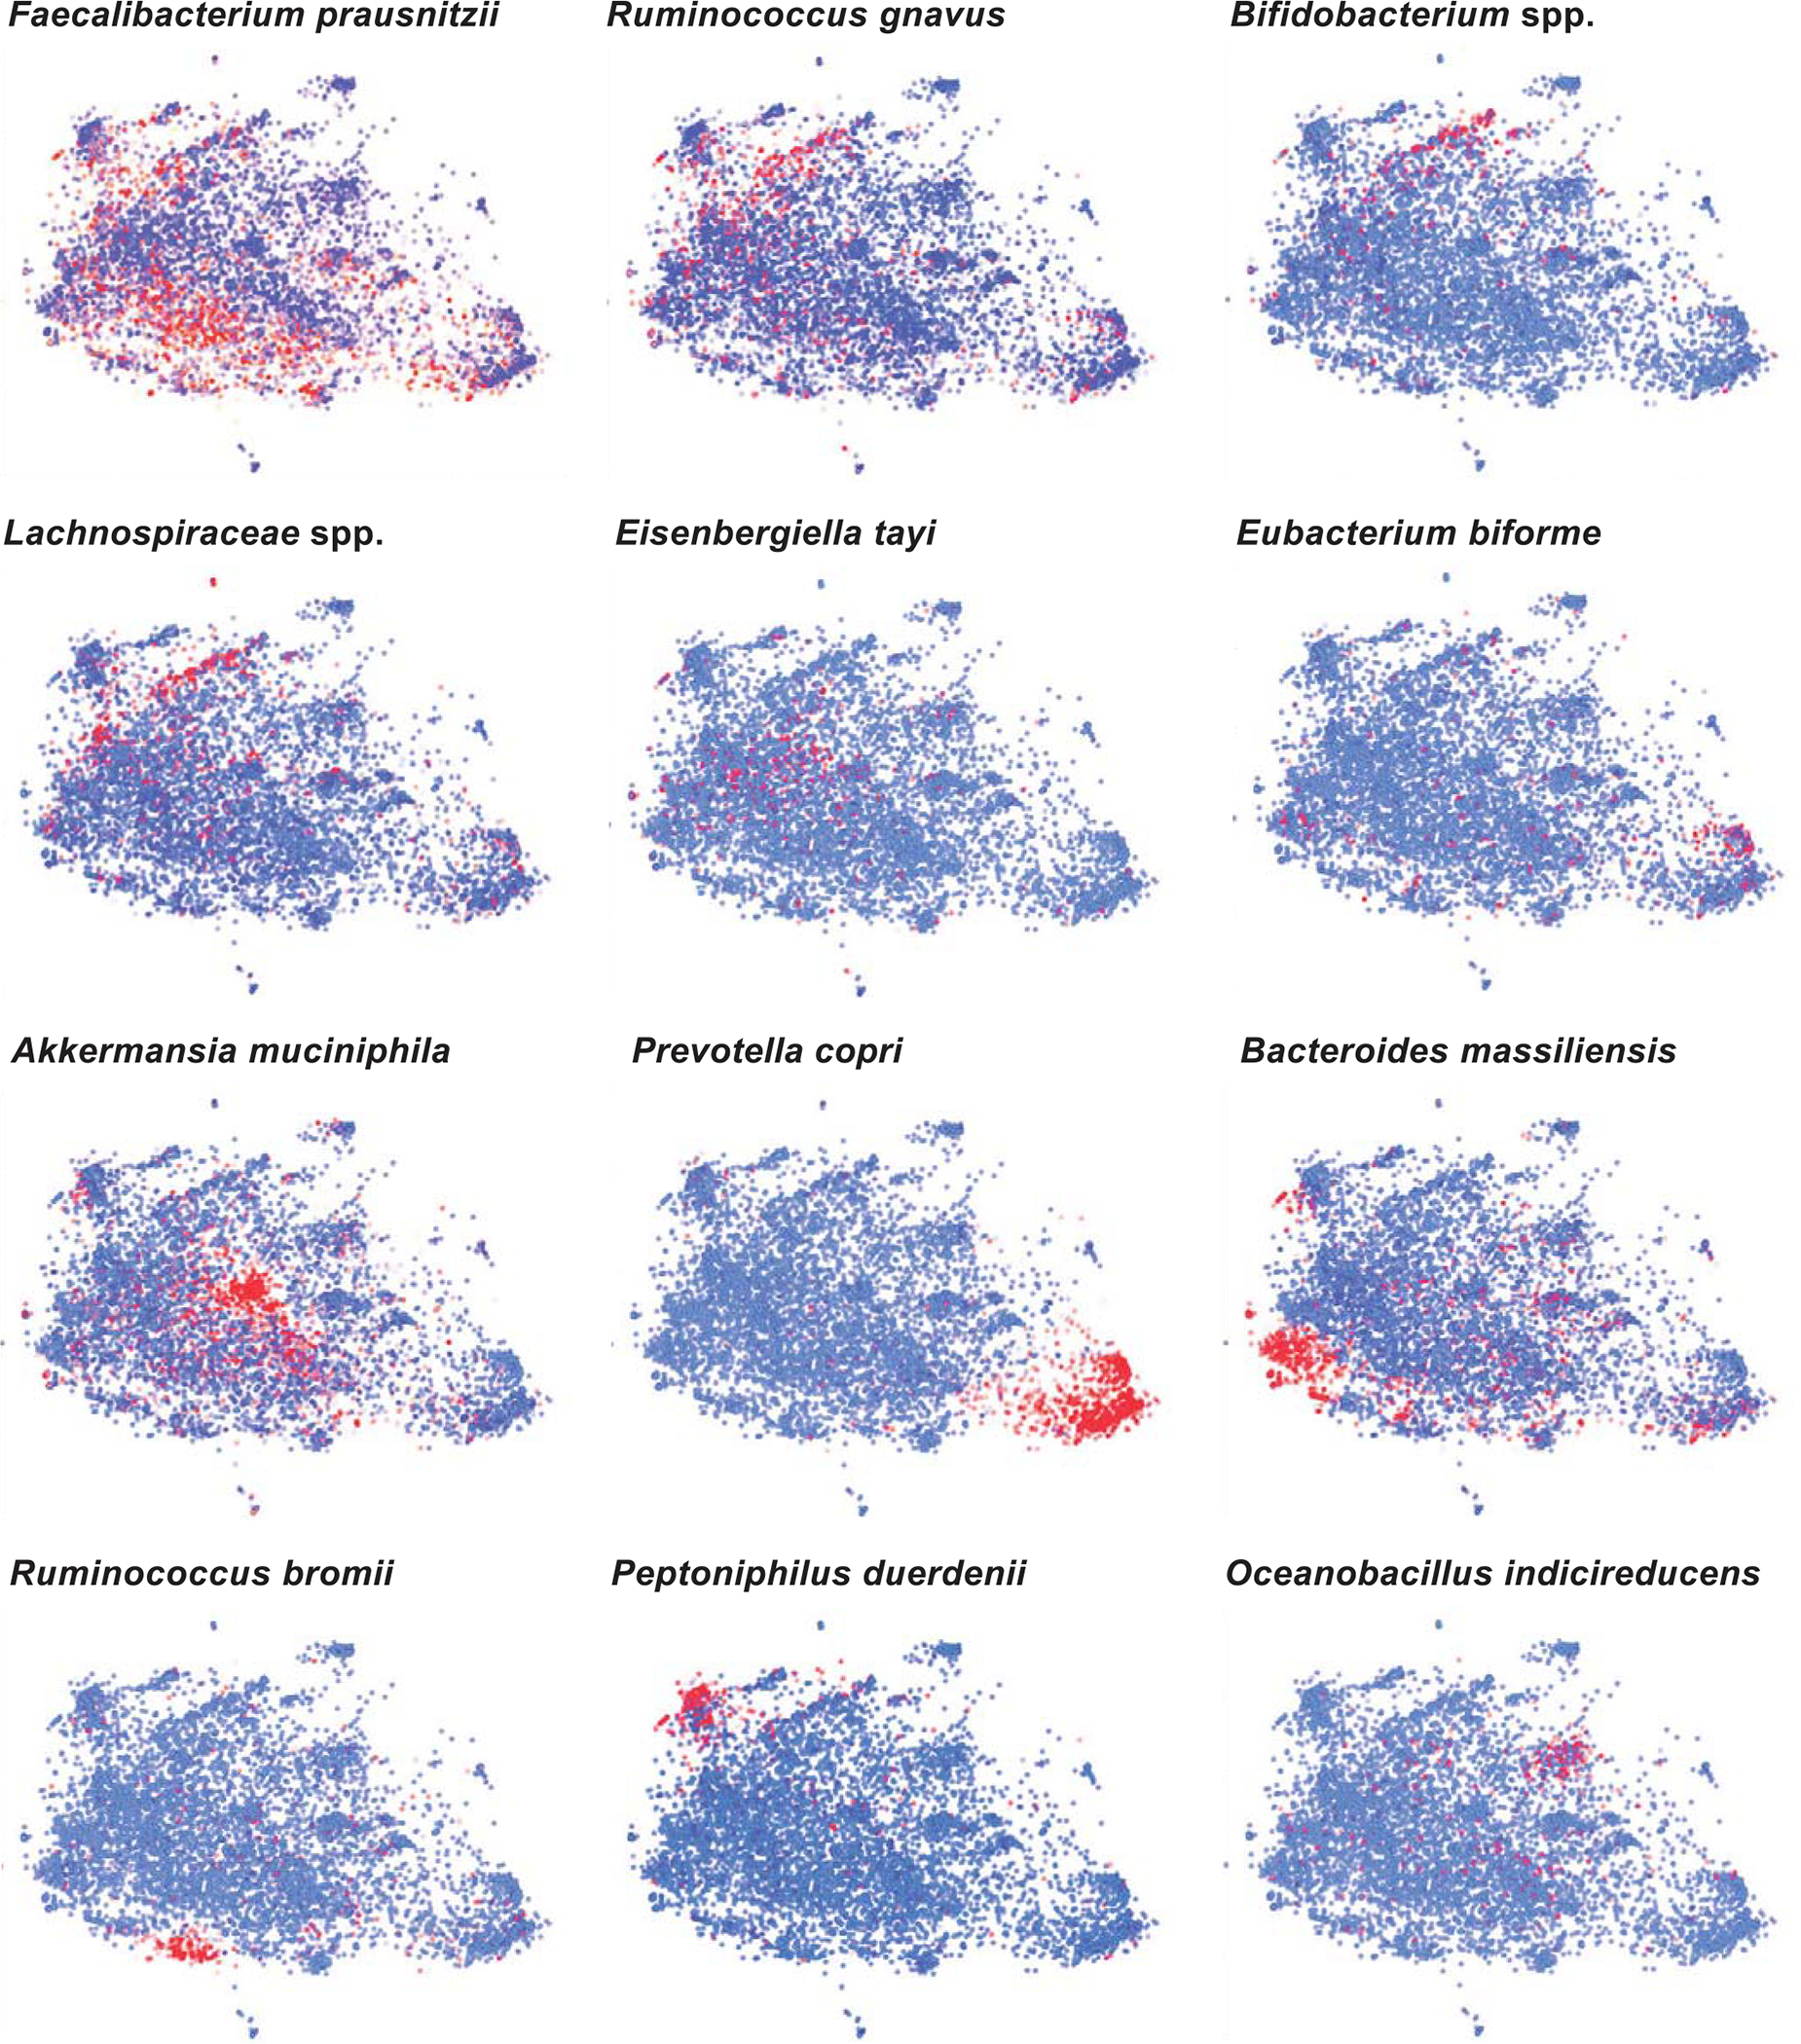
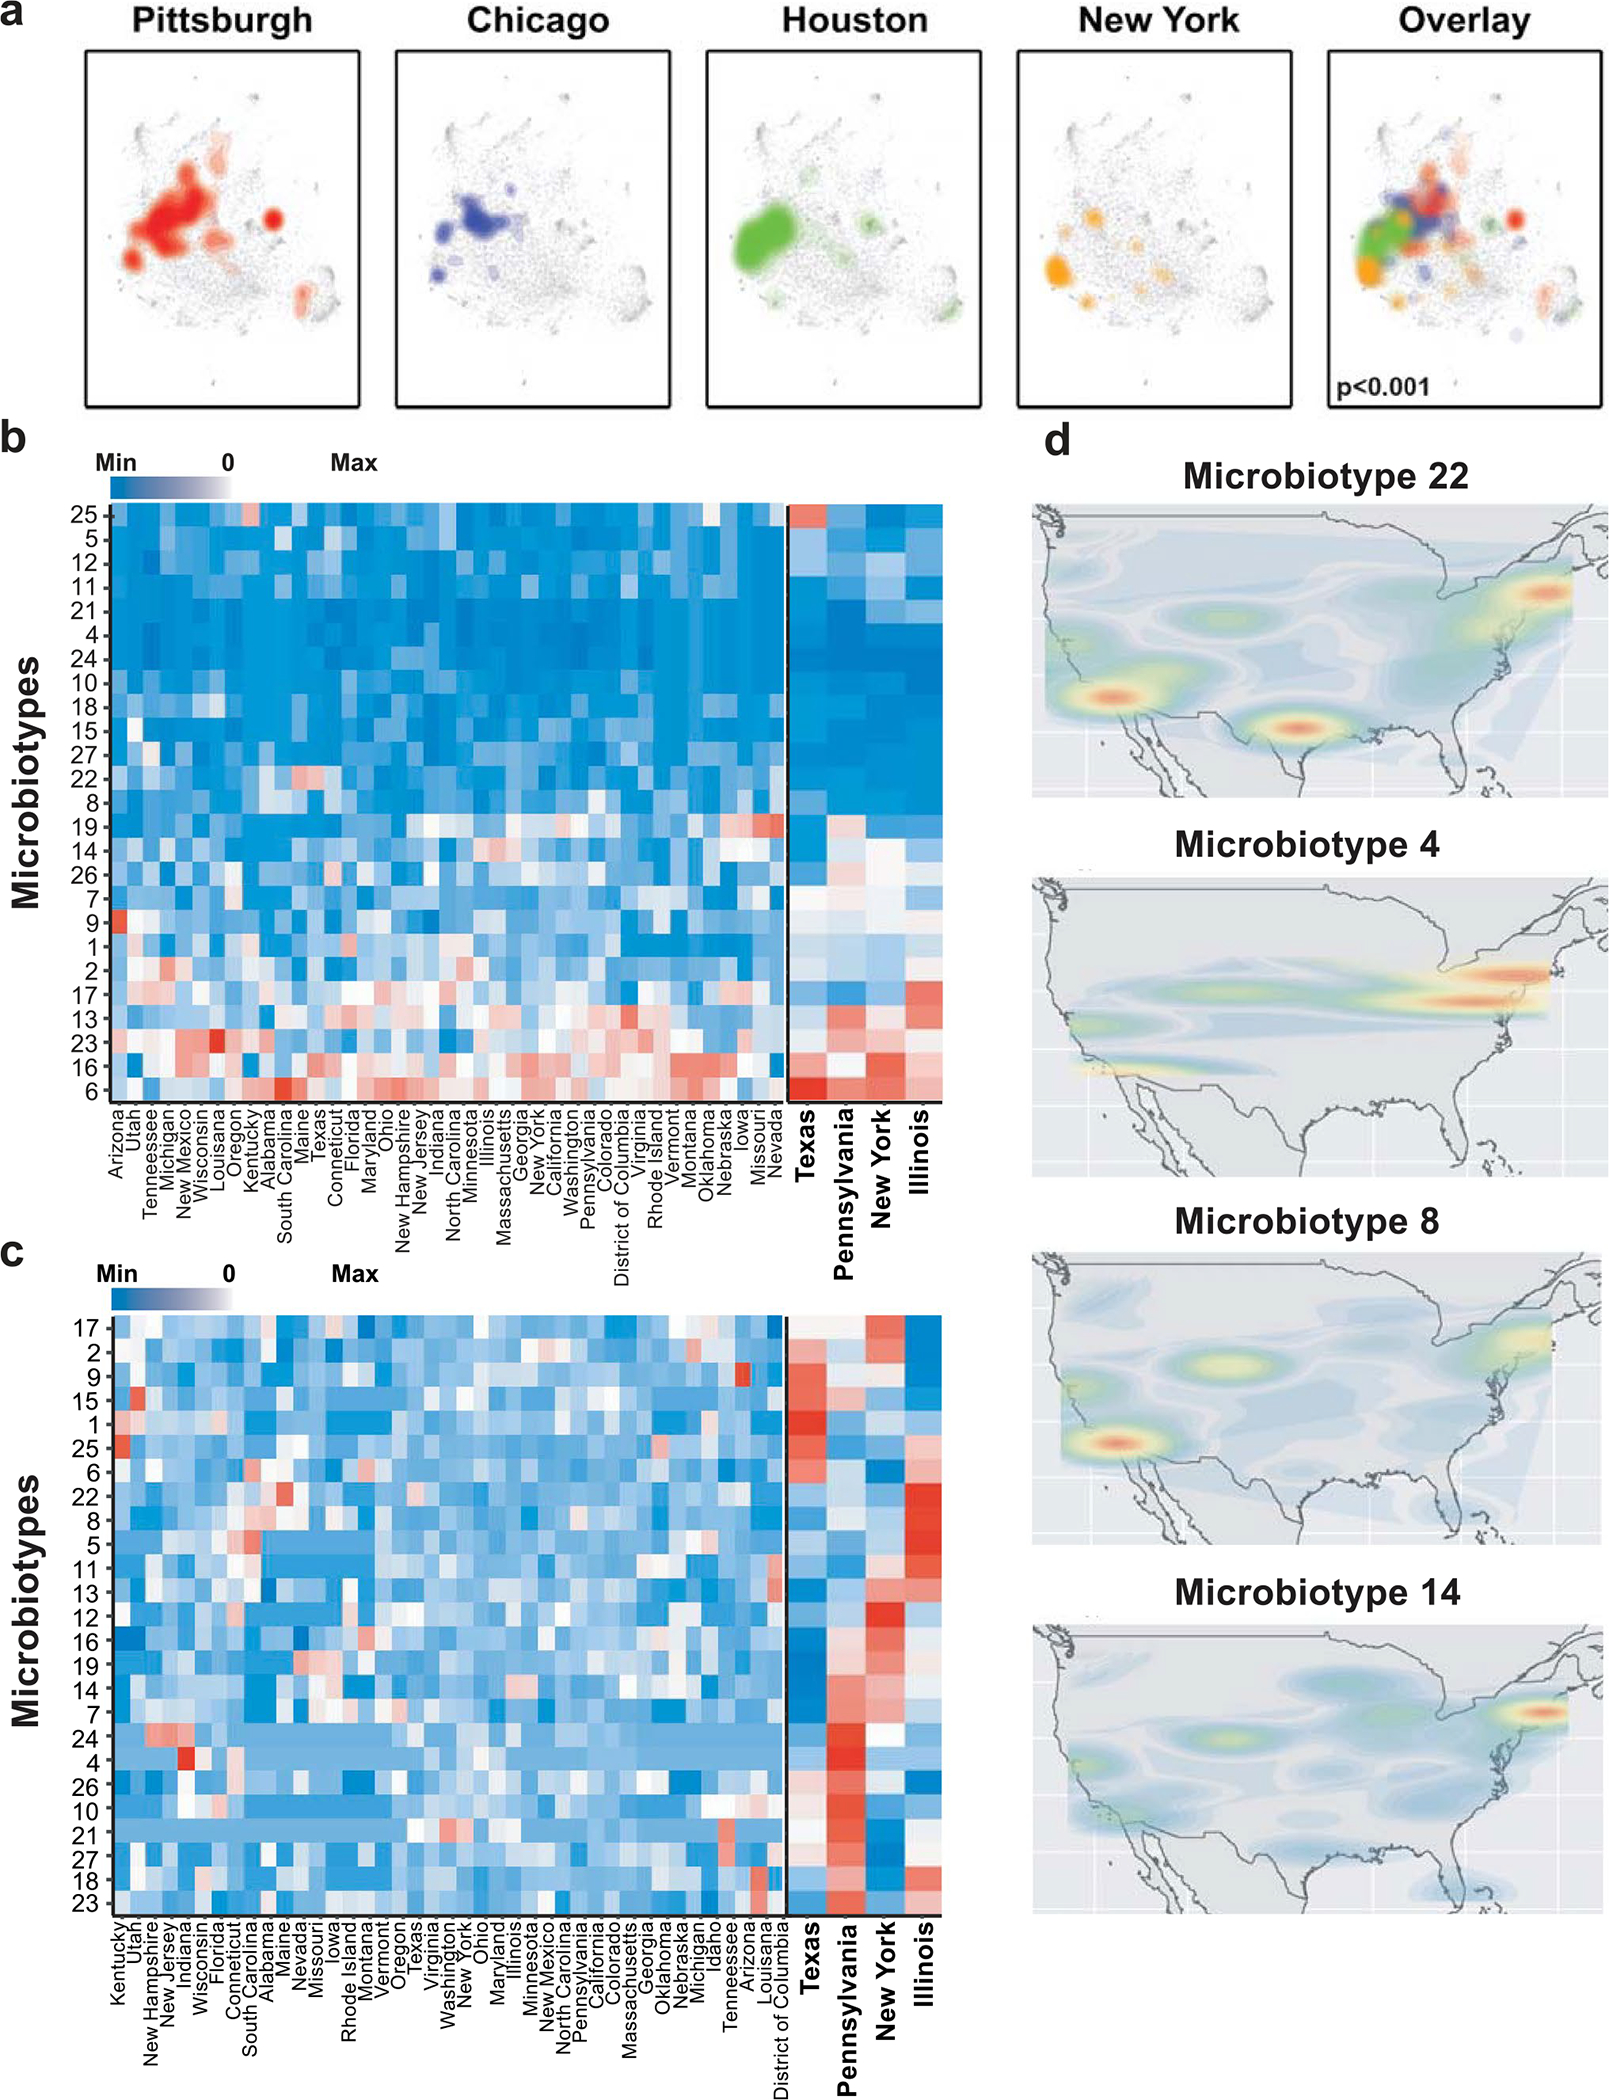
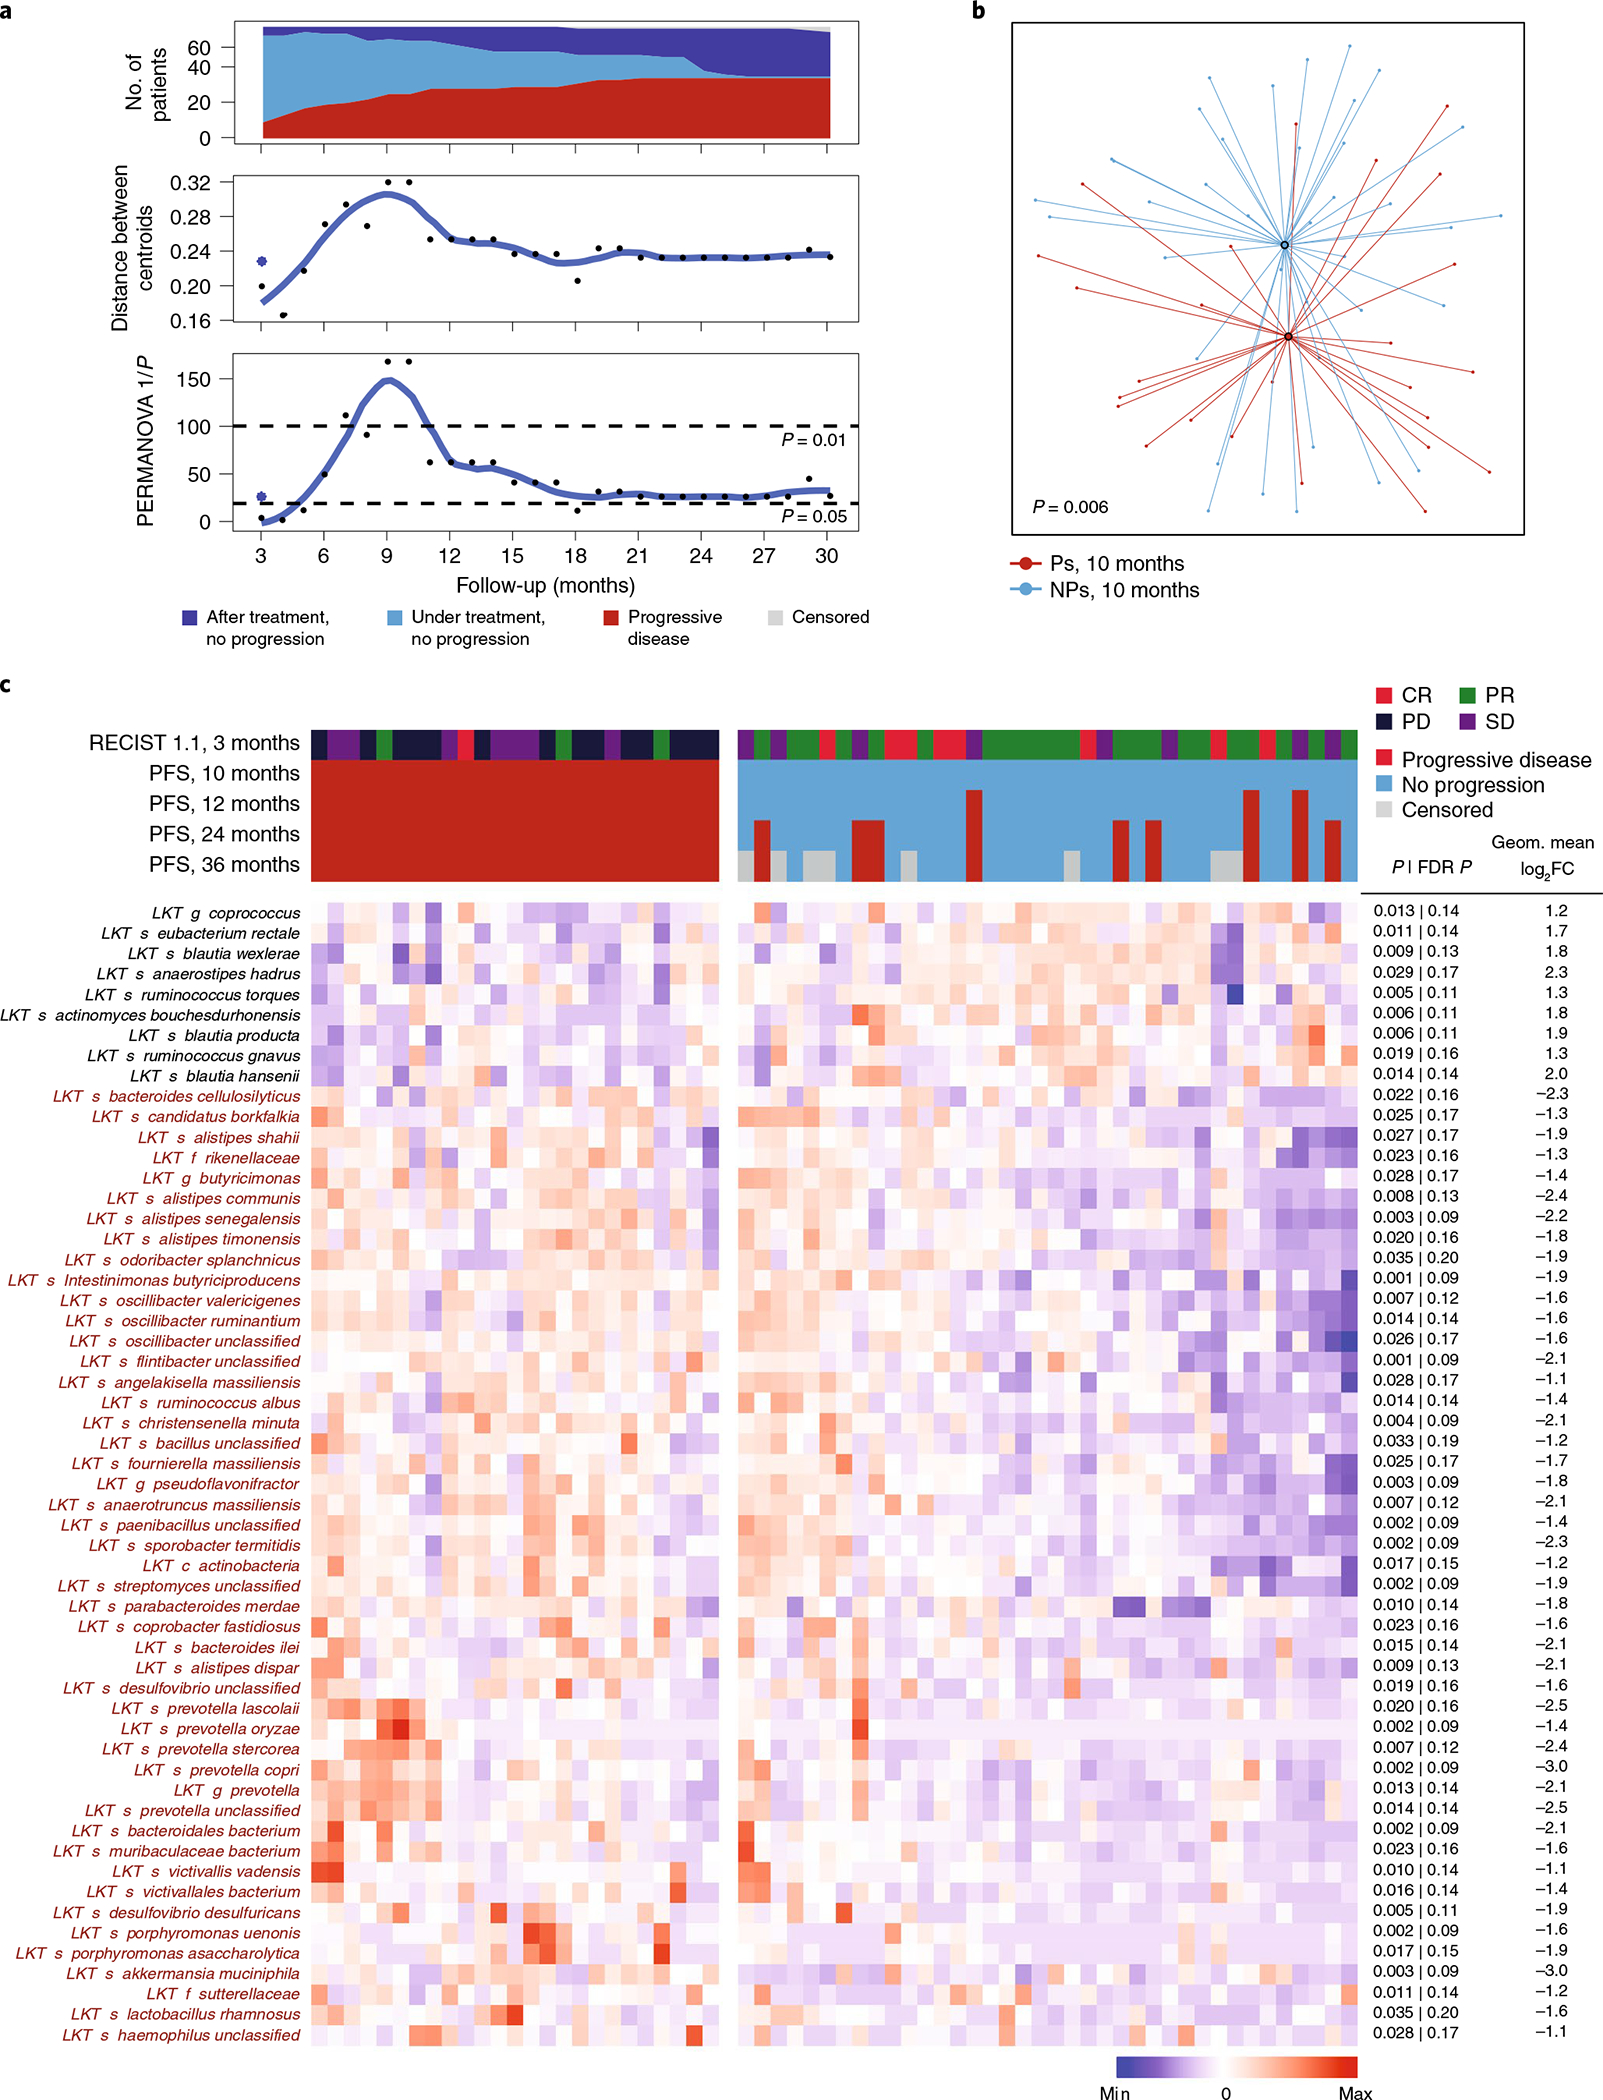
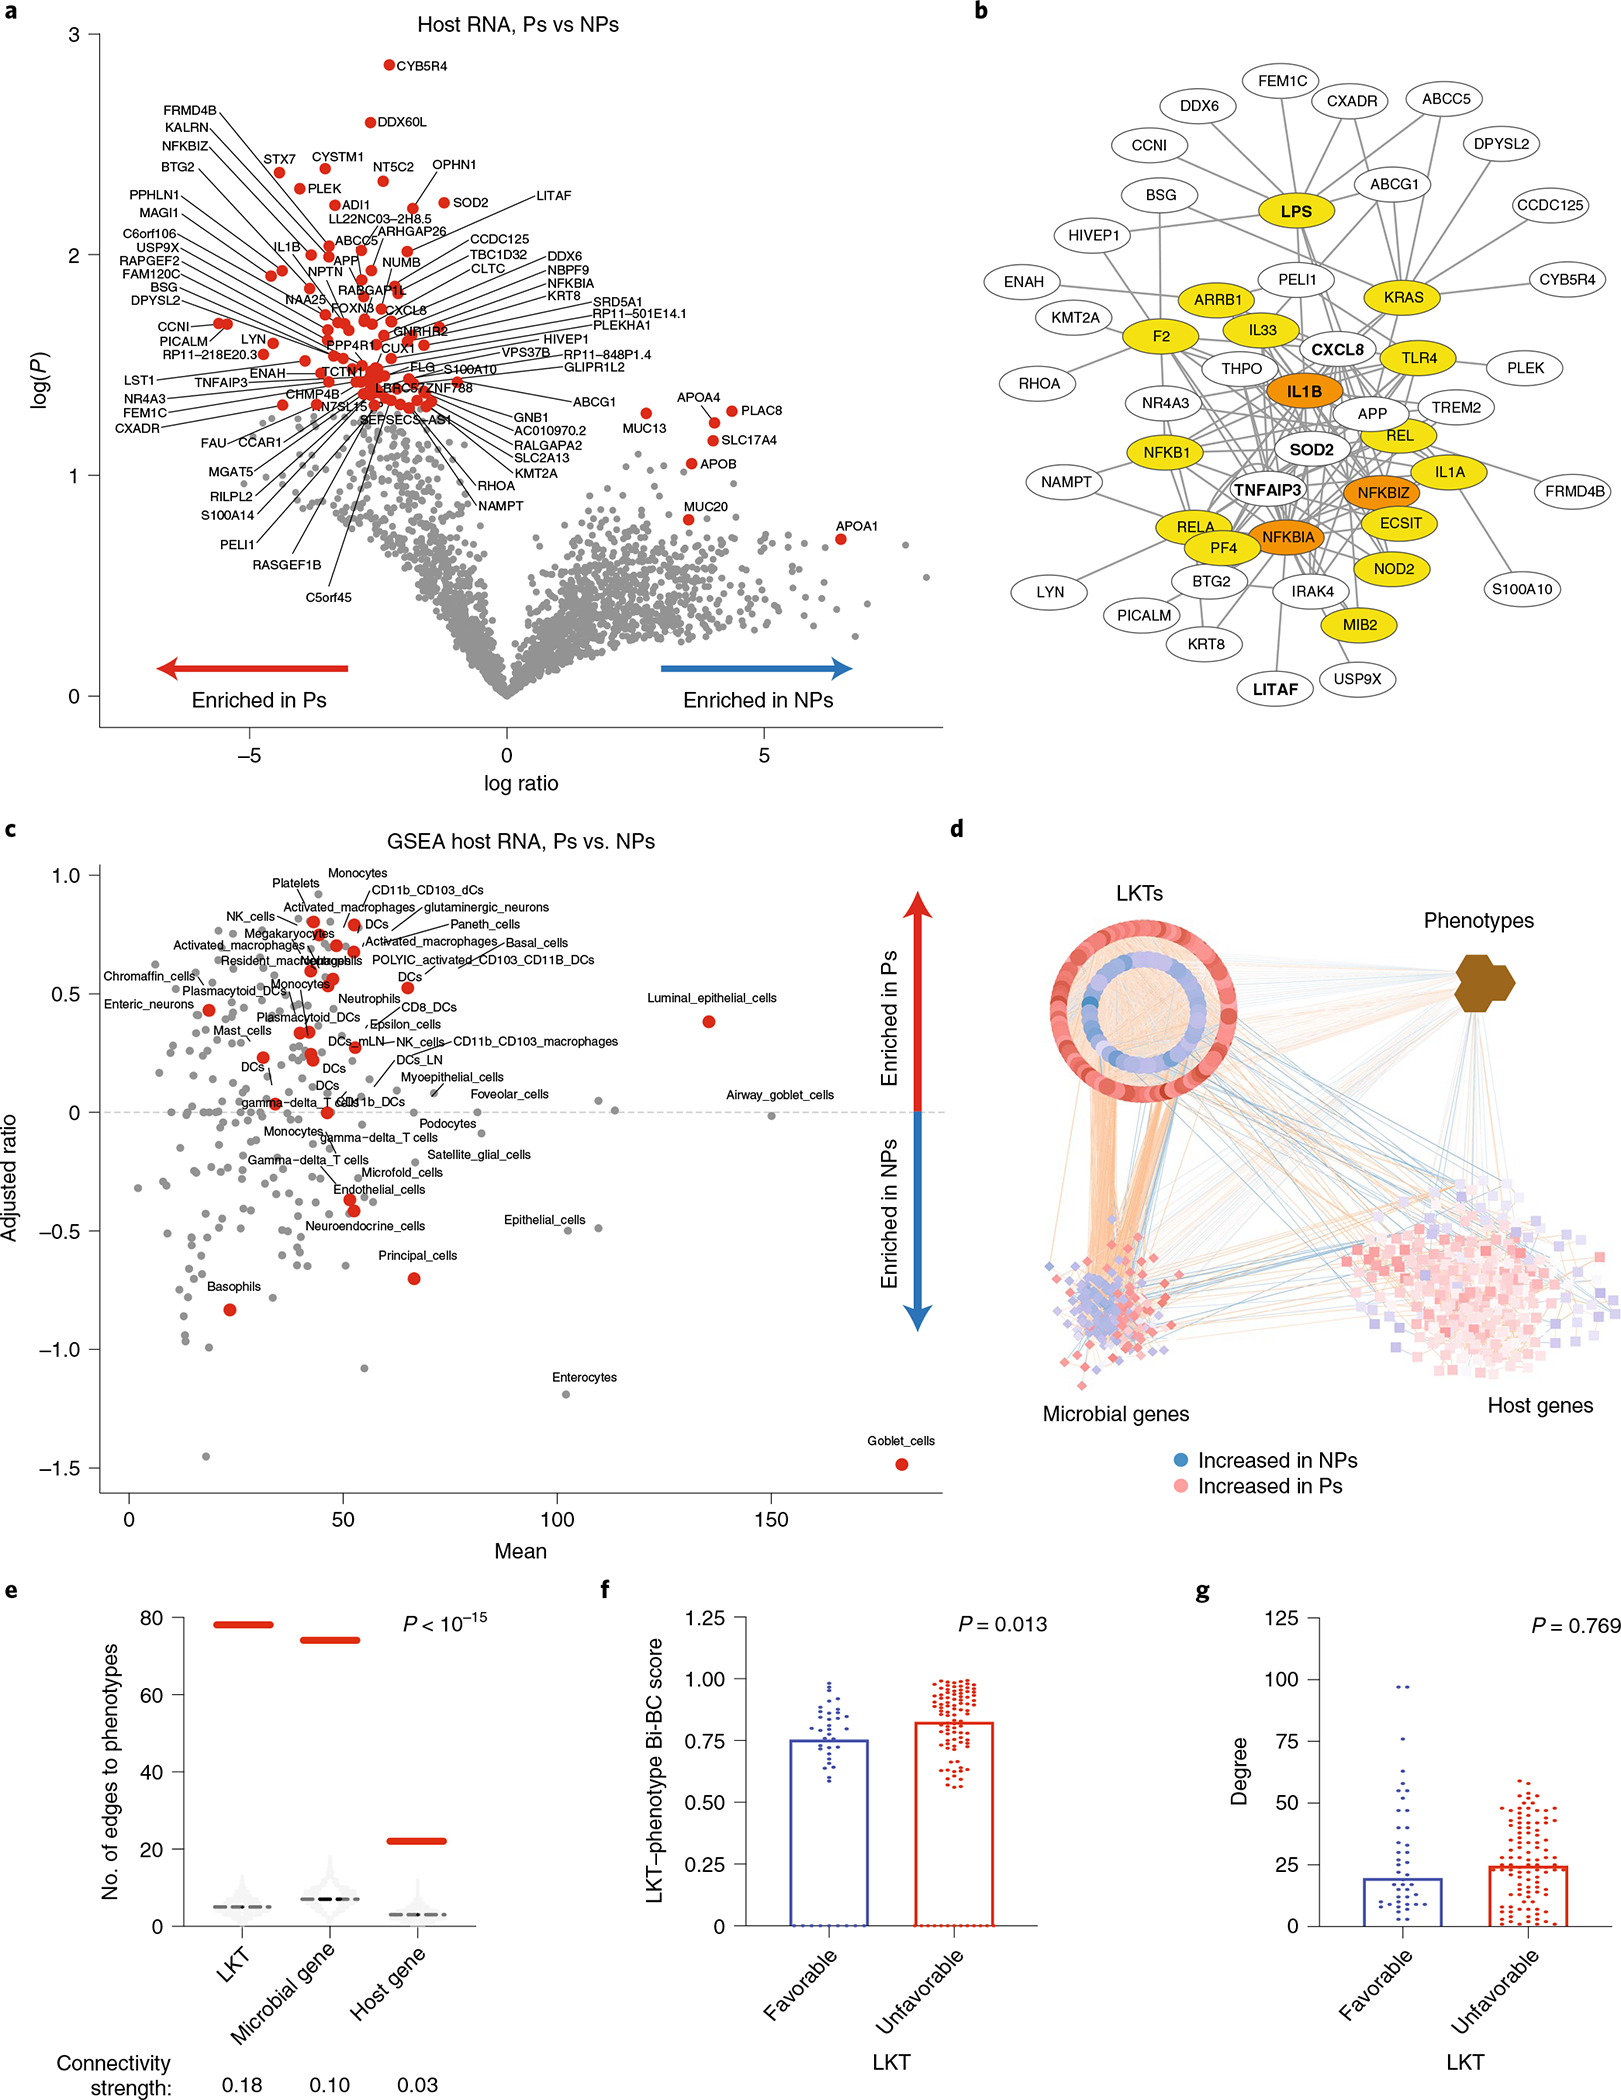
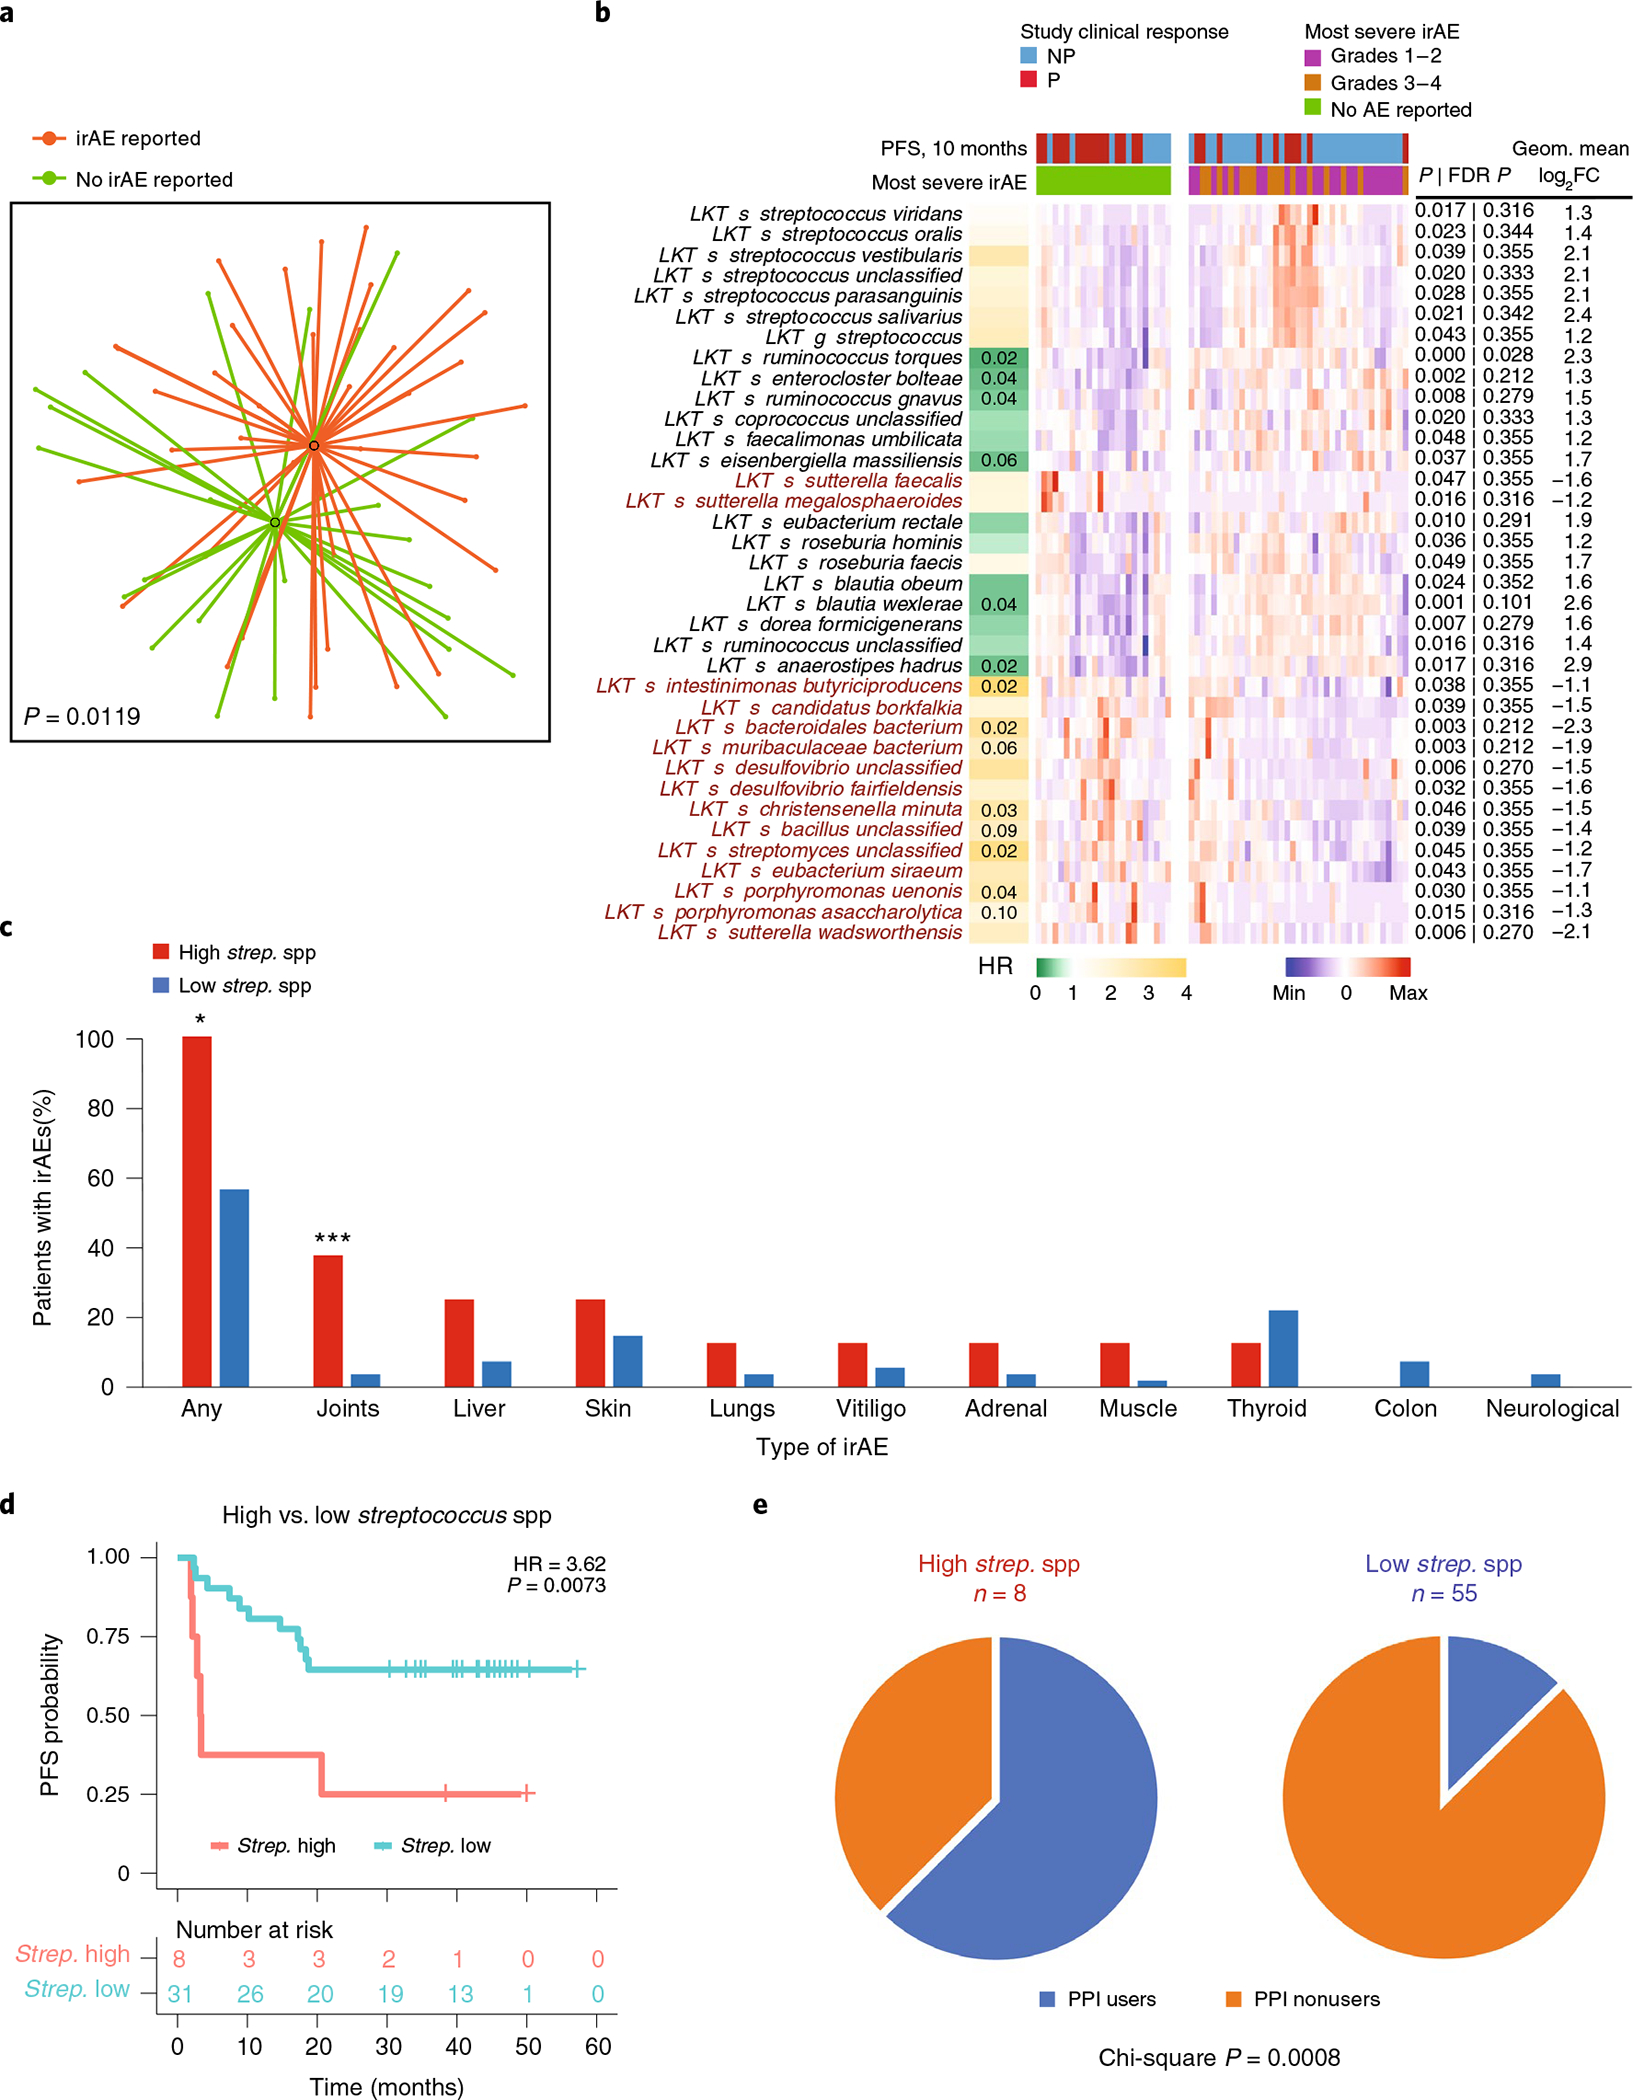
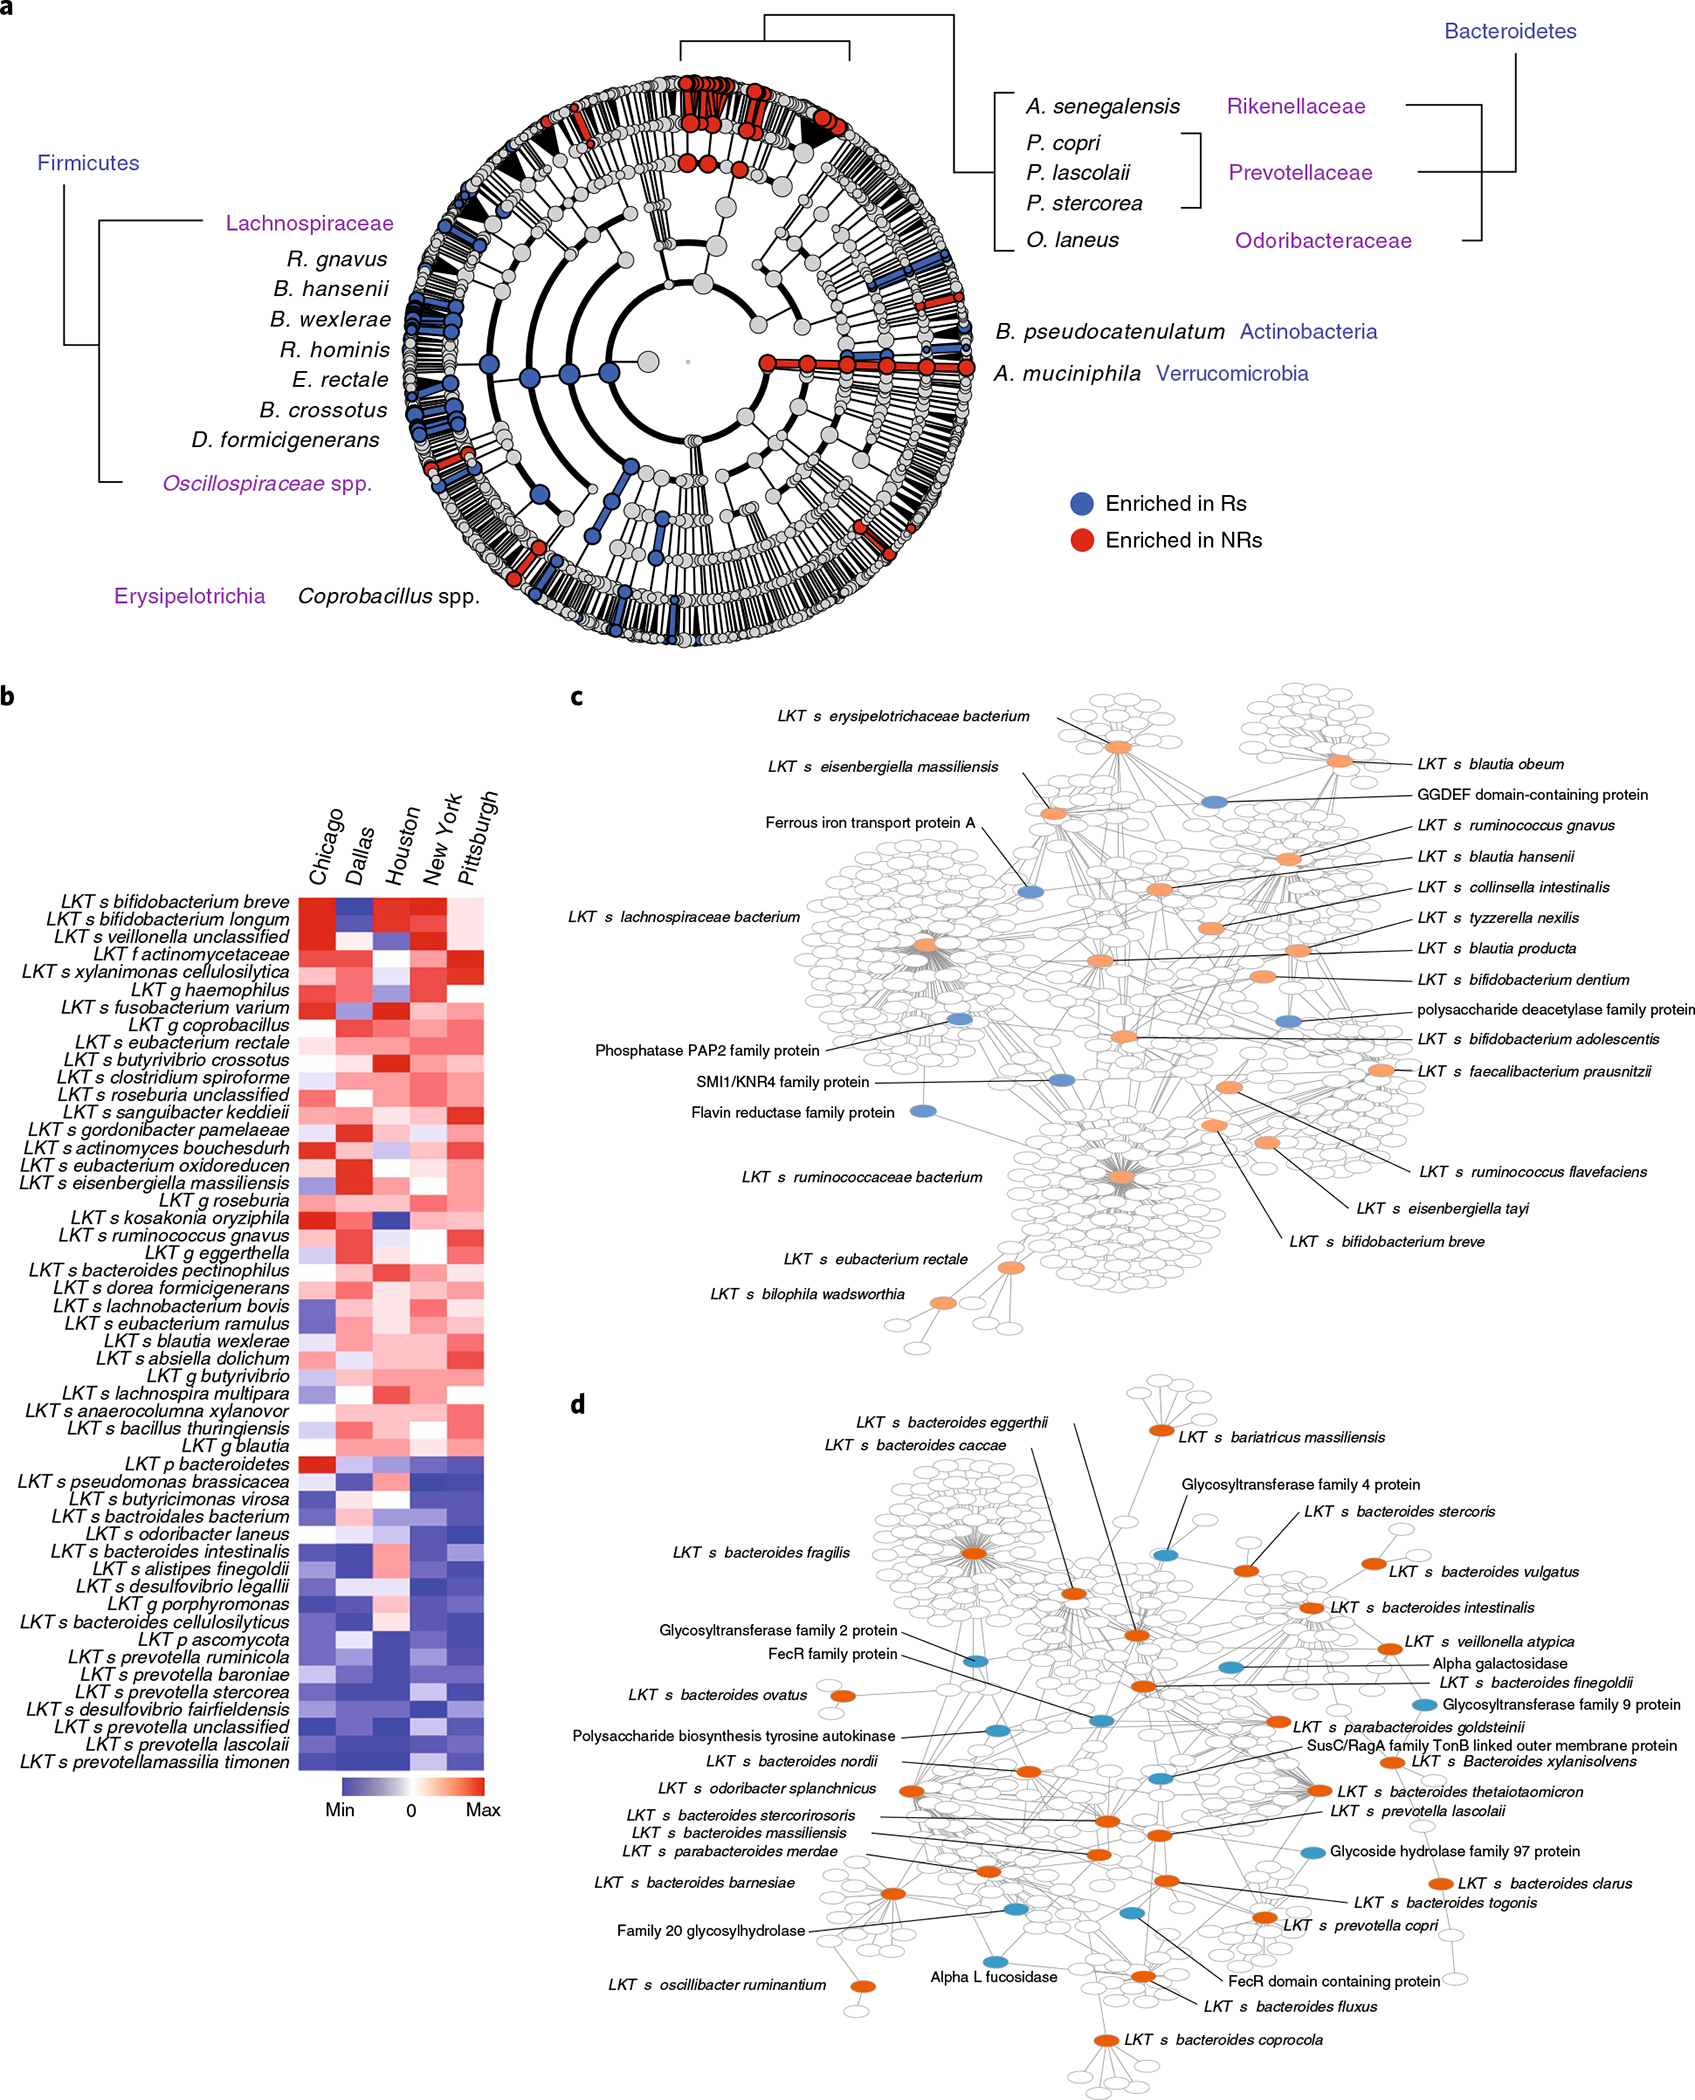
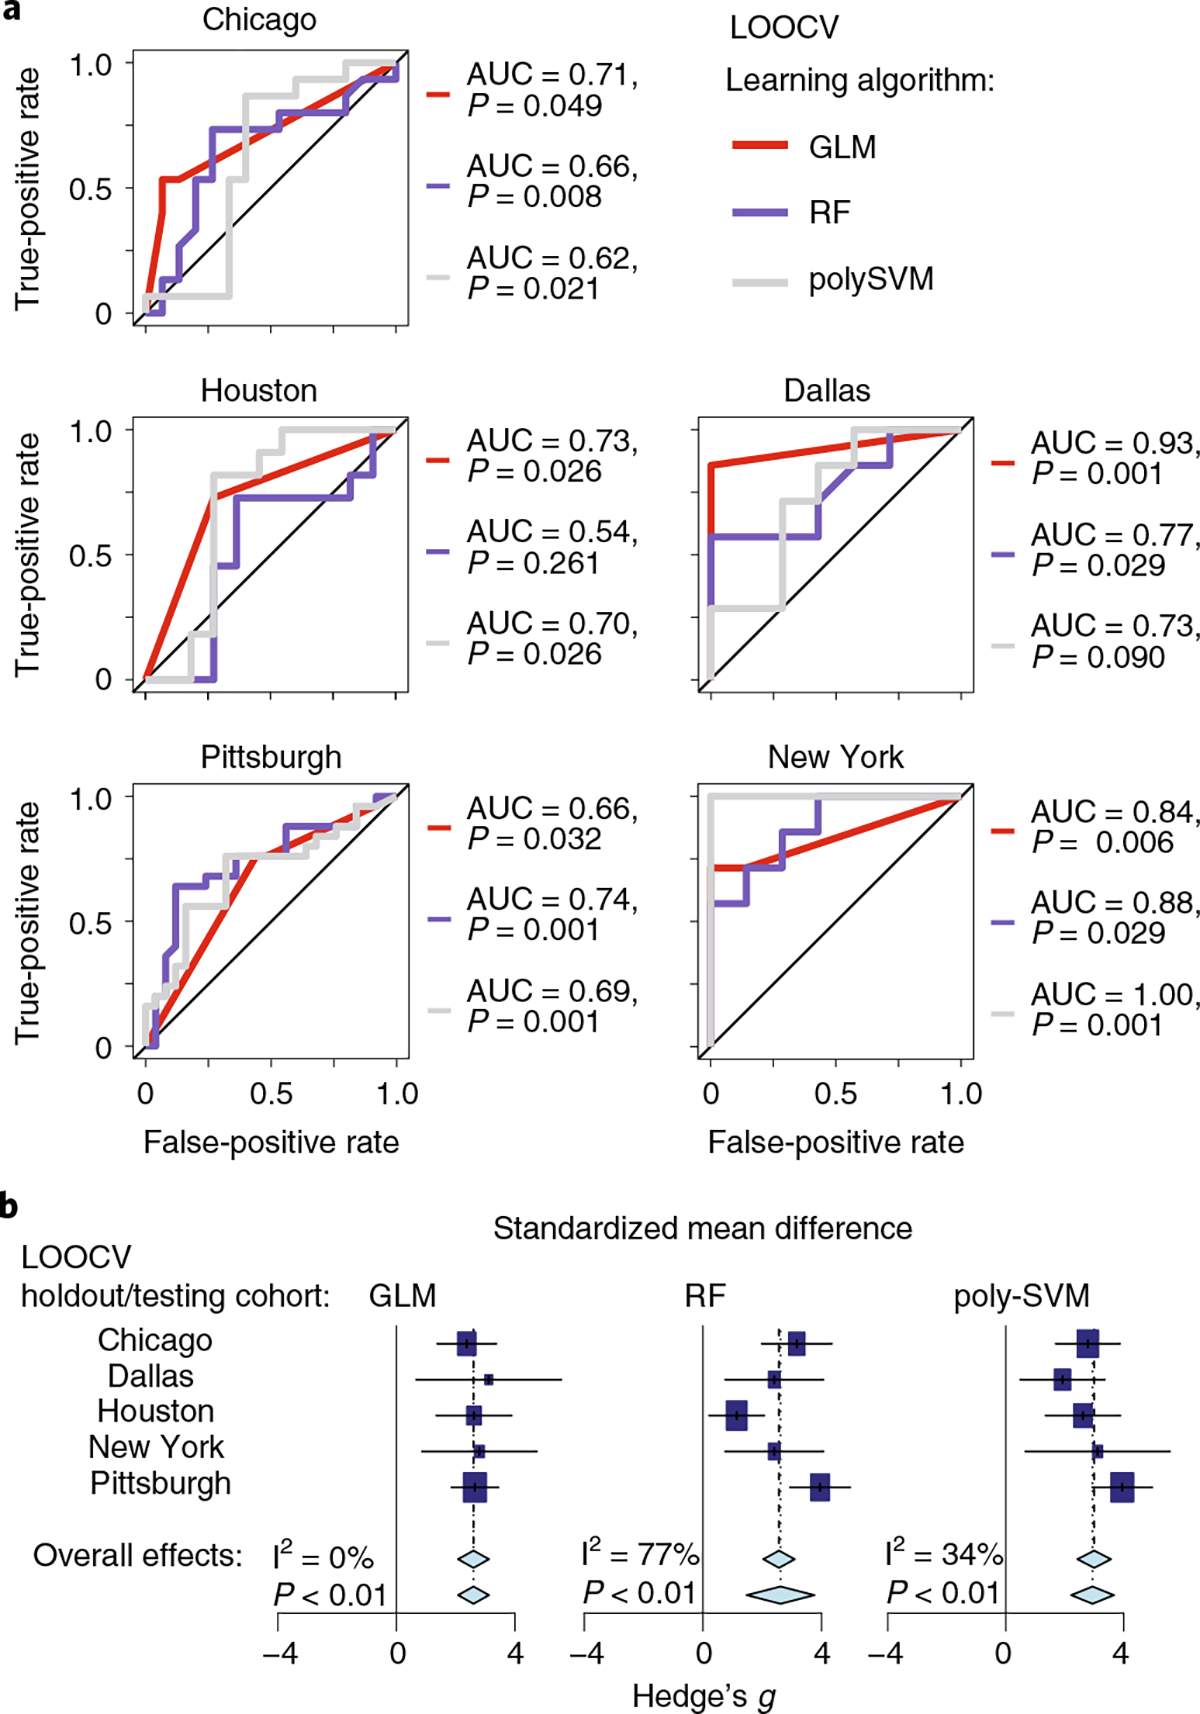
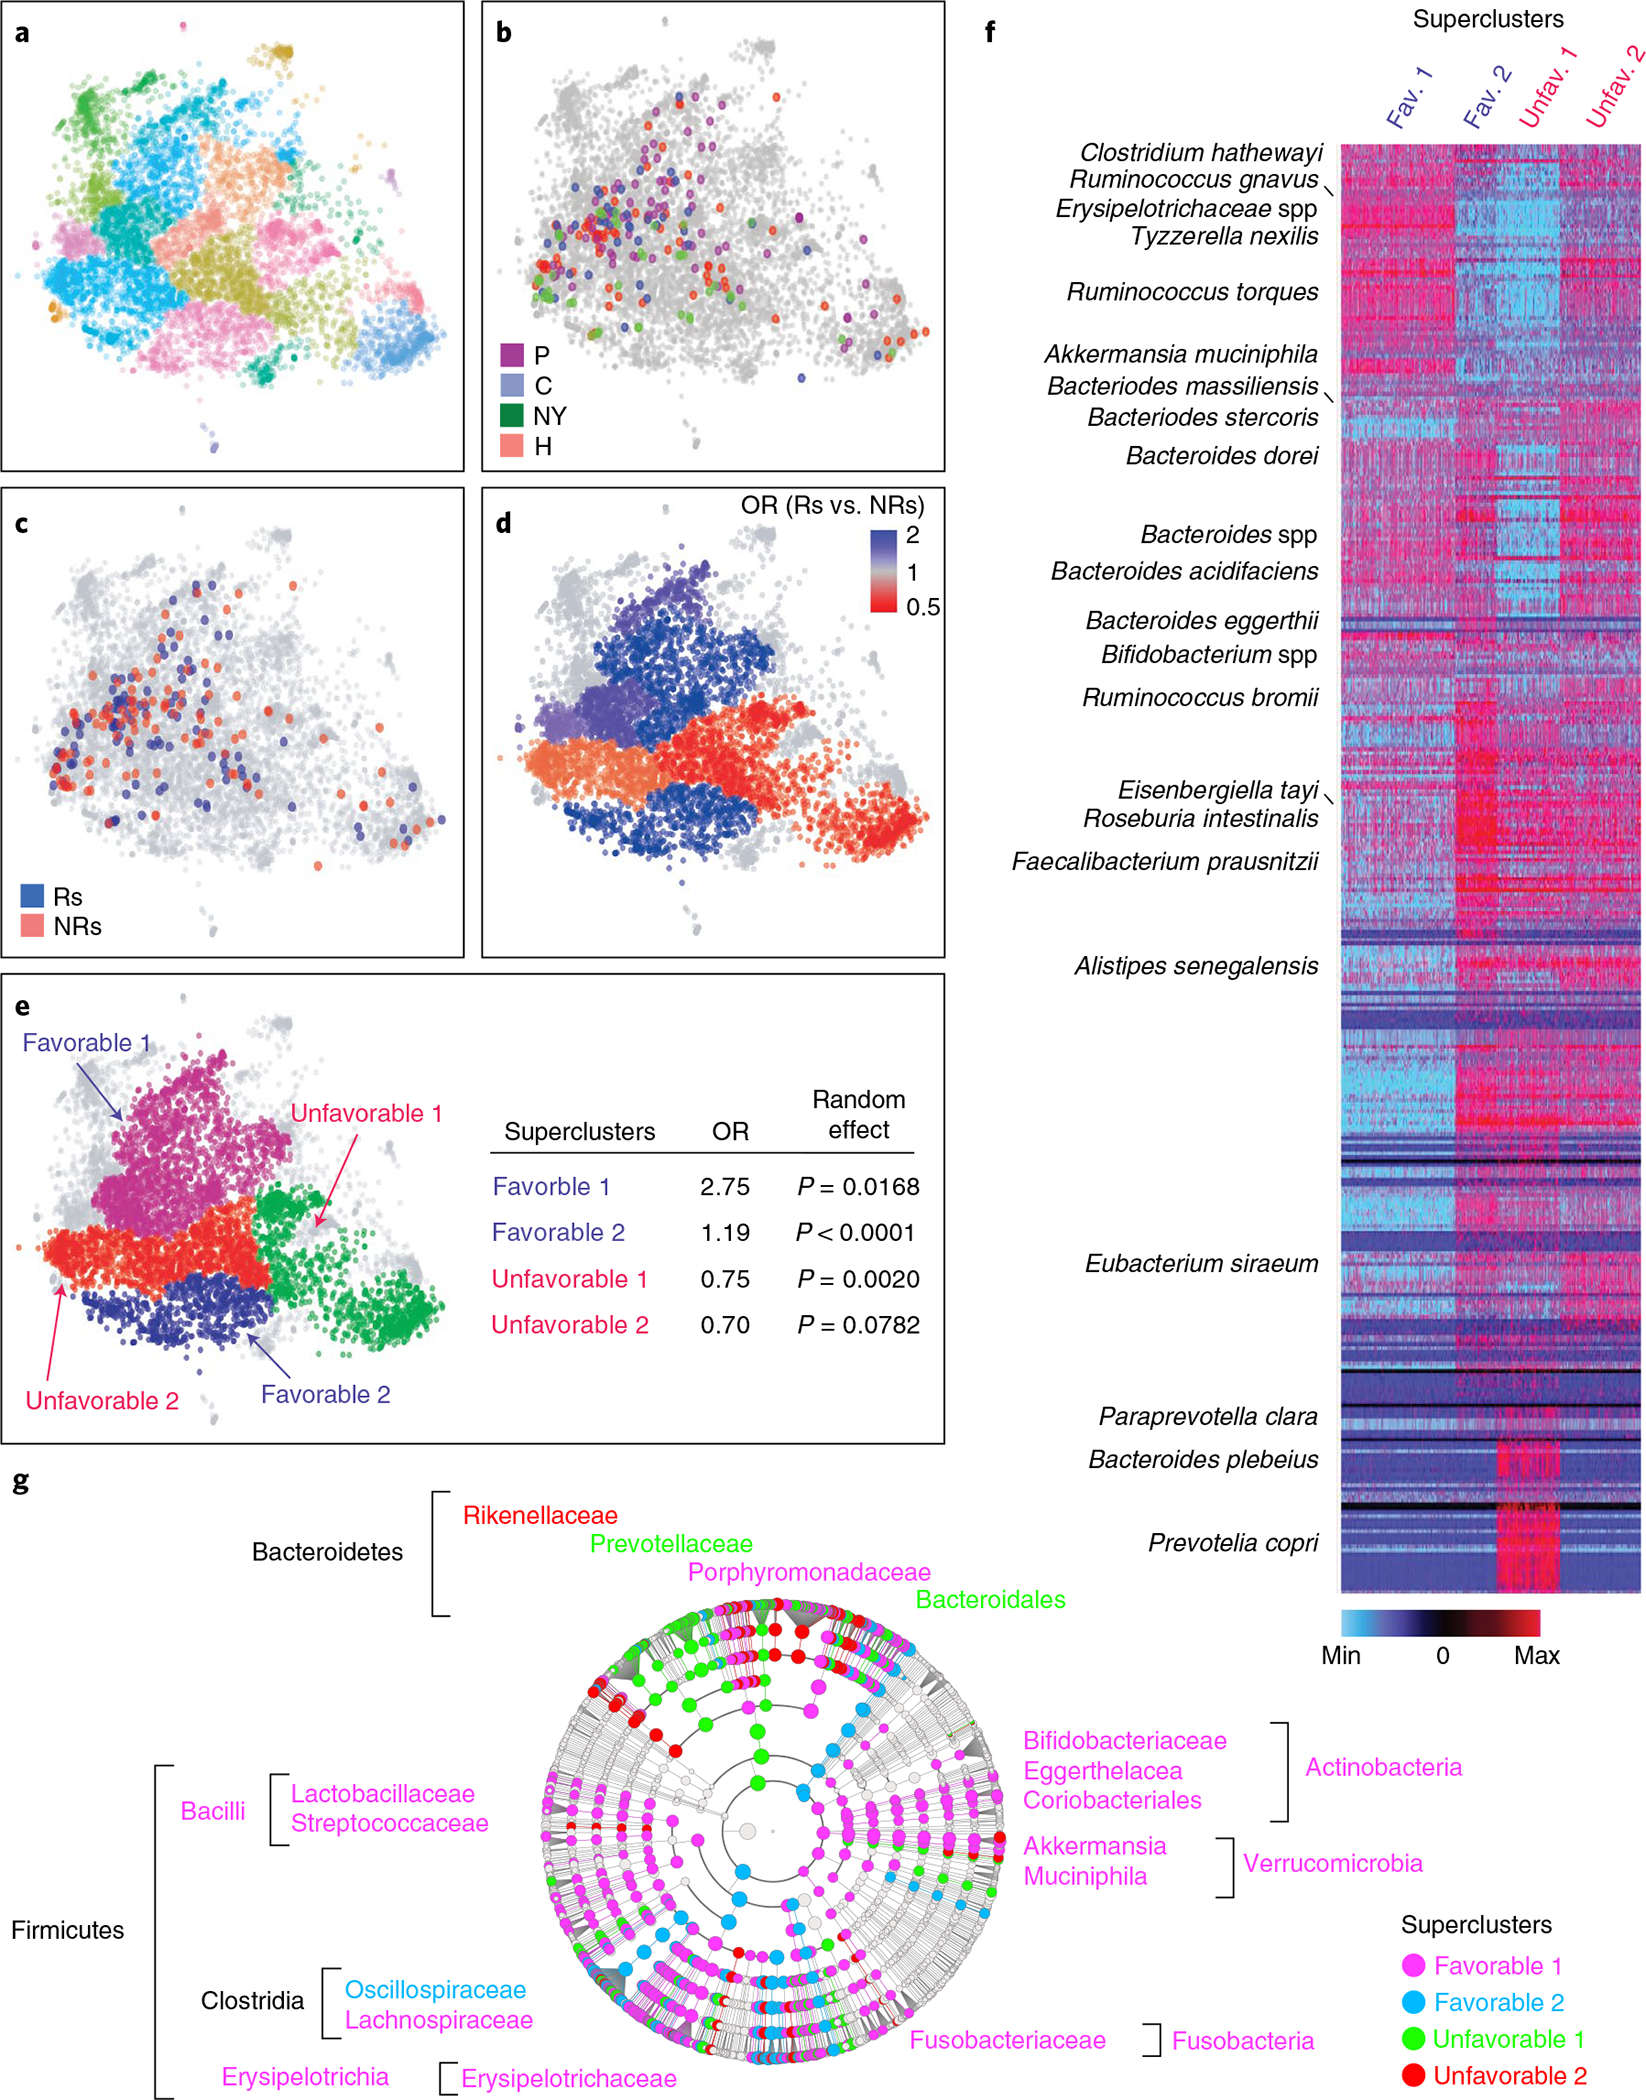
Ample evidence indicates that the gut microbiome is a tumor-extrinsic factor associated with antitumor response to anti-programmed cell death protein-1 (PD-1) therapy, but inconsistencies exist between published microbial signatures associated with clinical outcomes. To resolve this, we evaluated a new melanoma cohort, along with four published datasets. Time-to-event analysis showed that baseline microbiota composition was optimally associated with clinical outcome at approximately 1 year after initiation of treatment. Meta-analysis and other bioinformatic analyses of the combined data show that bacteria associated with favorable response are confined within the Actinobacteria phylum and the Lachnospiraceae/Ruminococcaceae families of Firmicutes. Conversely, Gram-negative bacteria were associated with an inflammatory host intestinal gene signature, increased blood neutrophil-to-lymphocyte ratio, and unfavorable outcome. Two microbial signatures, enriched for Lachnospiraceae spp. and Streptococcaceae spp., were associated with favorable and unfavorable clinical response, respectively, and with distinct immune-related adverse effects. Despite between-cohort heterogeneity, optimized all-minus-one supervised learning algorithms trained on batch-corrected microbiome data consistently predicted outcomes to programmed cell death protein-1 therapy in all cohorts. Gut microbial communities (microbiotypes) with nonuniform geographical distribution were associated with favorable and unfavorable outcomes, contributing to discrepancies between cohorts. Our findings shed new light on the complex interaction between the gut microbiome and response to cancer immunotherapy, providing a roadmap for future studies.


Conflict of interest statement

Competing interests

D.D. reports the following disclosures: Arcus, Bristol-Myers Squibb, Checkmate Pharmaceuticals, CellSight Technologies, Merck, GlaxoSmithKline/Tesaro (research support); Array Biopharma, Checkmate Pharmaceuticals, Finch, Incyte, Immunocore, Merck; Shionogi (consulting); and Vedanta Biosciences (scientific advisory board). H.M.Z. reports the following disclosures: Bristol-Myers Squibb, Checkmate Pharmaceuticals, GlaxoSmithKline (research support); Bristol-Myers Squibb, Checkmate Pharmaceuticals, GlaxoSmithKline, Vedanta (consulting). D.D., H.M.Z., J.A.M., R.R.R., G.T. and A.K.D. are inventors on a patent application (US patent no. 63/208,719) submitted by the University of Pittsburgh that covers methods to enhance checkpoint blockade therapy by the microbiome. The other authors declare no competing interests.

Figures

Extended Data Fig. 1 |
Extended Data Fig. 1 |. Kaplan-Meier plots of progression-free survival and overall survival in the Pittsburgh early sample cohort and progression-free survival after dichotomization for abundance of select bacterial species.
a and b. Kaplan-Meier plots of probability of progression-free survival (PFS) (a) and overall survival (OS) (b) of PD-1-treated Pittsburgh early cohort melanoma patients. Vertical ticks show censored data. Central line is median OS or PFS probability, shaded area shows 95% confidence interval. c. Optimal cutpoints of bacterial abundance determined using Evaluate Cutpoints. Different plots show the effect on PFS of abundance (high vs. low) of the top four most significantly increased (left) and decreased (right) individual bacterial species in non-progressors at 10 months, determined using Mann-Whitney U test (Fig. 1c). Number of people at risk in in either group (high vs. low abundance) is shown below each panel. Vertical ticks show censored data. Hazard Ratio (HR) and score (logrank) test two-tailed p-value from Cox proportional hazards regression analysis.
Extended Data Fig. 2 |
Extended Data Fig. 2 |. Microbiota composition of non-progressing patients in the Pittsburgh cohort whose stool samples were collected 4–41 months after initiation of therapy is not predictive of late therapy failure but is enriched for similar bacterial taxa as observed in the initial microbiome of patients who did not progress at 10 months.
a. Plot of time of stool sample acquisition from 31 patients whose samples were collected after >4 months from therapy initiation. b. Progressor (P) and non-progressor (NP) groups identified at serial timepoints after late stool collection (top panel) were used to calculate the significance (two-tailed p-value) of compositional differences of the late-collected fecal microbiome using PERMANOVA (bottom panel). Fecal microbiota composition was determined using metagenomic sequencing. Progression during continued therapy was evaluated using RECIST v1.1 every 3 months or by clinical observation during follow-up visits. Number of patients on follow-up at each timepoint in relation to response status is shown in top panel. c. t-distributed uniform manifold approximation and projection (t-UMAP) plot depicts fecal microbiota compositional differences between early-collected patients who progressed (red) or did not progress (blue) in the first 10 months after initiation of therapy and late-collected long-term responders (green). Distance between centroids calculated as described in Fig. 1a, and significance (two-tailed p-value) of the differences by PERMANOVA are shown in lower table. d. Heatmap shows differentially abundant taxa (p < 0.05 and FC > 2) between the late Pittsburgh cohort compared with Ps (top) and NPs (bottom) at 10 months from the early Pittsburgh cohort. Columns denote patients grouped by each cohort before clustering; rows denote bacterial taxa enriched (black) or depleted (red) in early-sampled P versus late-sampled long-term NP clustered based on microbiota composition. Two-tailed p-values were calculated using two-tailed Mann-Whitney U test. e. ROC curve for manual model trained on the organisms associated with increased and decreased PFS in the Pittsburgh cohort from Supplementary Tables 4 and 5. Note that the model predicts late Pittsburgh samples well even though they were not included in the data used in training.
Extended Data Fig. 3 |
Extended Data Fig. 3 |. Entire time-to-event progression data analysis by Cox regression method of baseline fecal microbiome composition identifies additional favorable and unfavorable taxa linked with response to anti-PD-1 immunotherapy.
a. Volcano plot depicting bacteria identified by effect on progression-free survival (PFS) in the Pittsburgh early sample cohort using Cox regression analysis in Evaluate Cutpoints software. Taxa with q < 0.05 are shown as red dots. b. Cladogram visualization (favorable taxa – blue; unfavorable taxa – red) of bacterial taxa at different phylogenetic levels identified using approach described in (a).
Extended Data Fig. 4 |
Extended Data Fig. 4 |. Differential abundance analysis reveals relationship of baseline gut microbial taxa with high vs. low neutrophil-lymphocyte ratio in Pittsburgh early sample cohort.
a. t-distributed uniform manifold approximation and projection (t-UMAP) plots depicting fecal microbiota compositional differences between patient groups with high (≥3.82; orange) and low (<3.82; green) pre-treatment neutrophil-lymphocyte ratio (NLR). Optimal cutoff for NLR (3.82) was determined by time serial PERMANOVA as shown in Fig. 1a. Two-tailed p-value was calculated using PERMANOVA. b. Heatmap of differentially abundant taxa (p < 0.05 and FC > 2) in high-pre-treatment NLR (orange) and low-NLR (green) patients, using optimal cutoff (3.82). Columns denote patients grouped by NLR status and clustered within each group; rows denote bacterial taxa enriched (red) in patients with high NLR clustered based on microbiota composition; no bacterial taxa significantly enriched in the low-NLR patients were identified. Statistical significance was calculated using two tailed Mann-Whitney U test. Bar plot to left of heatmap indicates extent of association between corresponding taxa and PFS probability [scaled hazard ratio (HR)] with Storey’s q-values <0.1 displayed within cells. Proportion of Gram-negative bacteria among those associated with high NLR was 58%, significantly higher than the average proportion of Gram-negative in patients’ fecal microbiome (28%, Chi-squared p = 0.0004).
Extended Data Fig. 5 |
Extended Data Fig. 5 |. Gut microbial gene differences discriminate between non-progressors and progressors during anti-PD-1 therapy in the Pittsburgh early sample cohort.
a. t-distributed uniform manifold approximation and projection (t-UMAP) plot depicting genetic differences of gut microbiomes between non-progressors (NPs; blue) and progressors (Ps; red) at time of maximal difference from start of therapy (10 months). Filled circles represent centroids, with connecting lines corresponding to samples from each group. Two-tailed p-value was calculated using PERMANOVA. b. Metagenomic shotgun sequencing of fecal microbiota samples identifies differentially abundant genes in Ps vs. NPs at 10 months from start of therapy. Heatmap shows differentially abundant genes identified by metagenomic shotgun sequencing (FDR < 0.2 and FC > 1.5). Columns denote patients grouped by progression status and clustered within P/NP groups; rows denote bacterial genes significantly upregulated (red) or downregulated (blue) in Ps versus NPs. c and d. Select genes involved in representative microbial processes of lipopolysaccharide (LPS) processing (c) and iron metabolism (d).
Extended Data Fig. 6 |
Extended Data Fig. 6 |. Metagenomic sequencing identifies distinct taxa associated with various immune-related adverse events in PD-1-treated melanoma patients in Pittsburgh early cohort.
Heatmap depicts metagenomic compositional differences between patients with a given immune-related adverse event (irAE) as compared to patients with other irAEs using scaled fold differences (high – red; low – blue) in abundances of specific bacteria. Values in individual cells represent unadjusted p-values calculated using two-tailed Mann-Whitney U test, with p-values <0.1 displayed within cells. Bar plot to left of heatmap indicates extent of association between corresponding taxa and progression-free survival probability [scaled hazard ratio (HR)], with Storey q-values <0.1 displayed within cells (from Supplementary Tables 4 and 5).
Extended Data Fig. 7 |
Extended Data Fig. 7 |. Reanalysis of four previously published individual cohorts using the same bioinformatic pipeline.
a. Analysis of α-diversity from five PD-1-treated melanoma patient cohorts (n = 185), including the Pittsburgh early sample cohort (n = 63), using either shotgun metagenomic (5 cohorts, red) or 16S rRNA gene amplicon (4 cohorts, black) sequencing. Details of each individual cohort are summarized in Supplementary Table 3. Forest plots depict α-diversity-based association tests including inverse Simpson, Shannon, and observed operational taxonomic units. Within each fixed-effect plot, names of each cohort are shown on a separate line, while log odds ratio of α-diversity (squares, size proportional to sample size used in meta-analysis) and associated 95% confidence intervals (bars) are shown, along with the dotted vertical line of no effect. The p-values reported for each cohort are two-tailed p values computed from the z statistic. To control for unobserved heterogeneity, we separately evaluated α-diversity using a random effects model on both pooled shotgun and 16S sequencing data from the 5 cohorts and performed I2 test for heterogeneity as shown. The p-value reported for heterogeneity is a one-tailed Cochran’s Q-test. b. t-distributed uniform manifold approximation and projection (t-UMAP) plot before (left) and after (right) correction for study-related batch effect using ComBat R package for all cohorts together including Pittsburgh cohort. P-values were calculated using PERMANOVA. c. t-UMAP plot of batch-corrected pooled metagenomic sequencing data from five separate cohorts of melanoma patients treated with anti-PD-1 therapy depicting fecal microbiota compositional differences with two-tailed p-value calculated using PERMANOVA between responders (Rs) and non-responders (NRs). d. Heatmap of differentially (p-values were calculated using non-parametric two-tailed Mann-Whitney U test) abundant gut microbiome taxa (p < 0.05, FC > 2) evaluated with shotgun sequencing in five melanoma patient cohorts, including Pittsburgh early sample cohort. Study-related batch effect was removed using ComBat R package. Response to therapy in published cohorts was determined as described in each study (Supplementary Table 3). Response to therapy in the Pittsburgh early sample cohort was defined as non-progression at 10 months after initiation of treatment. Columns represent patients grouped by clinical response and clustered within R/NR groups; rows depict bacterial taxa enriched (black) or depleted (red) in Rs versus NRs clustered based on gut microbiota composition.
Extended Data Fig. 8 |
Extended Data Fig. 8 |. Meta-analysis of all cohorts using random effects model identifies organisms differentially enriched in melanoma patients treated with anti-PD-1 therapy in separate cohorts by response status.
a. Random effect model meta-analysis of differentially abundant bacteria between responders (Rs) and non-responders (NRs) from five cohorts (n = 185) including Pittsburgh early sample cohort (n = 63) using shotgun metagenomic sequencing. All significant bacterial taxa enriched in Rs and NRs are shown. b. Forest plots depict association of representative bacterial species with response to anti-PD-1 therapy. Within each plot, names of various cohorts are shown on separate lines, while Hedge’s g (squares, standardized mean differences, size proportional to sample size) and associated 95% confidence intervals (bars) are shown, along with the dotted vertical line of no effect. To control for unobserved heterogeneity, we separately evaluated Hedge’s g using random effect model on metagenomic data and performed I2 test for heterogeneity as shown. P-values were calculated using random effect model.
Extended Data Fig. 9 |
Extended Data Fig. 9 |. Expression levels of selected taxa in different American Gut Project enteric microbiotypes.
t-distributed stochastic neighbor embedding (t-SNE) plots depicting American Gut Project (AGP) dataset with visualization of abundances of select taxa (blue – low; red – high).
Extended Data Fig. 10 |
Extended Data Fig. 10 |. Geographic differences determine sampling variability between cohorts.
a. t-distributed stochastic neighbor embedding (t-SNE) plots depicting mapping of individual melanoma patient cohorts to American Gut Project (AGP) dataset revealed distinct compositional differences between them. Each cohort is represented by a different color that is maintained in the overlay. Colors in the overlay are semi-translucent and were stratified starting from the Pittsburgh to New York cohort. Gut microbiota compositions of the different cohorts were significantly different (PERMANOVA, two-tailed p < 0.001). b. and c. Heatmaps represent scaled abundances of each enteric microbiotypes across 28 states from which AGP data were available on the left, with the four states from which anti-PD-1-treated melanoma cohorts originated separately on the right using three individuals per county per cluster as a cutoff. Data were scaled by number of individuals per state and per cluster and are depicted in relation to the 28 states that met the cutoff and in relation to the four states from which the four studied cohorts originated. b. Heatmaps are (b) scaled only by number of samples from state (to reflect local abundance of microbiotypes) or (c) scaled by both number of samples per state and by number of samples per microbiotype (to reflect distribution of different microbiotypes across the US). d. Geographic representation in the US of four representative enteric microbiotypes, with most uneven distribution between four states (right panel in c).
Fig. 1 |
Fig. 1 |. Compositional differences in the fecal microbiome of anti-PD-1-treated patients with melanoma are associated with differential progression-free survival.
ac, Valuation of the association of fecal microbiome composition (P-ESC) and response to anti-PD-1 therapy were assessed using shotgun metagenomic sequencing. Objective radiographic response to therapy was evaluated using RECIST v1.1 every 3 months, and progression was defined based on radiographic and/or clinical progression at each treatment visit (every 3–4 weeks). a, Top, number of patients on follow-up at each time point in relation to response status. Middle, distance in composition of the initial microbiome between Ps and NPs identified at each treatment visit. Distances between centroids comparing Ps and NPs were calculated at each time point as the Euclidean distance between the two centroids in all principal-component dimensions of the Bray–Curtis distance in a principal-component analysis; dots indicate PFS at all time points, while the asterisk indicates RECIST v1.1 response (complete response (CR) or partial response (PR)) at 3 months. Bottom, significance of the difference at each time point using PERMANOVA 1/p of Bray–Curtis distance. b, t-distributed uniform manifold approximation and projection (t-UMAP) plot depicting fecal microbiota compositional differences between NPs and Ps at time of maximal difference from start of therapy (10 months). Open circles represent centroids, with connecting lines corresponding to samples from each group. Two-tailed P value was calculated using PERMANOVA. c, Metagenomic shotgun sequencing of fecal microbiota samples identified differentially abundant taxa in Ps versus NPs at 10 months from start of therapy (because no events were observed in this cohort at 9–10 months after treatment, results at these two time points are identical). Statistical significance was calculated by two-tailed Mann–Whitney U test. Heat map shows differentially abundant taxa identified by metagenomic shotgun sequencing (FDR < 0.2 and FC > 2). Columns denote patients grouped by progression status and clustered within P/NP groups; rows denote bacterial taxa enriched (black) or depleted (red) in NPs versus Ps, clustered based on microbiota composition. RECIST v1.1 radiographic response categories: complete response (CR), partial response (PR), stable disease (SD), and progressive disease (PD).
Fig. 2 |
Fig. 2 |. Relationship between microbiota composition and associated host variables in relation to clinical response.
a, Differentially expressed human host genes identified in stool specimens of NPs (n = 18) compared to Ps (n = 8) at 10 months. Significance was calculated using two-tailed Mann–Whitney U test. Genes with P < 0.5 and FC > 2 were considered. b, Ingenuity pathway analysis of upstream regulators of differentially expressed host genes in Ps. Regulators and their targets were plotted using Cytoscape 3.8.0, with edges showing connections between regulators and their targets. Newly predicted upstream regulators are in yellow, while predicted upstream regulators that were included in the identified gene list are in orange. Genes in bold are discussed in the text. c, GSEA of predicted cell types based on host genes identified in a and differentially expressed in NPs compared to Ps. Significantly enriched (P < 0.05) cell types are depicted by red dots. d, Transkingdom network analysis. Data for microbial taxa (circles), microbial genes (diamonds) and human genes (squares) were analyzed to identify highly differentially abundant elements between Ps and NPs and integrated with phenotypes (brown hexagons denote clinical outcome (PFS) and baseline variables (NLR)) to form a transkingdom network. Favorable (blue) and unfavorable (red) nodes (taxa, microbial genes and host genes) were defined as in Fig. 1c and in Methods. Blue and orange edges indicate negative and positive correlations, respectively. e, Number of edges between phenotypes and each type of omics data (taxa, microbial genes and human genes) in the transkingdom (solid red line) and randomized networks (the light gray violin plot shows the distribution in 103 random networks, and the dashed black line indicates the average). Connectivity strength is the number of observed edges between two groups of nodes in the transkingdom network normalized by the number of all possible edges in a bipartite graph of the two groups of nodes. Two-tailed P values were calculated by one-sample Wilcoxon signed-rank test. f,g, LKT–phenotype Bi-BC (global property; f) and degree (local property; g) of nodes in the transkingdom network from d were calculated. Two-tailed P values were calculated by Mann–Whitney U test. DCs, dendritic cells; mLN, mesenteric lymph node; NK, natural killer.
Fig. 3 |
Fig. 3 |. Fecal microbial signatures are differentially associated with immune-related adverse events and progression-free survival in PD-1-treated patients with melanoma.
a, t-UMAP plot depicting compositional differences between patients with melanoma who developed any irAEs and those who did not at any time point from the start of anti-PD-1 therapy. Two-tailed P value was calculated using PERMANOVA. b, Heat map of differentially abundant taxa (P < 0.05 and FC > 2) in patients with no irAEs versus grade 1–4 irAEs. irAE severity was graded with CTCAE v5.0. The column on the left shows HRs on a color scale and Storey’s q value numerically when less than 0.1 for each LKT. Columns in the heat map depict patients grouped by reported or non-reported irAEs and clustered within corresponding groups based on gut microbiome composition. Rows depict bacterial taxa enriched (black) or depleted (red) in patients with melanoma with irAEs (grade 1–4) and clustered based on gut microbiota composition. Statistical significance was calculated by two-tailed Mann–Whitney U test. c, Percentages of PD-1-treated early-cohort patients with melanoma exhibiting all or specific types of irAEs segregated by relative abundance of the seven Streptococcus spp. identified in b (eight patients clustered in the high Streptococcus group; χ2, *P = 0.0018; ***P = 0.001) d, Kaplan–Meier plot of PFS probability based on the relative abundance of Streptococcus spp. among patients with irAEs (n = 39). Numbers of patients at risk at each time point are shown. HR and score (log rank) test two-tailed P value from Cox proportional hazards regression analysis. e, Proportion of patients with melanoma treated with PPIs among patients with high versus low relative abundance of Streptococcus spp.
Fig. 4 |
Fig. 4 |. Gut microbiome meta-analysis of five independent cohorts of patients with melanoma treated with anti-PD-1 identifies organisms and microbial genes differentially enriched in responders and nonresponders.
a, After removing study-related batch effects using the ComBat R package, the resultant batch-corrected dataset was further analyzed using LEfSe analysis and depicted in a cladogram. b, Fisher’s method meta-analysis of differentially abundant shotgun-sequenced gut microbiome taxa (P < 0.01) in Rs versus NRs from four publicly available melanoma patient cohorts, along with P-ESC. Response to therapy in each of the published cohorts was determined as described in each study (Supplementary Table 3). c,d, Visualization (Cytoscape 3.8.0) of genes associated with clinical response and shared between favorable (c) or unfavorable (d) species (as identified by LEfSe from all five analyzed cohorts after removing study-related batch effects) but present only in a proportion of subspecies within each species. All species with identified genes are shown in red. Among identified genes, those mentioned in the main text are shown in blue, whereas unlabeled white circles show all other genes. The full list of genes enriched in Rs or NRs is reported in Supplementary Fig. 10.
Fig. 5 |
Fig. 5 |. Machine learning shows significant prediction of cohort response using models trained on other cohorts combined.
a, Receiver operating characteristic curves for models trained on the four cohorts and tested on the remaining cohort. Three machine learning (modified leave-one-out cross-validation (LOOCV)) methods were used: GLM, RF and poly-SVM. AUC and P values (P(accuracy) > no information rate) via the one-tailed binomial test) of the accuracy of models are given. b, Forest plots based on the results from a. Each machine learning method is represented by a separate forest plot, with cohorts shown on different lines. Hedge’s g (squares, standardized mean differences, size proportional to sample size) and associated 95% confidence intervals (bars) are shown along with the dashed vertical line of no effect. To control for unobserved heterogeneity, we separately evaluated Hedge’s g and P values using a random-effects model on metagenomic data and performed an I2 test for heterogeneity as shown.
Fig. 6 |
Fig. 6 |. Mapping of combined 16S rRNA gene amplicon sequencing data from PD-1-treated patients with melanoma to the American Gut Project dataset identifies favorable and unfavorable enteric microbiotypes.
a, t-distributed stochastic neighbor embedding (t-SNE) plot of ~7,000 stool samples from the AGP dataset. All the sequences from AGP and melanoma cohorts were corrected to eliminate contamination of room temperature growing bacteria (‘bloom’) using the ‘Deblur’ program. Samples were clustered using the PhenoGraph R package, and compositionally distinct clusters were displayed using different colors. b, Mapping of samples from four independent PD-1-treated melanoma patient cohorts (Chicago (C), Houston (H), New York (NY) and Pittsburgh (P)) with available 16S amplicon data onto an AGP t-SNE plot, with each cohort depicted in a different color. c, Mapping of samples from b onto an AGP t-SNE plot with Rs (blue) and NRs (red) depicted separately. d, Distinct favorable (blue) and unfavorable (red) enteric microbiotypes were estimated by calculating ORs of response to nonresponse in each cluster as defined by PhenoGraph in R. e, Manual segregation of favorable and unfavorable enteric superclusters from d onto an AGP t-SNE plot. Probability (P) of nonrandom distribution of neighboring clusters with the same OR of response within the four superclusters was estimated using a random-effects model. f, Heat map depicts abundances of all taxa from the AGP in favorable and unfavorable enteric superclusters. Dark red indicates most abundant; dark blue indicates least abundant. g, Visualization using LEfSe cladogram of differentially abundant taxa in the four superclusters calculated on 16S amplicon data from the combined cohorts.

Comment in

References

    1. Sivan A et al. Commensal Bifidobacterium promotes antitumor immunity and facilitates anti-PD-L1 efficacy. Science 350, 1084–1089 (2015). - PMC - PubMed
    1. Vetizou M et al. Anticancer immunotherapy by CTLA-4 blockade relies on the gut microbiota. Science 350, 1079–1084 (2015). - PMC - PubMed
    1. Dzutsev A, Goldszmid RS, Viaud S, Zitvogel L & Trinchieri G The role of the microbiota in inflammation, carcinogenesis, and cancer therapy. Eur. J. Immunol. 45, 17–31 (2015). - PubMed
    1. Gopalakrishnan V et al. Gut microbiome modulates response to anti-PD-1 immunotherapy in melanoma patients. Science 359, 97–103 (2018). - PMC - PubMed
    1. Matson V et al. The commensal microbiome is associated with anti-PD-1 efficacy in metastatic melanoma patients. Science 359, 104–108 (2018). - PMC - PubMed

Publication types