. 2022 Feb 1:24:342-354.
doi: 10.1016/j.omtm.2022.01.013. eCollection 2022 Mar 10.

Characterization of AAV-mediated dorsal root ganglionopathy

Affiliations

Characterization of AAV-mediated dorsal root ganglionopathy

Nicholas Buss et al. Mol Ther Methods Clin Dev. .

Abstract

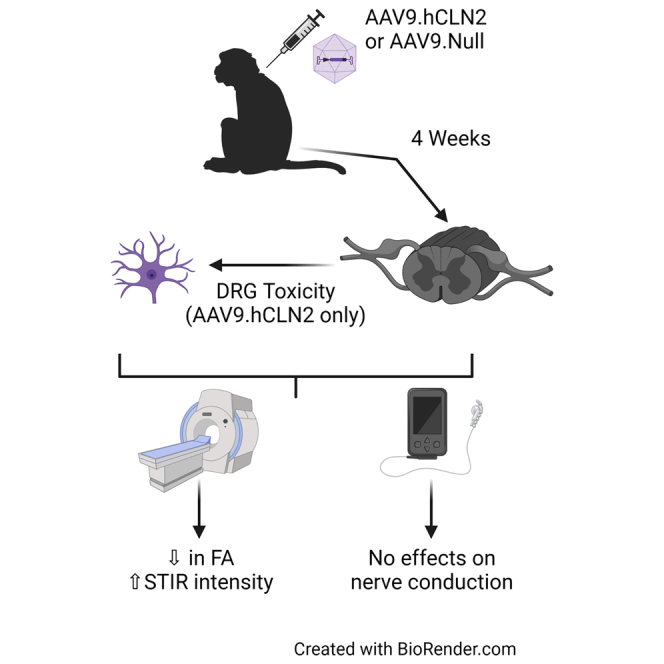
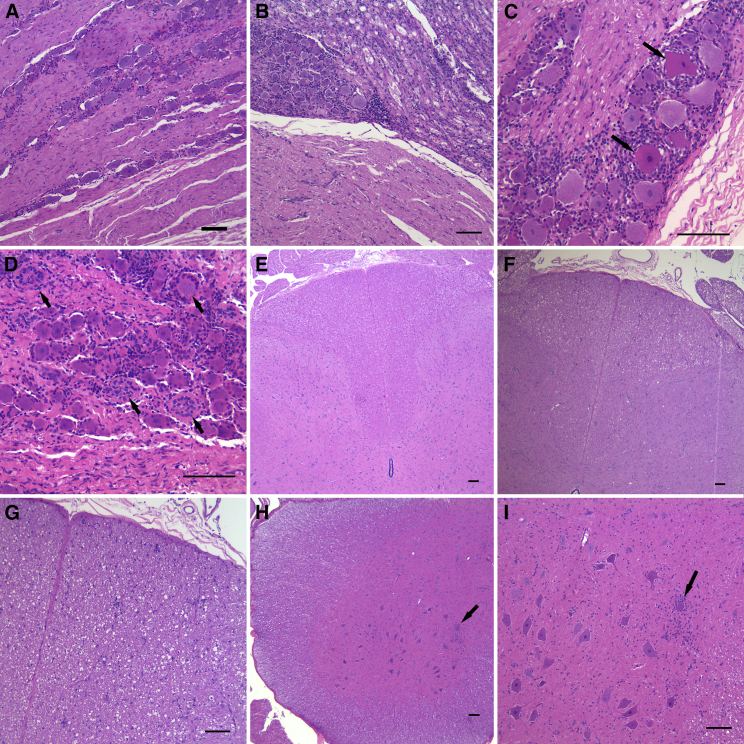
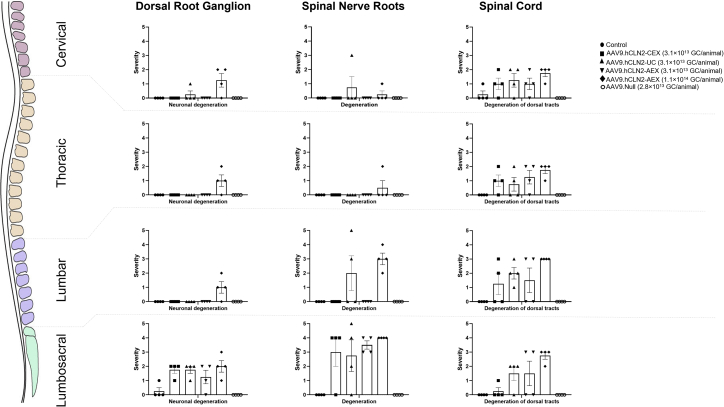
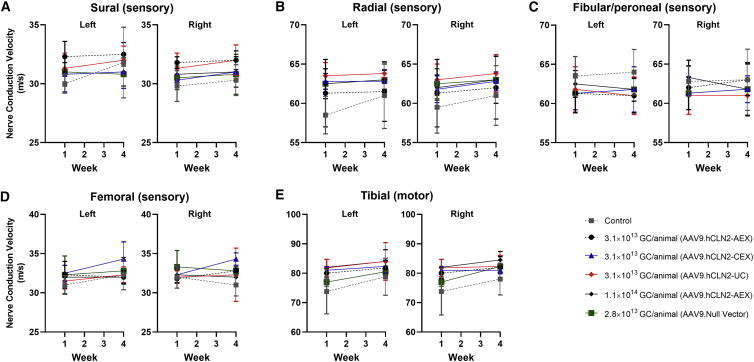
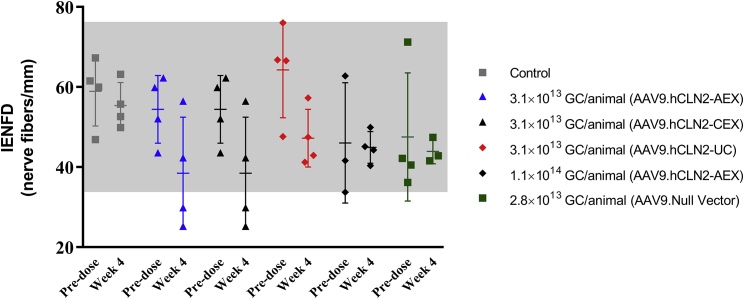
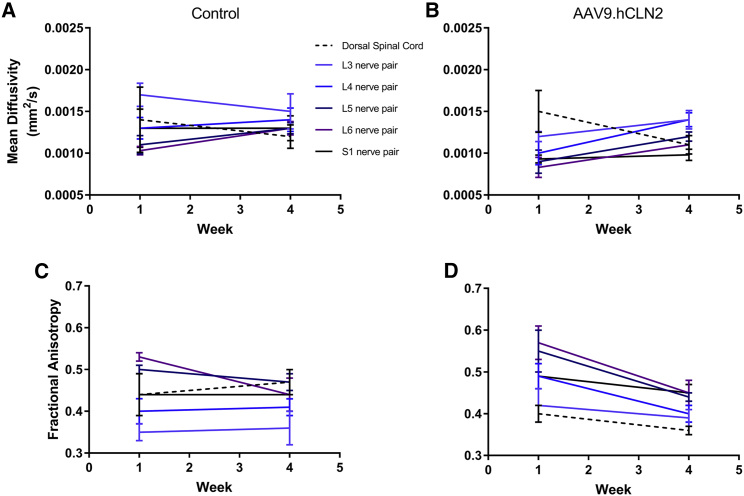
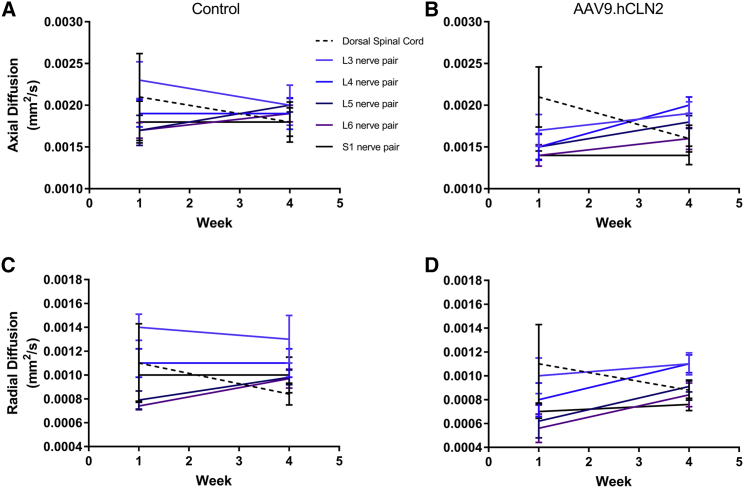
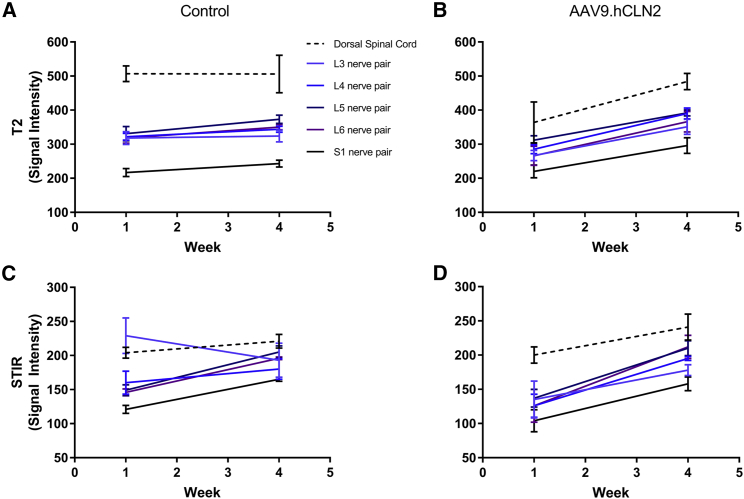
Recent studies in non-human primates administered recombinant adeno-associated viruses (rAAVs) have shown lesions in the dorsal root ganglia (DRG) of unknown pathogenesis. In this study, rAAV9s manufactured using different purification methods alongside a non-expressing Null AAV9 vector was administered to groups of cynomolgus monkeys followed by neuropathological evaluation after 4 weeks. Lesions, including neuronal degeneration, increased cellularity, and nerve fiber degeneration, were observed in the DRG, regardless of purification methods. Animals did not develop any neurological signs throughout the study, and there was no loss of function observed in neuro-electrophysiological endpoints or clear effects on intraepidermal nerve fiber density. However, magnetic resonance imaging (MRI) of animals with axonopathy showed an increase in short tau inversion recovery (STIR) intensity and decrease in fractional anisotropy. In animals administered the Null AAV9 vector, DRG lesions were not observed despite vector DNA being detected in the DRG at levels equivalent to or greater than rAAV9-treated animals. This study further supports that DRG toxicity is associated with transgene overexpression in DRGs, with particular sensitivity at the lumbar and lumbosacral level. The data from this study also showed that the nerve fiber degeneration did not correlate with any functional effect on nerve conduction but was detectable by MRI.

Keywords: AAV; AAV9; DRG; MRI; axonopathy; cynomolgus monkey; toxicity.


Conflict of interest statement

N.B., M.H., K.H.K., E.B., L.Y., Y.L., O.D., and M.F. are currently employees of REGENXBIO Inc. L.L. was an employee of StageBio at the time of study and is currently an employee of Charles River Laboratories; D.C. is currently an employee of Invicro, A Konica Minolta Company; M.M. is an employee of Preclinical Electrophysiology Consulting, LLC; J.Z. and E.A. were employees of Northern Biomedical Research at the time of study; and M.B. is an employee of StageBio.

Figures

None
Graphical abstract
Figure 1
Figure 1
Representative images of test-article-related DRG and spinal cord findings (A) Normal lumbosacral DRG in an AAV9.Null-vector-treated animal. (B) Lumbosacral DRG with increased cellularity and dorsal nerve root with degeneration and increased cellularity is shown. (C) Lumbosacral DRG with increased cellularity and degenerating neurons (arrows) is shown. (D) Lumbosacral DRG showing increased cellularity as well as glial cell hyperplasia and hypertrophy (arrows), also referred to as Nageotte nodules is shown. (E) Normal lumbar spinal cord dorsal tracts are shown. (F) Dorsal tract degeneration in the lumbar spinal cord is observed as increased clear space and cellularity. (G) Higher magnification of dorsal tract degeneration in the lumbar spinal cord is shown. (H) Gliosis in the ventral horn of the lumbar spinal cord (arrow) is shown. (I) Higher magnification of gliosis surrounding a neuron in the ventral horn of the lumbar spinal cord (arrow). The scale bars represent 100 μm in all images.
Figure 2
Figure 2
Summary of key changes in the DRG, spinal cord, and spinal nerve roots Individual cumulative scores defined as the sum of cervical, thoracic, lumbar, and lumbosacral regions with 0 as not present, 1 as minimal, 2 as mild, 3 as moderate, 4 as marked, and 5 as severe. Error bars represent SEMs.
Figure 3
Figure 3
Summary of neuro-electrophysiological endpoints Summary of nerve conduction velocity for (A) sural (sensory), (B) radial (sensory), (C) fibular and peroneal (sensory), (D) femoral (sensory), and (E) tibial (motor) nerves. Data were collected following direct electrical stimulation of a nerve and recording of a propagated nerve action potential at a distant location on the same nerve (sensory fibers) or the muscle innervated by the nerve (motor fibers). Mean nerve conduction velocity (m/s) is presented. Error bars represent SD.
Figure 4
Figure 4
Summary of intra-epidermal nerve fiber density (IENFD) Skin biopsies were collected prior to treatment and at necropsy, sectioned, and stained using Protein Gene Product 9.5. Axons were counted as they crossed the dermal/epidermal junction, and the number of axons per linear millimeter of epidermal/dermal junction was calculated. Bars represent mean and SD; the gray shaded area represents the range of pretreatment values from samples collected.
Figure 5
Figure 5
Mean diffusivity and fractional anisotropy at baseline and 4 weeks post-dosing MR images were acquired from (A) control and (B) AAV9.hCLN2-AEX (1.1 × 1014 GC/animal) or fractional anisotropy from (C) control and (D) AAV9.hCLN2-AEX (1.1 × 1014 GC/animal) at two time points: baseline (before dosing, labeled as week 1) and 4 weeks post-dosing with a 3 T Phillips Achieva MRI scanner with Flex L and spine radiofrequency (RF) coils. Pulse sequences were qualitatively reviewed by a board-certified veterinary radiologist and appropriate sequences selected based on spatial resolution and image contrast for region of interest (ROI) creation and signal intensity measurement. Images selected include DTI high iso for mean diffusivity. Statistical analyses were performed, comparing groups against their baseline (Tables S18–S25). A p < 0.05 was seen for mean diffusivity at L6 in AAV9.hCLN2-treated animals.
Figure 6
Figure 6
Axial and radial diffusivity at baseline and 4 weeks post-dosing MR images were acquired for axial diffusion from (A) control and (B) AAV9.hCLN2-AEX (1.1 × 1014 GC/animal) or radial diffusion from (C) control and (D) AAV9.hCLN2-AEX (1.1 × 1014 GC/animal) at two time points: baseline (before dosing, labeled as week 1) and 4 weeks post-dosing with a 3 T Phillips Achieva MRI scanner with Flex L and spine RF coils. Pulse sequences were qualitatively reviewed by a board-certified veterinary radiologist and appropriate sequences selected based on spatial resolution and image contrast for ROI creation and signal intensity measurement. Images selected include DTI high iso for axial and radial diffusivity. Statistical analyses were performed, comparing groups against their baseline (Tables S18–S25). A p < 0.05 was seen for axial diffusivity at L6 in AAV9.hCLN2-treated animals.
Figure 7
Figure 7
s2 neuro T2-TFE signal intensity and STIR signal intensity at baseline and 4 weeks post-dosing MR images were acquired for s2 neuro T2-turbo field echo (TFE) from (A) control and (B) AAV9.hCLN2-AEX (1.1 × 1014 GC/animal) or 3D STIR from (C) control and (D) AAV9.hCLN2-AEX (1.1 × 1014 GC/animal) at two time points: baseline (before dosing, labeled as week 1) and 4 weeks post-dosing with a 3 T Phillips Achieva MRI scanner with Flex L and spine RF coils. Pulse sequences were qualitatively reviewed by a board-certified veterinary radiologist and appropriate sequences selected based on spatial resolution and image contrast for ROI creation and for assessment of s2 neuro T2-TFE or 3D STIR images. Statistical analyses were performed comparing groups against their baseline (Tables S18–S25). A p < 0.05 was seen for s2 neuro T2-TFE signal intensity at L6 and STIR signal intensity at L3, L4, L5, L6, and S1 in AAV9.hCLN2-treated animals.

References

    1. Kuzmin D.A., Shutova M.V., Johnston N.R., Smith O.P., Fedorin V.V., Kukushkin Y.S., van der Loo J.C.M., Johnstone E.C. The clinical landscape for AAV gene therapies. Nat. Rev. Drug Discov. 2021;20:173–174. - PubMed
    1. Mendell J.R., Al-Zaidy S.A., Rodino-Klapac L.R., Goodspeed K., Gray S.J., Kay C.N., Boye S.L., Boye S.E., George L.A., Salabarria S., et al. Current clinical applications of in vivo gene therapy with AAVs. Mol. Ther. 2021;29:464–488. - PMC - PubMed
    1. Bolt M.W., Brady J.T., Whiteley L.O., Khan K.N. Development challenges associated with rAAV-based gene therapies. J. Toxicol. Sci. 2021;46:57–68. - PubMed
    1. Hordeaux J., Buza E.L., Dyer C., Goode T., Mitchell T.W., Richman L., Denton N., Hinderer C., Katz N., Schmid R., et al. Adeno-associated virus-induced dorsal root ganglion pathology. Hum. Gene Ther. 2020;31:808–818. - PubMed
    1. Hordeaux J., Hinderer C., Goode T., Katz N., Buza E.L., Bell P., Calcedo R., Richman L.K., Wilson J.M. Toxicology study of intra-cisterna magna adeno-associated virus 9 expressing human alpha-L-Iduronidase in Rhesus Macaques. Mol. Ther. Methods Clin. Dev. 2018;10:79–88. - PMC - PubMed

LinkOut - more resources