. 2021 Dec 10;6(2):e10579.
doi: 10.1002/jbm4.10579. eCollection 2022 Feb.

Temporal and Quantitative Transcriptomic Differences Define Sexual Dimorphism in Murine Postnatal Bone Aging

Affiliations

Temporal and Quantitative Transcriptomic Differences Define Sexual Dimorphism in Murine Postnatal Bone Aging

Darlene Lu et al. JBMR Plus. .

Abstract

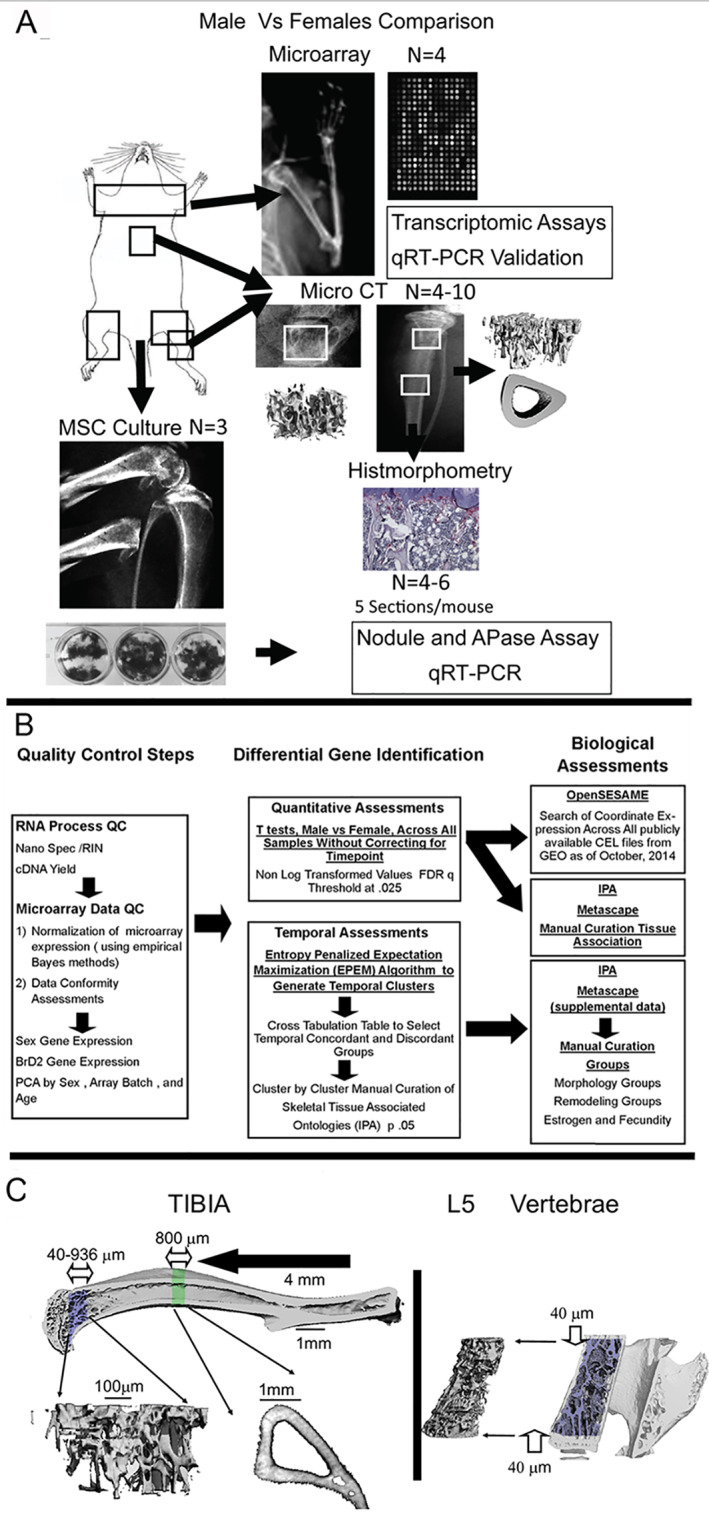
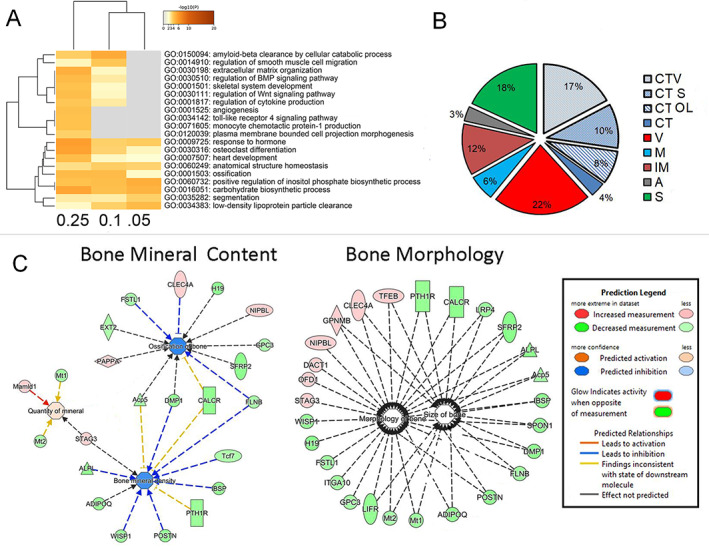
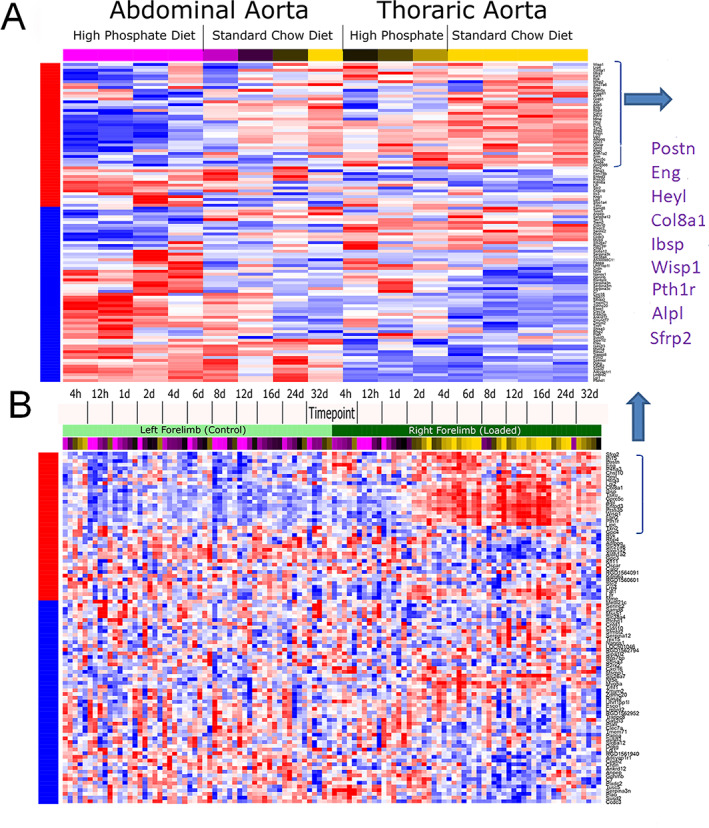
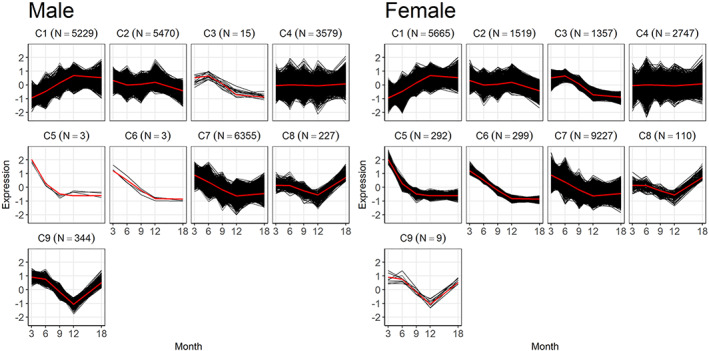
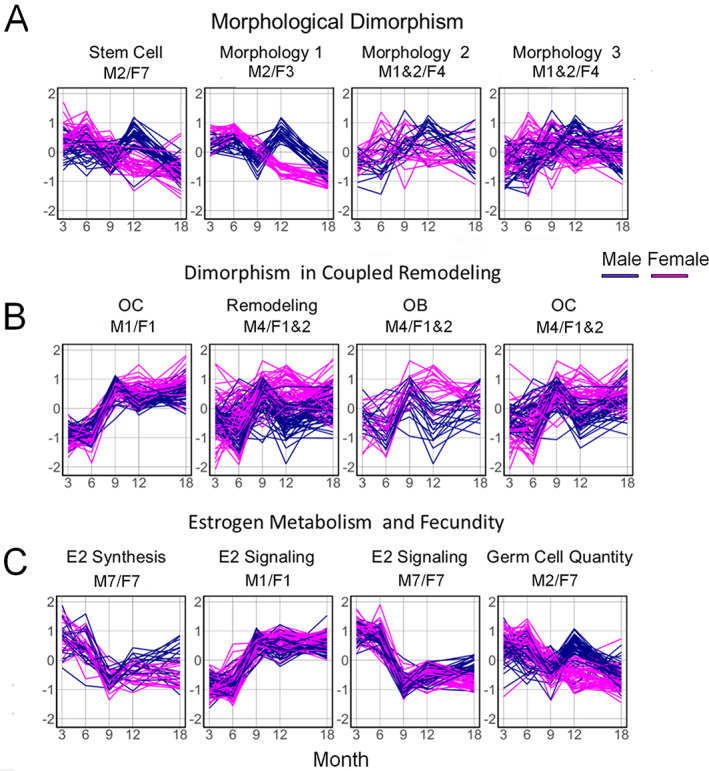
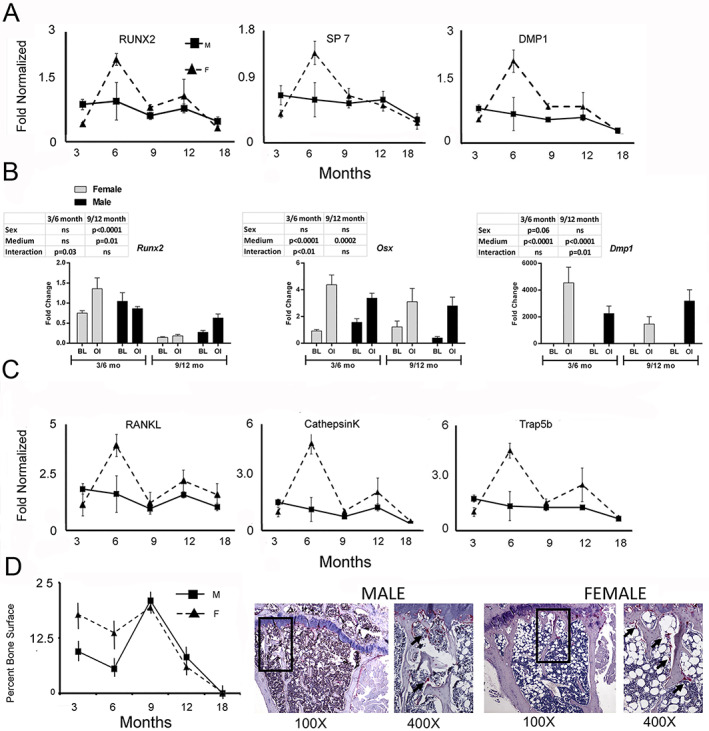
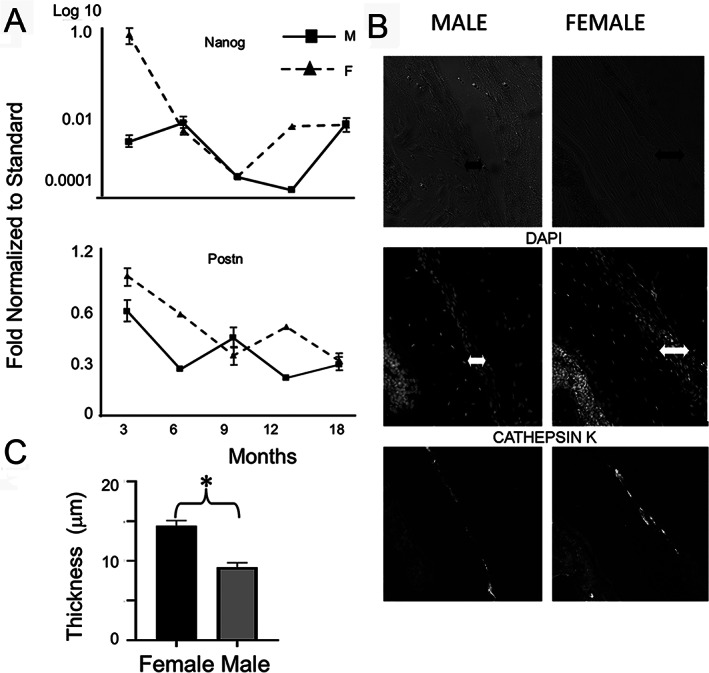
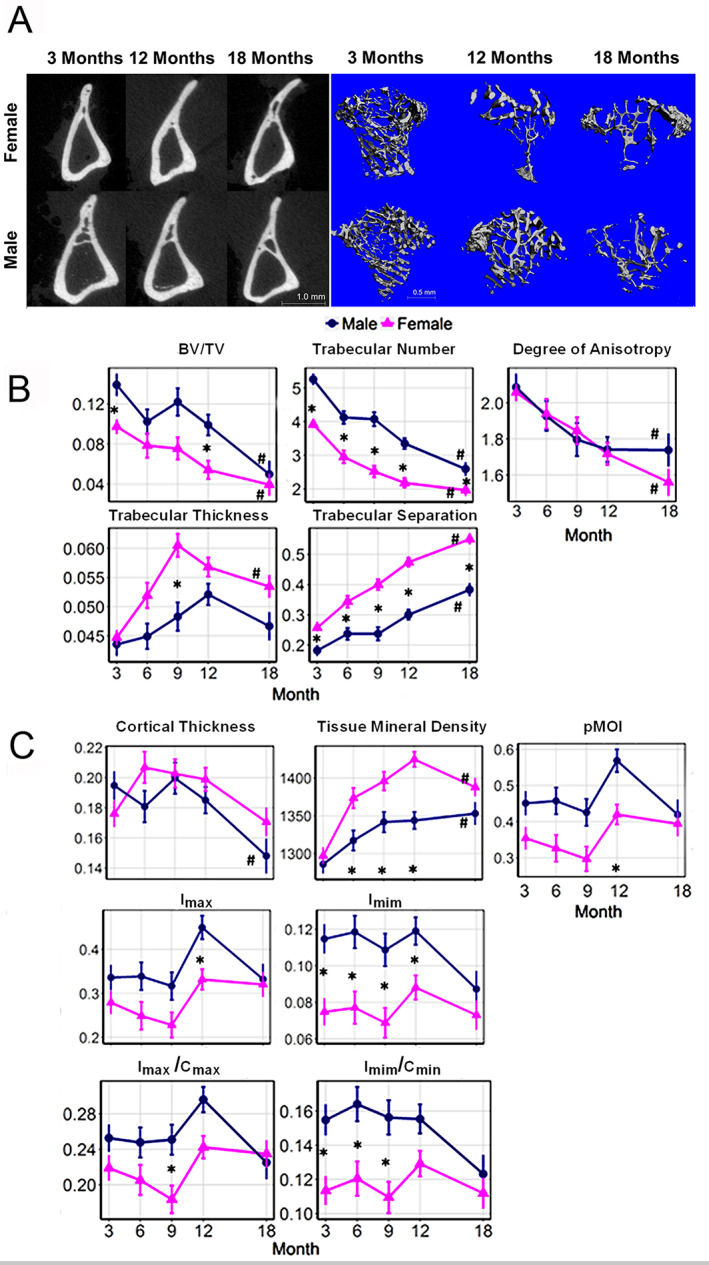
Time is a central element of the sexual dimorphic patterns of development, pathology, and aging of the skeleton. Because the transcriptome is a representation of the phenome, we hypothesized that both sex and sex-specific temporal, transcriptomic differences in bone tissues over an 18-month period would be informative to the underlying molecular processes that lead to postnatal sexual dimorphism. Regardless of age, sex-associated changes of the whole bone transcriptomes were primarily associated not only with bone but also vascular and connective tissue ontologies. A pattern-based approach used to screen the entire Gene Expression Omnibus (GEO) database against those that were sex-specific in bone identified two coordinately regulated gene sets: one related to high phosphate-induced aortic calcification and one induced by mechanical stimulation in bone. Temporal clustering of the transcriptome identified two skeletal tissue-associated, sex-specific patterns of gene expression. One set of genes, associated with skeletal patterning and morphology, showed peak expression earlier in females. The second set of genes, associated with coupled remodeling, had quantitatively higher expression in females and exhibited a broad peak between 3 to 12 months, concurrent with the animals' reproductive period. Results of phenome-level structural assessments of the tibia and vertebrae, and in vivo and in vitro analysis of cells having osteogenic potential, were consistent with the existence of functionally unique, skeletogenic cell populations that are separately responsible for appositional growth and intramedullary functions. These data suggest that skeletal sexual dimorphism arises through sex-specific, temporally different processes controlling morphometric growth and later coupled remodeling of the skeleton during the reproductive period of the animal. © 2021 The Authors. JBMR Plus published by Wiley Periodicals LLC on behalf of American Society for Bone and Mineral Research.

Keywords: BONE AGING; SEX‐SPECIFIC; TEMPORAL TRANSCRIPTOMIC CLUSTER ANALYSIS.


Figures

Fig 1
Fig 1
Schematic summary of work flow of the phenomic and transcriptomic analysis of experimental methods applied in this study. (A) Graphical scheme of the work flow of the primary animal group of 68 mice used for these analysis. All assays shown were performed in the same mice using different bones. All transcriptomic analysis was done in paired humeri from individual mice. All cell cultures were prepared from pooled marrow cells prepared from both femurs and the left tibia from one mouse. All microCT were performed on the right tibia and L5 and histomorphometry was sequentially done on the right tibia after microCT. Validation qRT‐PCR was carried out using total RNAs from the same samples used for microarray. In some cases, additional bones from a given age and sex group were included to increase the microCT group sizes to reach statistical significance. MicroCT was the only assay in which this was carried out. N values as denoted in the figure represent individual animal numbers within the assay group. (B) Flow diagram of the steps of the array analysis. The analysis proceeded from quality control steps (RNA QC and MicroArray QC), differential gene expression (quantitative and temporal), biological assessments (openSESAME, IPA Metascape, and manual annotation). (C) Graphical scheme of the analytical steps of the microCT analysis. For the metaphyses of the 3‐month‐old animals, the trabecular region of interest (ROI) extended from 40 μm to 936 μm away from the growth plate, along the long axis of the bone. For the older animals, the length of this trabecular ROI was scaled by the ratio of the average bone length for the age group to the average bone length for the 3‐month‐olds so that the ROI size would remain anatomically proportional as the animals grew. For the vertebral body, the trabecular ROI extended from 40 μm cranial to the caudal growth plate to 40 μm caudal to the cranial growth plate. For the diaphyses, the cortical ROI was an 800‐μm‐long segment that was centered at the mid‐diaphysis.
Fig 2
Fig 2
Characterization of the sexually dimorphic genes that show differential expression in bone tissue and their association with specific biological and environmental perturbations that have both skeletal and non‐skeletal effects. (A) Comparative ontology assessment across different statistical stringencies of the differential gene expression. Heat maps are from the enrichment analysis carried out in Metascape for DE having high FDRq 0.05, FDRq 0.1 to low FDRq up to 0.25. The heat map cells are colored by their p values as shown in the figure. (B) Percentage tissue distribution is based on ontological association with six tissues: CT = connective tissues; S = skeletal; A = adipose; IM = immunological; M = muscle; and V = vascular. Ontological association to connective tissues is denoted with light blue patterned pie sections and is separately labeled if the genes were also associated with skeletal tissues, vascular tissues, or both tissues CT OL (overlap). A group of connective tissue genes not assigned to any one tissue type is denoted CT (dark blue). A very small number of CT‐associated genes were also associated with A, IM, and/or M and are not represented in the pie chart. (C) Network interactions within two primary functional gene groupings within skeletal tissues were constructed using IPA. These groupings were determined from merging 10 gene sets in the total 353 genes. Gene sets from diseases and functions are white nodes, and functional pathways are denoted as blue nodes. Legend for these groupings, predicted network interactions between the genes and molecular functions for gene symbols are indicated. Color coding for the gene expression are based on ratio of the mean male values to the mean female values.
Fig 3
Fig 3
OpenSESAME analysis displaying two of 28 rodent gene sets that showed association to the coordinate sex‐specific gene signature of bone. (A) The coordinate sex‐specific gene signature association with the gene expression changes found in aortic arterial calcification. (B) The coordinate sex‐specific gene signature association with the gene expression changes found in in vivo forelimb mechanical loading. Experimental conditions are shown across the top of the two heat maps. Red denotes increased and blue decreased expression from the mean chip value for each experiment. The red and blue side bars indicate the expression ratio values relative to the male versus female mice. The genes showing the greatest difference in expression as seen in the heat maps in each of the experimental series and that overlapped between the two series are bracketed in the figure. The specific genes that overlap between both of the series are listed in purple text.
Fig 4
Fig 4
Temporal clustering of male and female bone transcriptomes overall and in relation to selective gene ontologies associated with skeletal morphology, coupled remodeling, estrogen metabolism, and reproductive capacity. Cluster plots obtained by the entropy penalized EM clustering algorithm of gene‐expression profiles for male and female expression profiles. Cluster numbers are denoted C1, 2, etc., while the number of genes contained in the cluster is indicated in parentheses. Individual panels show the spread of expression data for all genes (black) in the cluster as well as the mean expression (red) of all genes in the cluster. The gene sets for the cluster data from the EPEM analysis and the cross‐tabulations of the cluster labels in male and female mice are in Supplemental Table S4.
Fig 5
Fig 5
Selective temporal gene sets identified as having significant overexpression to skeletal tissue functional ontologies (morphology, remodeling/osteoblast of osteoclast function), estrogen biosynthesis, estrogen signaling, and oocyte production. Ontology groups were manually curated based on their descriptors in IPA. Expression patterns of the selected sets of genes that were associated with (A) morphological dimorphism, (B) coupled remodeling and bone cell activity, and (C) estrogen metabolism and fecundity are presented. The same sets of genes in male (blue) versus female (red) mice are plotted over time. The male and female gene sets that were derived are denoted in the figure and may be cross‐referenced to the data in Supplemental Table S5. A full listing of these genes and the ontologies used to organize them into sets are provided in Supplemental Table S5B.
Fig 6
Fig 6
Sex‐ and age‐associated phenomic changes in osteoblast and osteoclast activities in mice. qRT‐PCR was performed on the same RNA as used for the microarray analysis. Candidate genes that were assayed are denoted in the figure. RNA analysis was made on four RNA samples from four mice from each experimental group, except for studies depicted in (E) in which only one sample was available for 9‐ and 12‐month‐old male and female groups. For in vitro analyses, MSCS analysis represents independent bone marrow preparation and measurements from three cell preparations per time point and age. Histomorphometry measurements for osteoclasts were made from five slides from five separate mice per experimental groups and are the same samples as used for microCT. Periosteal measurements were made from 8‐week‐old male and female mice (two per sex). (A) Candidate RNA analysis for osteoblast activity. Data are presented as means ± SE (n = 4–6). (B) Comparison of osteogenic potential of male and female bone marrow MSCs. Primary bone marrow cultures were established from male and female mice (3, 6, 9, and 12 months old, C57BL/6). Cultures were either harvested on day 7 at their basal condition (BL) or after they underwent osteogenic induction (OI) for 7 days. Inset tables indicate the sex, media, and sex*media interaction for significance of the mRNA expression data (two‐factor ANOVA, Bonferroni). (C) Candidate RNA analysis for osteoclast activity. (D) Male and female C57BL/6 mice are dimorphic for changes in osteoclast activity with age. Tibias were harvested and fixed from male and female mice (3, 6, 9, 12, and 18 months old, C57BL/6 male and female mice). After micro‐CT scanning, tibias were decalcified, embedded, and sectioned. Osteoclasts were identified by TRAP staining and active osteoclast surface was analyzed. Data are presented as means ± SE (n = 4). *p < 0.05 (t test between matched time points. Candidate RNA analysis. Humeri were harvested from the same mice that were analyzed by micro‐CT; the same RNA as isolated from whole bone and presented for the microarray analysis was used from these analyses.
Fig 7
Fig 7
Appositional growth markers occur earlier and at higher levels in females than males. (A) Candidate RNA analysis for periosteal stem cells and periosteal progenitor activity. (B) Mean periosteal thickness of male and female mice. Unpaired t tests were used to compare sections from different sexes.* = (± SD, p < 0.01). (C) Representative immunohistological sections for periosteal evaluation for skeletal stem cells expressing cathepsin K. Sex of animals and nature of fluorescence image are indicated in the figure. Arrows denote observed width of the periosteum in the image.
Fig 8
Fig 8
Organ‐level structural sex‐ and age‐associated changes of the skeleton. Tibias were harvested from male and female mice at 3, 6, 9, 12, and 18 months of age. Bone parameters were analyzed by microCT (n = 4–10 bones per sex per age). (A) Representative renderings of the microCT ROI from male and female mice at 3, 12, and 18 months. (B) Analysis of trabecular parameters: bone volume fraction (BV/TV), trabecular thickness (Tb.Th, mm), degree of anisotropy (DA), trabecular number (Tb.N, 1/mm), trabecular separation (Tb.Sp, mm). (C) Analysis of cortical parameters: cortical thickness (Ct.Th, mm), tissue mineral density (TMD, mg hydroxyapatite/cm3), polar moments of inertia (pMOI, mm4), maximum (Imax, mm4) and minimum (Imin, mm4) moments of inertia, maximum (I max/Cmax, mm3) and minimum (Imin/Cmin, mm3) section moduli. *Significant difference between male and female at given month. #Significant difference between months 3 and 18 for a given sex.

Similar articles

Cited by

References

    1. Horbaly HE, Kenyhercz MW, Hubbe M, Steadman DW. The influence of body size on the expression of sexually dimorphic morphological traits. J Forensic Sci. 2019;64(1):52‐57. - PubMed
    1. Rowe DW, Adams DJ, Hong SH, et al. Screening gene knockout mice for variation in bone mass: analysis by μCT and histomorphometry. Curr Osteoporos Rep. 2018;16(2):77‐94. - PubMed
    1. Willinghamm MD, Brodt MD, Lee KL, Stephens AL, Ye J, Silva MJ. Age‐related changes in bone structure and strength in female and male BALB/c mice. Calcif Tissue Int. 2010;86(6):470‐483. - PMC - PubMed
    1. Djuric M, Djonic D, Milovanovic P, et al. Region‐specific sex‐dependent pattern of age‐related changes of proximal femoral cancellous bone and its implications on differential bone fragility. Calcif Tissue Int. 2010;86(3):192‐201. - PubMed
    1. Gabet Y, Bab I. Microarchitectural changes in the aging skeleton. Curr Osteoporos Rep. 2011;9(4):177‐183. - PubMed