. 2021 Dec 16;6(2):e10583.
doi: 10.1002/jbm4.10583. eCollection 2022 Feb.

Non-Obese MKR Mouse Model of Type 2 Diabetes Reveals Skeletal Alterations in Mineralization and Material Properties

Affiliations

Non-Obese MKR Mouse Model of Type 2 Diabetes Reveals Skeletal Alterations in Mineralization and Material Properties

Matthew J L Tice et al. JBMR Plus. .

Abstract

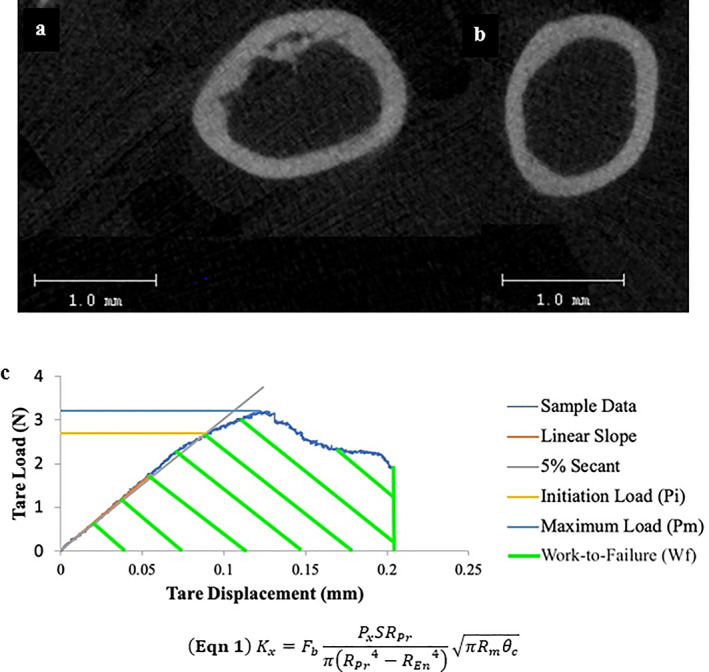
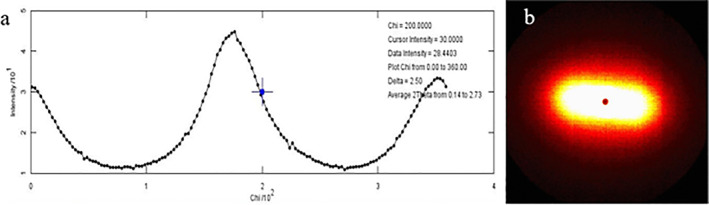
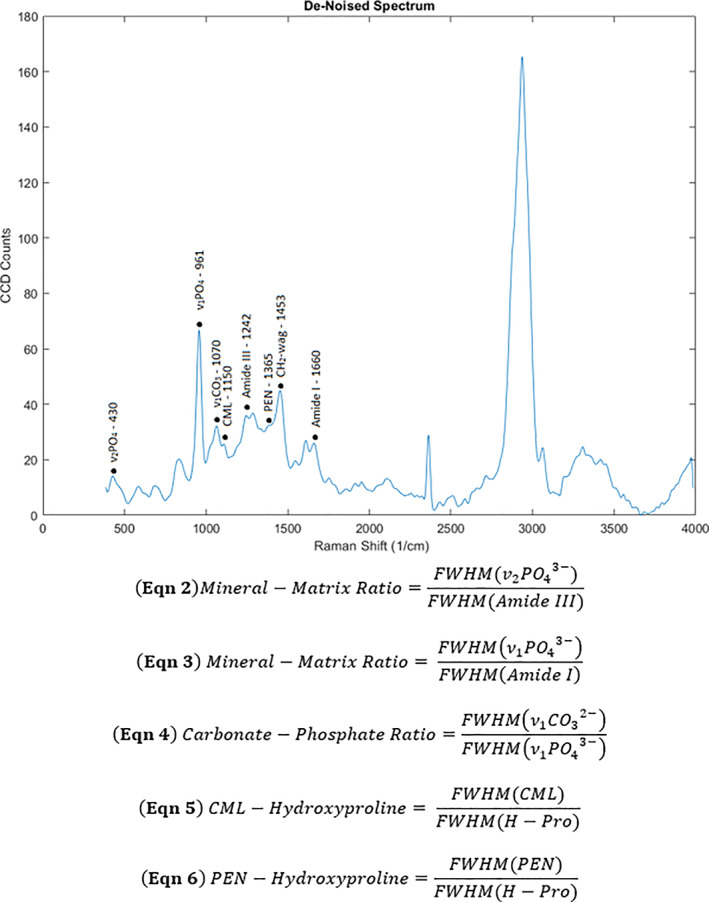
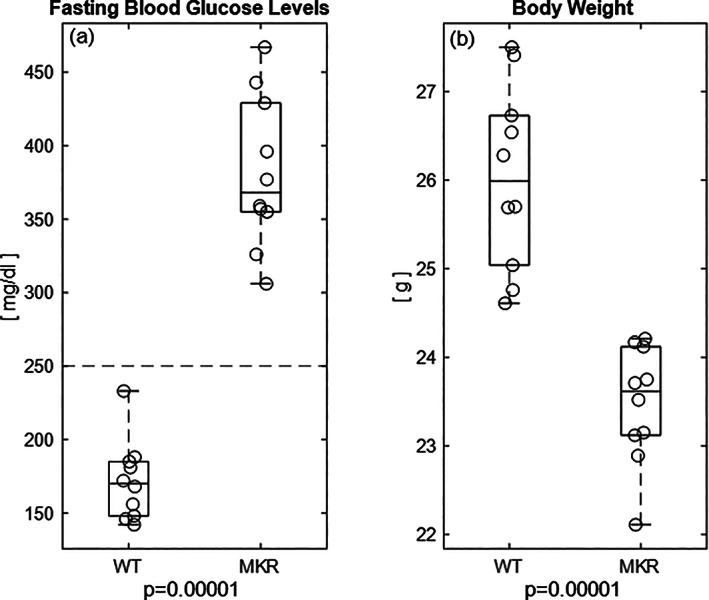
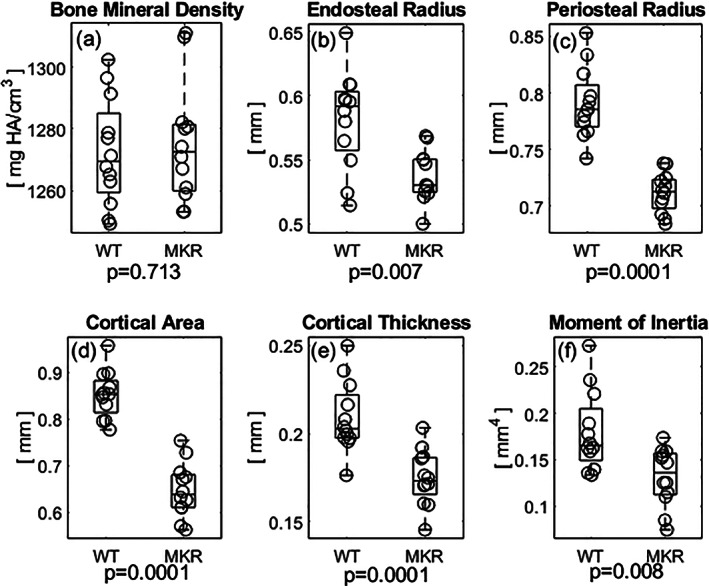
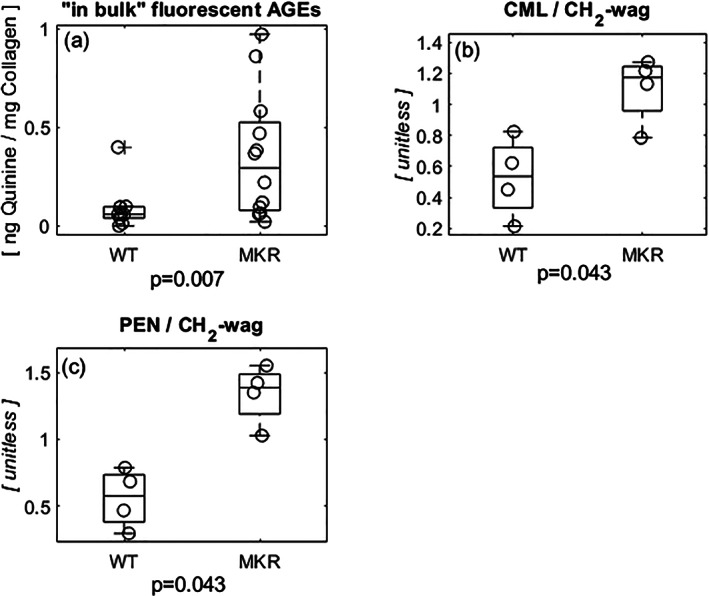
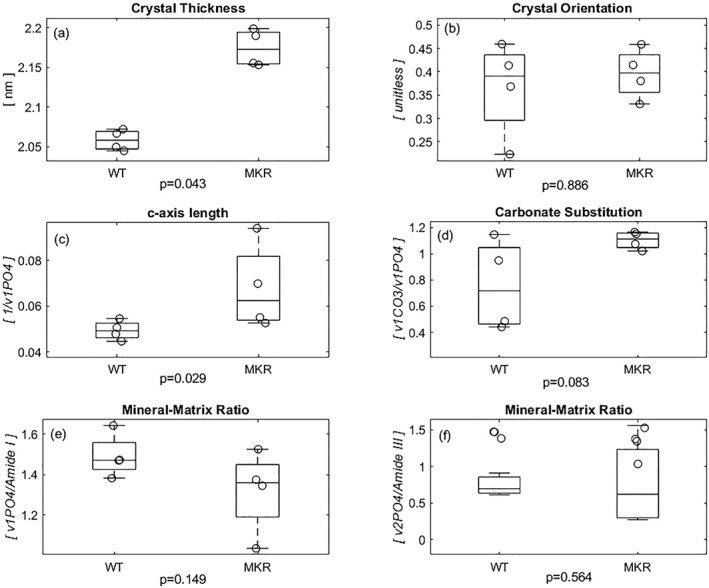
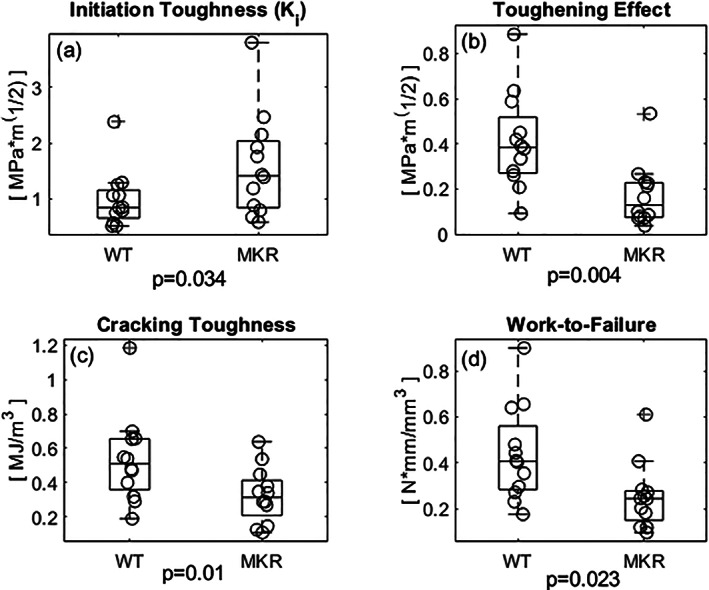
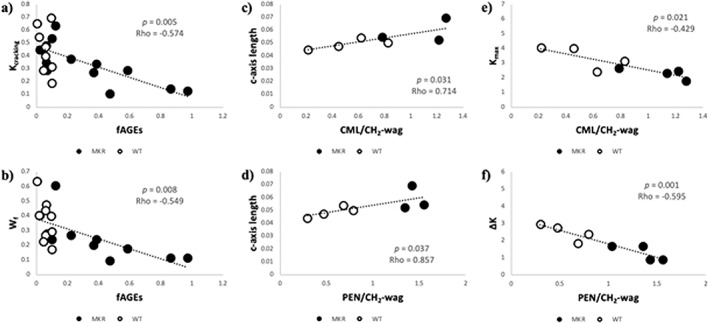
Obesity is a common comorbidity of type 2 diabetes (T2D). Therefore, increased risk of fragility fractures in T2D is often confounded by the effects of obesity. This study was conducted to elucidate the mechanistic basis by which T2D alone leads to skeletal fragility. We hypothesized that obesity independent T2D would deteriorate bone's material quality by accumulating defects in the mineral matrix and undesired modifications in its organic matrix associated with increased oxidative stress and hyperglycemia. To test this hypothesis, we used 15-week-old male non-obese mice with engineered muscle creatine kinase promoter/human dominant negative insulin growth factor 1 (IGF-I) receptor (MKR) and FVB/N wild-type (WT) controls (n = 12/group). MKR mice exhibit reduced insulin production and loss of glycemic control leading to diabetic hyperglycemia, verified by fasting blood glucose measurements (>250 mg/dL), without an increase in body weight. MKR mice showed a significant decrease in femoral radial geometry (cortical area, moment of inertia, cortical thickness, endosteal diameter, and periosteal diameter). Bone mineral density (BMD), as assessed by micro-computed tomography (μCT), remained unchanged; however, the quality of bone mineral was altered. In contrast to controls, MKR mice had significantly increased hydroxyapatite crystal thickness, measured by small-angle X-ray scattering, and elongated c-axis length of the crystals evaluated by confocal Raman spectroscopy. There was an increase in changes in the organic matrix of MKR mice, associated with enhanced glycoxidation (carboxymethyl-lysine [CML] and pentosidine) and overall glycation (fluorescent advanced glycation end products), both of which were associated with various measures of bone fragility. Moreover, increased CML formation positively correlated with elongated mineral crystal length, supporting the role of this negatively charged side chain to attract calcium ions, promote growth of hydroxyapatite, and build a physical link between mineral and collagen. Collectively, our results show, for the first time, changes in bone matrix in a non-obese T2D model in which skeletal fragility is attributable to alterations in the mineral quality and undesired organic matrix modifications. © 2021 The Authors. JBMR Plus published by Wiley Periodicals LLC on behalf of American Society for Bone and Mineral Research.

Keywords: BONE QUALITY; GLYCATION; MINERALIZATION; NON‐OBESE; TYPE 2 DIABETES.


Conflict of interest statement

All authors state that they have no conflicts of interest.

Figures

Fig 1
Fig 1
(A) Representative image from the WT group taken from the diaphyseal of the femora immediately proximal to the notch. (B) Similar figure from the MKR group. (C) Representative Load‐Displacement curve of notched three‐point bending fracture toughness testing. The initiation load (Pi; yellow line) was used to calculate the initiation toughness (Ki), determined from a sloped line at a slope of a 5% secant of the linear loading region. The maximum load (Pmax; light blue line) was used to calculate the maximum toughness (Kmax). The work‐to‐failure (Wf; green striped area) is the calculated as the area under the load‐displacement curve. Variables used to calculate toughness values: geometric parameter (Fb; derived from adjusted thickness to mean radii of each sample), S = span length; RPer = periosteal radii; REnd = endosteal radii; Rmean = mean radii (Rmean = (RPer + REnd)/2) and θc = notch angle.( 31 )
Fig 2
Fig 2
(A) Representative I‐versus‐X spectra used to extract the crystal thickness and orientation. (B) The corresponding heat map for the representative 2D spectra from which the intensity is extracted.
Fig 3
Fig 3
Representative plot of Raman intensity labeled with peaks used for analysis. The FWHM of the following peaks at the labeled Raman shifts (cm−1), correspond to skeletal extracellular matrix constituents: 430 (v2PO4 3−), 961 (v1PO4 3−), 1070 (v1CO3 2−), 1150 (CML), 1242 (Amide III), 1365 (PEN), 1453 (CH2‐wag), and 1667 (Amide I).( 48 , 54 ) FWHM = full‐width half‐maximum.
Fig 4
Fig 4
(A) By 8 weeks, the diabetic MKR group achieved diabetic levels of hyperglycemia (>250 mg/dL; dotted line( 93 )) while the WT group remained well below the blood glucose level for the diabetic state. (B) There is significant change in the body weight between the diabetic MKR mice compared to the WT controls.
Fig 5
Fig 5
(A) The diabetic MKR exhibited slightly higher BMD values compared to WT mice although not statistically significantly so. (B) The average endosteal radius of the MKR femurs was decreased compared to the WT controls. (C) The average periosteal radius was significantly smaller in the MKR femurs compared to the WT controls. (D) The area of cortical bone was lesser in the MKR mice compared to the WT controls. (E) The thickness of the mid‐diaphyseal cortex was also significantly decreased in the MKR compared to WT controls. (F) Bone mass was less radially distributed in the MKR mice compared to the WT controls.
Fig 6
Fig 6
(A) Fluorescent AGEs, a product of non‐enzymatic glycation, accumulated nearly five times more in the diabetic group when compared to the WT controls. (B) CML, a product of glycoxidation normalized to the methylene peak (representative of type I collagen content), experienced significantly more accumulation in the diabetic MKR mice compared to the WT controls. (C) PEN, a fraction of the fluorescent AGEs present in bone, normalized to methylene (CH2‐wag) accumulated at nearly double the amount of seen in the WT controls. CML = carboxymethyl‐lysine; PEN = pentosidine.
Fig 7
Fig 7
(A) The hydroxyapatite crystals within the MKR femurs' collagen fibrils were significantly thicker than those in the WT group. (B) Because crystal orientation ranges from 0 to 1, both the crystals in the diabetic and WT controls (ψ < 0.5) indicate orientation parallel to the axis of the bone, though not significantly different from each other. (C) The diabetic MKR group exhibited a significantly increased c‐axis length, which stems from its inverse relationship with the relative phosphate content of the hydroxyapatite crystals. (D) In addition to the increased growth, the MKR femora trended to exhibit more type‐B carbonate substitution within the inorganic when compared to the WT controls. (E) There was no difference in the relative amount of mineral determined by Raman peak of phosphate normalized to the amount of matrix determined by the Raman peak of Amide I. (F) There is no significant difference in the relative amount of mineral determined by Raman peak of less polarization‐dependent phosphate normalized to Amide III Raman peak representing the less polarization‐dependent matrix content. [Correction added on 15 February 2022, after first online publication: Figure 7 has been replaced]
Fig 8
Fig 8
(A) The initiation toughness (Ki), representative of the energy dissipation mechanisms imparted by the mineral component of bone's ECM, was significantly greater in the diabetic group compared to the WT controls. (B) The toughening effect (ΔK), the difference between the Kmax and Ki, another means of expressing the energy required to propagate a crack, is also reduced in the diabetic group. (C) The cracking toughness (Kcracking) represents the energy required to propagate a crack through the bone and is significantly reduced in the diabetic group compared to the WT. (D) The work‐to‐failure (Wf), which represents the work required to propagate a crack to failure normalized by the area resisting the load and the span length, was significantly reduced in the MKR group compared to the WT.
Fig 9
Fig 9
(A) Within the MKR group (black‐filled dots) there was a negative correlation between the cracking toughness and the accumulation of fAGEs, although these values do not correlate in the WT controls (black outlined, white filled dots). (B) There was a similar negative correlation between fAGEs and work‐to‐failure seen in the MKR group that was again absent in the WT controls. (C) The c‐axis length, a marker of bone mineral quality, had a positive correlation with CML/CH2‐wag between the groups. (D) The c‐axis length also had a positive correlation with PEN/CH2‐wag between the groups. (E) The maximum toughness had a negative correlation with CML/CH2‐wag which served a best predictor of maximum toughness. (F) The toughening effect had a negative correlation with PEN/CH2‐wag, which served as the best predictor of toughening effect (ΔK).

Similar articles

Cited by

References

    1. Shanbhogue VV, Hansen S, Frost M, et al. Compromised cortical bone compartment in type 2 diabetes mellitus patients with microvascular disease. Eur J Endocrinol. 2016;174(2):115‐124. 10.1530/EJE-15-0860. - DOI - PubMed
    1. Eckhardt BA, Rowsey JL, Thicke BS, et al. Accelerated osteocyte senescence and skeletal fragility in mice with type 2 diabetes. JCI Insight. 2020;5(9):e135236. 10.1172/jci.insight.135236. - DOI - PMC - PubMed
    1. Vaag A. On the pathophysiology of late onset non‐insulin dependent diabetes mellitus. Current controversies and new insights. Dan Med Bull. 1999;46(3):197‐234. - PubMed
    1. Evans AL, Paggiosi MA, Eastell R, Walsh JS. Bone density, microstructure and strength in obese and normal weight men and women in younger and older adulthood. J Bone Miner Res. 2015;30(5):920‐928. 10.1002/jbmr.2407. - DOI - PubMed
    1. Walsh JS, Vilaca T. Obesity, type 2 diabetes and bone in adults. Calcif Tissue Int. 2017;100(5):528‐535. 10.1007/s00223-016-0229-0. - DOI - PMC - PubMed

LinkOut - more resources