Review
. 2022 Mar 1;13(1):33.
doi: 10.1186/s13244-022-01177-9.

Multiparametric MRI evaluation of bone sarcomas in children

Affiliations
Review

Multiparametric MRI evaluation of bone sarcomas in children

Emilio J Inarejos Clemente et al. Insights Imaging. .

Abstract

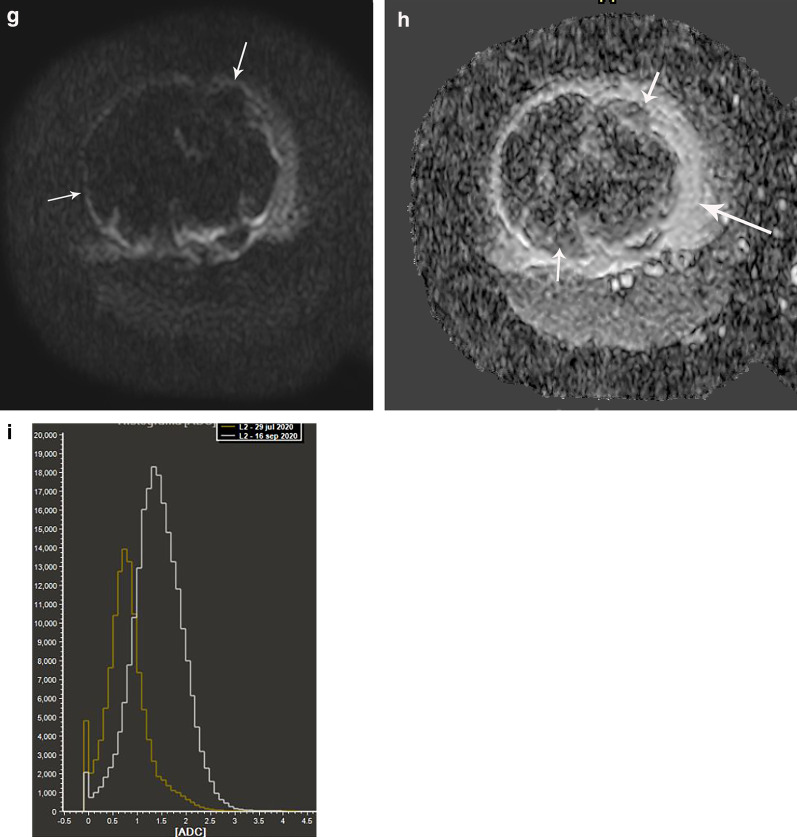
Osteosarcoma and Ewing sarcoma are the most common bone sarcomas in children. Their clinical presentation is very variable depending on the age of the patient and tumor location. MRI is the modality of choice to assess these bone sarcomas and has an important function at diagnosis and also for monitoring recurrence or tumor response. Anatomic sequences include T1- and T2-weighted images and provide morphological assessment that is crucial to localize the tumor and describe anatomical boundaries. Multiparametric MRI provides functional information that helps in the assessment of tumor response to therapy by using different imaging sequences and biomarkers. This review manuscript illustrates the role of MRI in osteosarcoma and Ewing sarcoma in the pediatric population, with emphasis on a functional perspective, highlighting the use of diffusion-weighted imaging and dynamic contrast-enhanced MRI at diagnosis, and during and after treatment.

Keywords: Ewing sarcoma; MRI; Osteosarcoma; Pediatric.


Conflict of interest statement

The authors declare that they have no competing interests.

Figures

Fig. 1
Fig. 1
Time intensity curves (TIC) in dynamic contrast-enhanced MRI. Type I profile represents necrosis or cystic changes; type II is associated with benignity, such as peritumoral edema; types III and IV with malignant processes; and type V with granulation tissue or fibrosis
Fig. 2
Fig. 2
Osteosarcoma of the proximal right tibia in a 16-year-old boy. a Axial ADC map shows low signal intensity of the tumor confirming restricted diffusion (*). b Axial DCE-MR image (left) with corresponding time intensity curve (TIC) (right) shows peripheral enhancement of the tumor (short arrows on the left) which correlates with a type III curve (pink and orange arrows on the TIC). The blue curve in the TIC shows the typical morphology of any peripheral artery (long arrow on the left). c Axial fat-suppressed T2-weighted MR image shows hyperintensity of the bone marrow (arrows) surrounding the tumor (T), in keeping with edema. d Axial DCE-MR image (left) and corresponding TIC (right) show progressive enhancement of the bone marrow (arrows) which correlates with a type II curve (orange and pink curves), indicating edema. The blue curve in the TIC shows the typical morphology of the peripheral artery. e Axial fat-suppressed T2-weighted MR image after 2 cycles of chemotherapy shows an area of predominantly low signal intensity within the tumor (arrow) that may represent fibrosis and/or calcification. f Axial DCE-MR image (left) with corresponding TIC (right) shows progressive enhancement of the peripheral area of the tumor (short arrows) with a type II curve (red, green and pink curves), indicating overall good treatment response and presence of granulation tissue. Note the lack of enhancement of the central part of the tumor (long arrow) due to necrosis that correlates with a type I curve (orange curve) indicating non-viable tumor or necrosis. The blue curve correlates with the typical morphology of a peripheral artery
Fig. 2
Fig. 2
Osteosarcoma of the proximal right tibia in a 16-year-old boy. a Axial ADC map shows low signal intensity of the tumor confirming restricted diffusion (*). b Axial DCE-MR image (left) with corresponding time intensity curve (TIC) (right) shows peripheral enhancement of the tumor (short arrows on the left) which correlates with a type III curve (pink and orange arrows on the TIC). The blue curve in the TIC shows the typical morphology of any peripheral artery (long arrow on the left). c Axial fat-suppressed T2-weighted MR image shows hyperintensity of the bone marrow (arrows) surrounding the tumor (T), in keeping with edema. d Axial DCE-MR image (left) and corresponding TIC (right) show progressive enhancement of the bone marrow (arrows) which correlates with a type II curve (orange and pink curves), indicating edema. The blue curve in the TIC shows the typical morphology of the peripheral artery. e Axial fat-suppressed T2-weighted MR image after 2 cycles of chemotherapy shows an area of predominantly low signal intensity within the tumor (arrow) that may represent fibrosis and/or calcification. f Axial DCE-MR image (left) with corresponding TIC (right) shows progressive enhancement of the peripheral area of the tumor (short arrows) with a type II curve (red, green and pink curves), indicating overall good treatment response and presence of granulation tissue. Note the lack of enhancement of the central part of the tumor (long arrow) due to necrosis that correlates with a type I curve (orange curve) indicating non-viable tumor or necrosis. The blue curve correlates with the typical morphology of a peripheral artery
Fig. 3
Fig. 3
Osteosarcoma involving the proximal metaphysis of the tibia in a 13-year-old boy. a Coronal fat-suppressed T2-weighted MR image shows a heterogeneous bone lesion (*) associated with a soft-tissue mass (arrow). b Axial ADC MR image shows diffusion restriction within the tumor (*). c, d Post-chemotherapy MRI. c Coronal fat-suppressed T2-weighted MR image shows a peripheral hypointense rim in the tumor suggestive of calcification (arrow). d Axial ADC MR image shows decrease of the areas of diffusion restriction (*) compared to the initial study, indicating good treatment response
Fig. 4
Fig. 4
Same patient as in Fig. 3a Axial DCE-MR image (left) with corresponding time intensity curve (TIC) (right) before treatment shows early peripheral enhancement of the tumor (long arrows), which correlates with types III and IV TIC (green curve) and no enhancement of the central part of the tumor (thick arrow), which correlates with a type I TIC (horizontal orange curve), suggestive of necrosis. Peritumoral edema (short arrow) correlates with a type II TIC (pink curve). The blue curve represents the arterial TIC. b Axial DCE-MR image (left) with corresponding TIC (right) after treatment shows enhancement of the residual tumor (short arrow), which correlates with a type III TIC (orange curve). There is no change of the tumor necrosis (green curve) or peritumoral edema (pink curve). c Volumetry and d histogram of ADC maps performed before and after treatment shows an increase of the ADC mean values from 1.22 mm2/s to 1.41 mm2/s. e) ADC image after treatment shows residual tumor (short arrows)
Fig. 4
Fig. 4
Same patient as in Fig. 3a Axial DCE-MR image (left) with corresponding time intensity curve (TIC) (right) before treatment shows early peripheral enhancement of the tumor (long arrows), which correlates with types III and IV TIC (green curve) and no enhancement of the central part of the tumor (thick arrow), which correlates with a type I TIC (horizontal orange curve), suggestive of necrosis. Peritumoral edema (short arrow) correlates with a type II TIC (pink curve). The blue curve represents the arterial TIC. b Axial DCE-MR image (left) with corresponding TIC (right) after treatment shows enhancement of the residual tumor (short arrow), which correlates with a type III TIC (orange curve). There is no change of the tumor necrosis (green curve) or peritumoral edema (pink curve). c Volumetry and d histogram of ADC maps performed before and after treatment shows an increase of the ADC mean values from 1.22 mm2/s to 1.41 mm2/s. e) ADC image after treatment shows residual tumor (short arrows)
Fig. 5
Fig. 5
Ewing sarcoma involving the proximal left humerus in a 12-year-old boy. a Sagittal contrast-enhanced fat-suppressed T1-weighted MR image shows a heterogeneous mass centered in the proximal humeral metaphysis (*) that extends to the epiphysis and proximal diaphysis and contains foci of internal necrosis (short arrow). Note severe varus angulation of the humerus due to previous fracture (long arrow). b Axial ADC MR image shows restricted diffusion of the cellular areas (*) with no restriction of the necrotic foci (arrow). c Sagittal contrast-enhanced fat-suppressed T1-weighted MR image after treatment shows decrease in volume of the mass with increase of necrotic areas (arrows). d Axial ADC MR image after treatment shows no restricted diffusion (*). e Volumetry of ADC maps performed before treatment shows a high and sharp ADC histogram of 0.7 mm2/s, while the histogram after treatment is short and wide and shifted to the right, with a value of 1.9 mm2/s. The conventional MRI sequences together with DWI indicate good treatment response
Fig. 6
Fig. 6
Ewing sarcoma involving the sphenoid bone in a 15-year-old boy. a Axial contrast-enhanced fat-suppressed T1-weighted MR image of the orbits shows a heterogeneously hyperintense mass (*) arising from the sphenoid bone with internal necrosis (arrow). b Axial ADC map shows restricted diffusion of the mass (*). c Axial contrast-enhanced fat-suppressed T1-weighted MR image performed after 2 cycles of chemotherapy shows decrease in volume of the mass with heterogeneous enhancement of the residual tumor (*). d Axial ADC maps shows no restriction of the residual mass (*). e Axial contrast-enhanced fat-suppressed T1-weighted MR image performed after 3 cycles of chemotherapy shows residual enhancing tissue (arrow). f Axial ADC map shows no restriction (arrow). g Volumetry of ADC maps performed before (yellow) during (white) and after (purple) treatment. Before chemotherapy, the tumor volume is 12 cc with corresponding high and sharp ADC (yellow) histogram of 0.49 mm2/s. During treatment, the volume does not significantly change (11 cc), but the corresponding volumetric ADC (white) histogram increases to 1.85 mm2/s, appearing short, wide and shifted to the right. After treatment, the volume decreases to 1.35 cc and the ADC (purple) histogram does not change (1.85 mm2/s). Overall, this indicates good treatment response
Fig. 7
Fig. 7
Ewing sarcoma of the distal femur in a 9-year-old boy. a-d) Pre-treatment. a Axial contrast-enhanced fat-suppressed T1-weighted MR image before treatment shows a large tumor heterogeneously enhancing (short arrows) with internal necrosis (*). b Automated volumetry of the mass is around 285 cc. c and d Axial DWI and ADC map images show restricted diffusion in the periphery of the lesion (arrows). Post-treatment. e Axial contrast-enhanced fat-suppressed T1-weighted MR image after treatment shows increase of the internal necrosis of the mass (*) with persisting peripheral enhancement (short arrows). Note soft tissue inflammation not present in the previous MRI (long arrow). f Automated volumetry of the mass is around 350 cc. g and h Axial DWI and ADC map images show mild linear restricted diffusion of the periphery (arrows). i Histogram of ADC maps performed before and after treatment shows an increase of the ADC mean values from 0.79 mm2/s to 1.41 mm2/s
Fig. 7
Fig. 7
Ewing sarcoma of the distal femur in a 9-year-old boy. a-d) Pre-treatment. a Axial contrast-enhanced fat-suppressed T1-weighted MR image before treatment shows a large tumor heterogeneously enhancing (short arrows) with internal necrosis (*). b Automated volumetry of the mass is around 285 cc. c and d Axial DWI and ADC map images show restricted diffusion in the periphery of the lesion (arrows). Post-treatment. e Axial contrast-enhanced fat-suppressed T1-weighted MR image after treatment shows increase of the internal necrosis of the mass (*) with persisting peripheral enhancement (short arrows). Note soft tissue inflammation not present in the previous MRI (long arrow). f Automated volumetry of the mass is around 350 cc. g and h Axial DWI and ADC map images show mild linear restricted diffusion of the periphery (arrows). i Histogram of ADC maps performed before and after treatment shows an increase of the ADC mean values from 0.79 mm2/s to 1.41 mm2/s

References

    1. WHO Classification of Tumours Editorial Board . Soft tissue and bone tumours. Lyon, France: International Agency for Research on Cancer Press; 2020.
    1. Kaste SC. Imaging pediatric bone sarcomas. Radiol Clin North Am. 2011;49:749–765. - PMC - PubMed
    1. McCarville MB, Chen JY, Coleman JL, et al. Distinguishing osteomyelitis from Ewing sarcoma on radiography and MRI. AJR Am J Roentgenol. 2015;205:640–650. - PMC - PubMed
    1. Wang CS, Yin QH, Liao JS, et al. Primary diaphyseal osteosarcoma in long bones: imaging features and tumor characteristics. Eur J Radiol. 2012;81:3397–3403. - PubMed
    1. Alsharief AN, Martinez-Rios C, Hopyan S, Amirabadi A, Doria AS, Greer MLC. Usefulness of diffusion-weighted MRI in the initial assessment of osseous sarcomas in children and adolescents. Pediatr Radiol. 2019;49:1201–1208. - PubMed

LinkOut - more resources