. 2022 May;31(9):2562-2577.
doi: 10.1111/mec.16415. Epub 2022 Mar 15.

Combining population genomics with demographic analyses highlights habitat patchiness and larval dispersal as determinants of connectivity in coastal fish species

Affiliations

Combining population genomics with demographic analyses highlights habitat patchiness and larval dispersal as determinants of connectivity in coastal fish species

Halvor Knutsen et al. Mol Ecol. 2022 May.

Abstract

Gene flow shapes spatial genetic structure and the potential for local adaptation. Among marine animals with nonmigratory adults, the presence or absence of a pelagic larval stage is thought to be a key determinant in shaping gene flow and the genetic structure of populations. In addition, the spatial distribution of suitable habitats is expected to influence the distribution of biological populations and their connectivity patterns. We used whole genome sequencing to study demographic history and reduced representation (double-digest restriction associated DNA) sequencing data to analyse spatial genetic structure in broadnosed pipefish (Syngnathus typhle). Its main habitat is eelgrass beds, which are patchily distributed along the study area in southern Norway. Demographic connectivity among populations was inferred from long-term (~30-year) population counts that uncovered a rapid decline in spatial correlations in abundance with distance as short as ~2 km. These findings were contrasted with data for two other fish species that have a pelagic larval stage (corkwing wrasse, Symphodus melops; black goby, Gobius niger). For these latter species, we found wider spatial scales of connectivity and weaker genetic isolation-by-distance patterns, except where both species experienced a strong barrier to gene flow, seemingly due to lack of suitable habitat. Our findings verify expectations that a fragmented habitat and absence of a pelagic larval stage promote genetic structure, while presence of a pelagic larvae stage increases demographic connectivity and gene flow, except perhaps over extensive habitat gaps.

Keywords: coastal; comparative study; gene flow; genomics; habitat patchiness; isolation by distance; larval drift; marine fish.


Conflict of interest statement

We declare we have no competing interests.

Figures
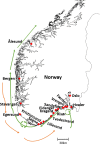
FIGURE 1
FIGURE 1
Map over all sampling localities (red dots) with the names of the location. Orange arrows denote Atlantic water masses coming towards Norway, while green arrows denote the main pathway for the Norwegian coastal current (redrawn from Sætre, , p. 100). See Table 1 for details of the number of fish from each location
FIGURE 2
FIGURE 2
The estimated demographic history using smc++ on whole genome sequencing data from individuals from two populations of pipefish in Norway using 10 iterations each. The samples included individuals (n = 4) from Ålesund (the western Norwegian coast) and Tvedestrand (the Skagerrak coast: Figure 1), respectively. The results suggest a shared history, with a decline in the west at 1000 years before present, possibly causing increasing genetic drift over this period
FIGURE 3
FIGURE 3
PCA plot of broadnosed pipefish from the study area, grouped by sample locality (Table 1, Figure 1), using the 1461 SNP ddRAD data set
FIGURE 4
FIGURE 4
Observed genetic divergence (F ST: dots) as a function of geographical distance and size of largest habitat gap between pairs of samples (both in km). The optimal MLPE regression model (cf. Table 3) is depicted as a plane, with observed F ST falling below the model prediction coloured grey and those lying above in black. Square symbols depict sample pairs with the Egersund sample
FIGURE 5
FIGURE 5
Comparing patterns of genetic divergence (F ST) among three fish species inhabiting the same coast. For each species, pairwise F ST between the easternmost (Hvaler or Oslofjord, cf. Figure 1) and the other samples (symbols) is plotted against geographical distance over water. (a) Nonlinear regression (using the nls function with a sigmoid response curve in R) illustrating the abrupt shift or “break” in genetic divergence at around 400 km (between Egersund and Stavanger) for the corkwing wrasse and the black goby. (b) The same data as in (a), with separate linear regressions on either side of the break. Note the marked increase in F ST with distance for pipefish, while there were nonsignificant trends in IBD for black goby and corkwing wrasse on either side of the break
FIGURE 6
FIGURE 6
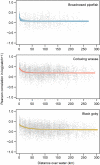
Pairwise correlations among time‐series of catches at stations along the Norwegian Skagerrak coast (cf. Figure 1) (grey points here) for pipefish, black goby and corkwing wrasse. Solid coloured lines show a fitted exponential decay model along with bootstrapped 90% confidence intervals (shaded areas). Confidence intervals are based on 10,000 bootstrap replicates (Bjørnstad et al., 1999)
FIGURE 7
FIGURE 7
Estimated decorrelation scale (v) in kilometres (km) for three species based on the distance–decay of correlations in beach‐seine catches in the Skagerrak. Points show model estimates, thick bars show bootstrapped 25% and 75% quartiles and thin lines show bootstrapped 5% and 95% quantiles

Similar articles

Cited by

References

    1. Allen, T. F. H. , & Hoekstra, T. W. (1992). Towards a unified ecology (p. 384). Columbia University Press.
    1. Allendorf, F. W. (2017). Genetics and the conservation of natural populations: Allozymes to genomes. Molecular Ecology, 26, 420–430. 10.1111/mec.13948 - DOI - PubMed
    1. Amante, C. , & Eakins, B. W. (2009). ETOPO1 1 arc‐minute global relief model: Procedures, datasources and analysis (pp. 19). NOAA Technical Memorandum NESDIS NGDC‐24.
    1. Ashe, J. L. , Feldheim, K. A. , Fields, A. T. , Reyier, E. A. , Brooks, E. J. , O’Connell, M. T. , Skomal, G. , Gruber, S. H. , & Chapman, D. D. (2015). Local population structure and context‐dependent isolation by distance in a large coastal shark. Marine Ecology Progress Series, 520, 203–216. 10.3354/meps11069 - DOI
    1. Barry, P. , Broquet, T. , & Gagnaire, P. A. (2021). Age‐specific survivorship and fecundity shape genetic diversity in marine fishes. Evolution Letters, 6(1), 46–62. 10.1002/evl3.265 - DOI - PMC - PubMed

Publication types

LinkOut - more resources