. 2022 Mar 1:11:e69223.
doi: 10.7554/eLife.69223.

GFPT2/GFAT2 and AMDHD2 act in tandem to control the hexosamine pathway

Affiliations

GFPT2/GFAT2 and AMDHD2 act in tandem to control the hexosamine pathway

Virginia Kroef et al. Elife. .

Abstract

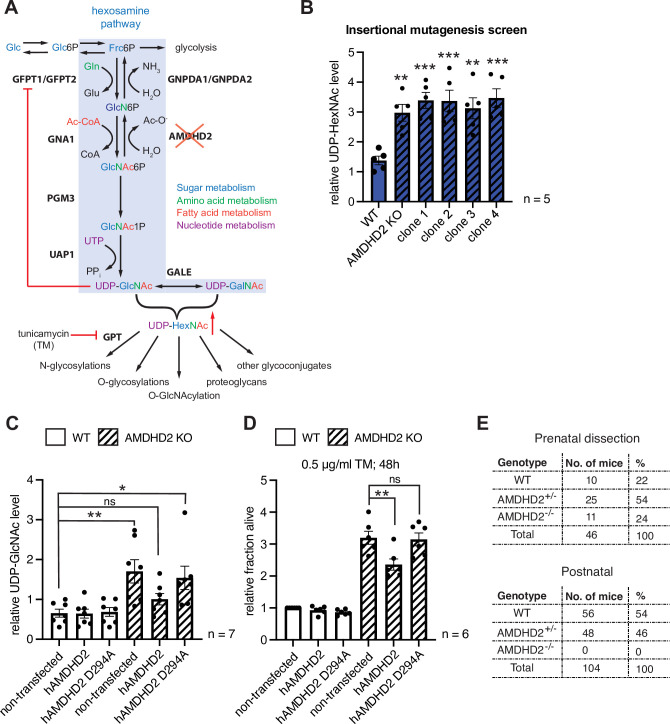
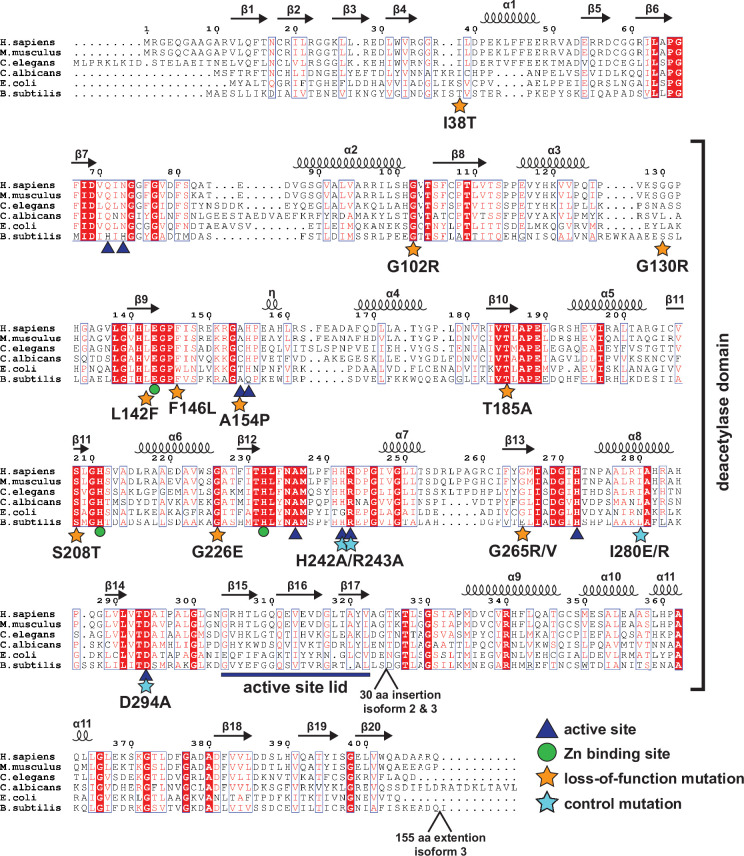
The hexosamine biosynthetic pathway (HBP) produces the essential metabolite UDP-GlcNAc and plays a key role in metabolism, health, and aging. The HBP is controlled by its rate-limiting enzyme glutamine fructose-6-phosphate amidotransferase (GFPT/GFAT) that is directly inhibited by UDP-GlcNAc in a feedback loop. HBP regulation by GFPT is well studied but other HBP regulators have remained obscure. Elevated UDP-GlcNAc levels counteract the glycosylation toxin tunicamycin (TM), and thus we screened for TM resistance in haploid mouse embryonic stem cells (mESCs) using random chemical mutagenesis to determine alternative HBP regulation. We identified the N-acetylglucosamine deacetylase AMDHD2 that catalyzes a reverse reaction in the HBP and its loss strongly elevated UDP-GlcNAc. To better understand AMDHD2, we solved the crystal structure and found that loss-of-function (LOF) is caused by protein destabilization or interference with its catalytic activity. Finally, we show that mESCs express AMDHD2 together with GFPT2 instead of the more common paralog GFPT1. Compared with GFPT1, GFPT2 had a much lower sensitivity to UDP-GlcNAc inhibition, explaining how AMDHD2 LOF resulted in HBP activation. This HBP configuration in which AMDHD2 serves to balance GFPT2 activity was also observed in other mESCs and, consistently, the GFPT2:GFPT1 ratio decreased with differentiation of human embryonic stem cells. Taken together, our data reveal a critical function of AMDHD2 in limiting UDP-GlcNAc production in cells that use GFPT2 for metabolite entry into the HBP.

Keywords: AMDHD2; biochemistry; chemical biology; genetics; genomics; gfat2; haploid mouse embryonic stem cells; hexosamine pathway; mouse; mutagenesis screen; x-ray crystallography.


Conflict of interest statement

VK, SR, MH, KA, LE, SB, SM, UE, BS, UB, MD No competing interests declared

Figures

Figure 1.
Figure 1.. Chemical mutagenesis screen for tunicamycin (TM) resistance in haploid mESCs identifies AMDHD2.
(A) Schematic representation of experimental workflow for TM resistance screen using ENU mutagenesis in combination with whole-exome sequencing. (B) Schematic representation of the mouse Amdhd2 locus. Amino acid substitutions identified in the screen are highlighted. (C) Cell viability (XTT assay) of four TM resistant clones (clones 1–4) identified via insertional mutagenesis compared to control wild-type (WT) AN3-12 mESCs. Cells were treated with 0.5 µg/ml TM for 48 hr (mean ± SEM, n=4, *p<0.05, **p<0.01, one-way ANOVA Dunnett’s posttest). (D) Western blot analysis of CRISPR/Cas9 generated AMDHD2 KO AN3-12 mESCs compared to WT cells. (E) Cell viability (XTT assay) of WT and AMDHD2 KO AN3-12 cells treated with 0.5 µg/ml TM for 48 hr (mean ± SEM, n=4, **p<0.01, unpaired t-test). (F) Representative images of WT and AMDHD2 KO AN3-12 cells treated with 0.5 µg/ml TM for 48 hr or respective control. Scale bar, 275 µm. mESC, mouse embryonic stem cell.
Figure 1—figure supplement 1.
Figure 1—figure supplement 1.. Chemical mutagenesis screen for tunicamycin (TM) resistance in haploid mESCs identifies AMDHD2.
Identification and confirmation of AMDHD2 as the causative gene for mediating TM resistance by elevated UDP-GlcNAc levels. (A) Representative cell viability (XTT assay) of WT AN3-12 mESCs and four TM resistant clones (clones A–D) identified by the chemical (ENU) mutagenesis and that were used for whole-exome sequencing. Cells were treated with 0.5 µg/ml TM for 48 hr. (B) Table listing all mutations in the Amdhd2 locus identified in the TM resistance screen. (C) Schematic representation of experimental workflow for TM resistance screen using retroviral-based gene-trap insertional mutagenesis. (D) Cell viability (XTT assay) of WT and two additional AMDHD2 KO AN3-12 cell lines (#2–3), generated with distinct guide combinations. Cells were treated with 0.5 µg/ml TM for 48 hr (mean ± SEM, n=6, ***p<0.001, one-way ANOVA Dunnett’s posttest). mESC, mouse embryonic stem cell; WT, wild-type.
Figure 2.
Figure 2.. Disruption of Amdhd2 mediates tunicamycin (TM) resistance via elevated HBP flux.
(A) Schematic overview of the hexosamine pathway (blue box). The intermediate Frc6P from glycolysis is converted to UDP-GlcNAc, which is a precursor for glycosylation reactions. The enzymes are glutamine fructose-6-phosphate amidotransferase (GFPT1/2), glucosamine-6-phosphate N-acetyltransferase (GNA1), phosphoglucomutase (PGM3), UDP-N-acetylglucosamine pyrophosphorylase (UAP1), glucosamine-6-phosphate deaminase (GNPDA1/2), N-acetylglucosamine deacetylase (AMDHD2), UDP-GlcNAc:dolichylphosphate GlcNAc-1-phosphotransferase (GPT), and UDP-galactose-4′-epimerase (GALE). Red line indicates negative feedback inhibition of GFPT by UDP-GlcNAc. UDP-HexNAc is a precursor for various glycosylation reactions including N-glycosylation, O-glycosylation, and O-GlcNAcylation or the synthesis of proteoglycans and other glycoconjugates. N-glycosylation is inhibited by TM. (B) ICMS analysis of UDP-HexNAc levels of four TM resistant clones (clones 1–4) generated in insertional mutagenesis screen compared to control WT and AMDHD2 KO AN3-12 mESCs (mean ± SEM, n=5, **p<0.01, ***p<0.001, one-way ANOVA Dunnett’s posttest). (C) IC-MS analysis of UDP-GlcNAc levels in WT and AMDHD2 KO AN3-12 cells expressing WT FLAGHA-hAMDHD2 (hAMDHD2) and mutant FLAG-HA-hAMDHD2 D294A (hAMDHD2 D294A) (mean ± SEM, n=7, *p<0.05, **p<0.01, ns=not significant, one-way ANOVA Tukey posttest). (D) Cell viability (XTT assay) of WT and AMDHD2 KO AN3-12 mESCs expressing WT FLAG-HA-hAMDHD2 (hAMDHD2) and mutant FLAG-HA-hAMDHD2 D294 (hAMDHD2 D294A). Cells were treated with 0.5 µg/ml TM for 48 hr (mean ± SEM, n=6, **p<0.01, ns=not significant, one-way ANOVA Tukey posttest). (E) Genotyping results for the AMDHD2 deletion in dissected (E7–8) embryos and weaned mice. HBP, hexosamine biosynthetic pathway; mESC, mouse embryonic stem cell; WT, wild-type.
Figure 2—figure supplement 1.
Figure 2—figure supplement 1.. Disruption of Amdhd2 mediates tunicamycin resistance via elevated HBP flux.
AMDHD2 disruption in AN3-12 mESCs increases HBP flux. UDP-HexNAc concentration of the two additional AMDHD2 KO cell lines (#2–3), generated with distinct guide combinations compared to WT AN3-12 mESCs (mean ± SEM, n≥3, ***p<0.001, one-way ANOVA). UDP-HexNAc is the combined pool of the UDP-GlcNAc and UDP-GalNAc epimer pools. HBP, hexosamine biosynthetic pathway; mESC, mouse embryonic stem cell; WT, wild-type.
Figure 2—figure supplement 2.
Figure 2—figure supplement 2.. Generation of different AN3-12 mESC lines stably overexpressing WT FLAG-HA-hAMDHD2 and mutant FLAG-HA-hAMDHD2 D294A protein.
(A) Western blot analysis of AMDHD2 expression in WT and AMDHD2 KO AN3-12 cells expressing WT FLAG-HA-hAMDHD2 (hAMDHD2) and mutant FLAG-HA-hAMDHD2 D294A (hAMDHD2 D294A). The asterisk (*) indicates the band for the recombinant WT FLAG-HA-hAMDHD2 and mutant FLAG-HA-hAMDHD2 D294A protein. The lower band deemed to be a mixture of endogenous mAMDHD2 and recombinant hAMDHD2/hAMDHD2 D294A protein upon cleavage of the N-terminal FLAG-HA-tag. (B) Western blot analysis of FLAG expression in WT and AMDHD2 KO AN3-12 cells expressing WT FLAGHA-hAMDHD2 (hAMDHD2) and mutant FLAG-HA-hAMDHD2 D294A (hAMDHD2 D294A). mESC, mouse embryonic stem cell; WT, wild-type.
Figure 2—figure supplement 3.
Figure 2—figure supplement 3.. Generation of AMDHD2 KO founder mice.
(A) Schematic representation of the CRISPR/Cas9-targeted exon of the mouse Amdhd2 locus. Deletions in founder lines 1–4 are indicated in red. (B) Table listing used guide combinations and deletion details of the AMDHD2 KO founder lines. (C) Representative genotyping results of heterozygous AMDHD2 KO mice. The WT PCR product is 675 bp and the Amdhd2 KO allele shows a size of 300 bp (mouse line 1). WT, wild-type.
Figure 3.
Figure 3.. Structural and biochemical characterization of human AMDHD2.
(A) Influence of divalent addition (10 µM) on the stability of AMDHD2 in size-exclusion chromatography (SEC) buffer in thermal shift assays (mean + SEM, n=3, ns=not significant, ***p<0.0001 versus wild-type (WT), one-way ANOVA). (B) Deacetylase activity of AMDHD2 in the presence of EDTA and several indicated divalents (mean + SEM, n=3, ns=not significant, *p<0.05, ***p<0.0001 versus WT, one-way ANOVA). (C) Overview of the human AMDHD2 dimer in cartoon representation. Monomer A is colored in gray and monomer B in blue. The two deacetylase domains are interacting with each other. The DUF domain is formed by residues of the N-terminus (light gray and light blue) and residues of the C-terminus (black and dark blue). GlcN6P (yellow sticks), Zn2+ (green sphere), and the putative active site lid (wheat) are highlighted. (D) Domains and secondary structure elements within one AMDHD2 monomer. The deacetylase domain (left) shows a TIM barrel-like fold, while the small DUF domain (right) is composed of a β-sandwich fold. α-helices are colored in blue, β-strands in red, and loops in gray. GlcN6P (yellow sticks) and Zn2+ (green sphere) are highlighted. (E) Close-up view of the active site in cartoon representation. Residues involved in ligand binding or catalysis are highlighted as sticks, as well as GlcN6P (yellow sticks), Zn2+ (green sphere), and two water molecules (red spheres). The GlcN6P binding site is formed by two deacetylase domains. Black dashed lines indicate key interactions to GlcN6P and green dashed lines the coordination of Zn2+. (F) Close-up view of the dimer interface in cartoon representation. His242, Arg243, and Ile280, which were mutated for further characterization of the dimer, are highlighted as sticks. (G) Representative chromatogram of an analytical SEC of human AMDHD2 variants using a Superdex 200 Increase 10/300 GL column. Absorption at 280 nm (mAU: milli absorbance units) was plotted against the elution volume. (H) Molecular weight of human AMDHD2 based on analytical SEC measurements (mean + SD, n=3.) (I) Deacetylase activity of wild-type (WT) and mutant human AMDHD2 (mean + SEM, n=6, ***p<0.0001 versus WT, one-way ANOVA). (J) Anomalous map of Zn2+ with a contour level of 5.0 RMSD (violet).Figure 3—source data 1
Figure 3—figure supplement 1.
Figure 3—figure supplement 1.. Structural and biochemical characterization of human AMDHD2.
Stereo image of the human AMDHD2 dimer in cartoon representation. Monomer A is colored in gray and monomer B in blue. The two deacetylase domains are interacting with each other. The DUF domain is formed by residues of the N-terminus (light gray and light blue) and residues of the C-terminus (black and dark blue). GlcN6P (yellow sticks), Zn2+ (green sphere), and the putative active site lid (wheat) are highlighted.
Figure 3—figure supplement 2.
Figure 3—figure supplement 2.. B-factor representation of WT human AMDHD2.
The protein is presented as putty cartoon and colored from low to high B-factors (24–108 A2, blue to red). WT, wild-type.
Figure 3—figure supplement 3.
Figure 3—figure supplement 3.. Oligomeric state of human AMDHD2.
Representative DLS measurement of WT AMDHD2. Table: Parameters of the representative DLS measurement showing a dimeric assembly. DLS, dynamic light scattering; WT, wild-type.
Figure 3—figure supplement 4.
Figure 3—figure supplement 4.. Superposition of GlcN6P-bound AMDHD2 monomer A (gray) and monomer B (blue) in cartoon representation.
GlcN6P (yellow sticks) and Zn2+ (green spheres) are highlighted.
Figure 3—figure supplement 5.
Figure 3—figure supplement 5.. Close-up view of the active site in cartoon representation.
Residues involved in ligand binding or catalysis are highlighted as sticks, as well as GlcN6P (yellow sticks), Zn2+ (green sphere), and two water molecules (red spheres). Three antiparallel β-strands (β15–β17, colored wheat) build a β-sheet close to the active site.
Figure 3—figure supplement 6.
Figure 3—figure supplement 6.. Superposition of the structures of GlcN6P-bound (gray and blue) and GlcN6P-free (green and red) human AMDHD2 with RMSD of 0.67 Å over 792 main chain residues in cartoon representation.
GlcN6P (yellow sticks) and Zn2+ (green spheres) are highlighted.
Figure 3—figure supplement 7.
Figure 3—figure supplement 7.. Active site of human AMDHD2.
(A) Omit map of the active site of human AMDHD2 in cartoon representation. Residues involved in ligand binding or catalysis are highlighted as sticks, as well as GlcN6P (yellow sticks). The Fo-Fc omit map is colored in green and its contour level is at 1.5 RMSD. (B) 2D ligand-protein interaction diagram of GlcN6P interacting with human AMDHD2. Ligand bonds are colored in gray and amino acid side chain bonds in black. Green dashed lines indicate hydrogen bonds and red spiked arcs present residues making nonbonded contacts with the ligands.
Figure 3—figure supplement 8.
Figure 3—figure supplement 8.. Protein sequence alignment of AMDHD2.
Red boxes indicate identical residues, red letters indicate similar residues. The deacetylase domain and secondary structure elements are annotated, as well as the positions of insertions and extensions in AMDHD2 isoform 2 and isoform 3. Residues involved in product binding, catalysis, or metal binding are highlighted. The putative active site lid is marked. Moreover, the positions of the potential LOF mutations and the control mutations are labeled.
Figure 3—figure supplement 9.
Figure 3—figure supplement 9.. Deacetylase activity of human AMDHD2 toward GlcNAc6P, GalNAc6P, and GlcNAc6S (mean + SEM, n=6, ***p<0.0001 versus GlcNAc6P, one-way ANOVA).
Figure 4.
Figure 4.. Characterization of AMDHD2 loss-of-function (LOF) mutants.
(A) SDS-gels stained with Coomassie brilliant blue of a representative bacterial test expression of the human AMDHD2 variants. The experiment was repeated three times with similar results. BI: before induction, AI: after induction, TL: total lysate, SN: soluble fraction/supernatant. A band corresponding to the molecular weight of human AMDHD2 with His6-tag (46 kDa) was present in all total lysates after induction. (B) Overview of the position of the potential LOF mutations in human AMDHD2 in cartoon representation. GlcN6P (yellow sticks), the metal co-factor (green spheres), the active site Asp294 (violet sticks), and the 11 putative LOF mutations (cyan sticks) are highlighted. (C) Deacetylase activity of wild-type (WT) and mutant human AMDHD2 (mean + SEM, n=6, ***p<0.0001 versus WT, one-way ANOVA).Figure 4—source data 1
Figure 4—figure supplement 1.
Figure 4—figure supplement 1.. Characterization of AMDHD2 loss-of-function mutants.
SDS-gels stained with Coomassie brilliant blue of a representative bacterial test expression of the human AMDHD2 variants. The experiment was repeated three times with similar results. BI: before induction, AI: after induction, TL: total lysate, SN: soluble fraction/ supernatant, PL: pellet fraction solubilized in 8 M urea.
Figure 5.
Figure 5.. AMDHD2 limits HBP activity when GFPT2 replaces GFPT1 as the first enzyme.
(A) Relative GFPT1 and GFPT2 mRNA levels (qPCR) in WT AN3-12 cells (mean ± SEM, n=4, ***p<0.001, unpaired t-test). (B) Western blot analysis of purified human GFPT1 and GFPT2 protein lysates of indicated cell lines. (C) Western blot analysis of AMDHD2 in indicated cell lines. (D) IC-MS analysis of UDP-GlcNAc levels in WT and AMDHD2 KO AN3-12 mESCs and N2a cells (mean ± SEM, n=5, ***p<0.001, one-way ANOVA). (E) Representative UDP-GlcNAc dose-response assay with hGFPT1 (black circle) and hGFPT2 (teal square) (mean ± SD, n=3). (F) Relative UDP-GlcNAc levels in indicated cell lines measured by IC-MS. Levels are normalized to those in AN3-12 mESCs (mean ± SEM, n≥3, ***p< 0.001, one-way ANOVA). (G) Western blot analysis of O-GlcNAc-modified proteins (RL2), OGA, OGT, and tubulin in the indicated cell lines. (H–J) Quantification of Western blot in (G) (mean ± SD, n=4, *p<0.05, **p<0.01, ***p<0.001, ns=not significant, one-way ANOVA Dunnett’s posttest).Figure 5—source data 1 HBP, hexosamine biosynthetic pathway; WT, wild-type.
Figure 5—figure supplement 1.
Figure 5—figure supplement 1.. AMDHD2 limits HBP activity when GFPT2 replaces GFPT1 as the first enzyme.
Manipulation of GFPT1 in AN3-12 cells has no influence on UDP-GlcNAc levels. IC-MS analysis of relative UDP-GlcNAc levels of WT, GFPT1 G451E, GFPT1 KO, and AMDHD2 KO AN3-12 cells (mean ± SEM, n=7, ***p<0.001, one-way ANOVA Dunnett’s posttest). HBP, hexosamine biosynthetic pathway; WT, wild-type.
Figure 5—figure supplement 2.
Figure 5—figure supplement 2.. Deletion of AMDHD2 has no effect on HBP flux in C2C12 myoblasts.
(A) Western blot analysis of AMDHD2 expression in two AMDHD2 KO lines (clones 1–2) compared to WT C2C12 myoblasts. (B) IC-MS analysis of relative UDP-GlcNAc levels of two AMDHD2 KO lines (clones 1–2) compared to WT C2C12 myoblasts (mean ± SEM, n=6, ns=not significant, one-way ANOVA Dunnett’s posttest). HBP, hexosamine biosynthetic pathway; WT, wild-type.
Figure 5—figure supplement 3.
Figure 5—figure supplement 3.. Biochemical characterization of human GFPT2 compared to human GFPT1.
(A) L-Gln kinetic of WT human GFPT1 (black circle) and WT human GFPT2 (teal square) (mean ± SEM, hGFPT1 n=5, hGFPT2 n=4). (B) Frc6P kinetic of WT hGFPT1 (black circle) and WT hGFPT2 (teal square) (mean ± SEM, hGFPT1 n=5, hGFPT2 n=8). WT, wild-type.
Figure 6.
Figure 6.. Differentiation of ESCs induces an enzymatic reconfiguration of the HBP by reducing the GFPT2:GFPT1 ratio.
(A) Western blot analysis and quantification (mean ± SD, n=4, *p<0.05, unpaired t-test) of GFPT2 in WT AN3-12 control cells and upon partial differentiation by a 5-day LIF removal. (B) Relative Gfpt2 mRNA level (qPCR) in WT AN3-12 cells and upon partial differentiation by a 5-day LIF removal (mean ± SEM, n=4, *p<0.05, unpaired t-test). (C) Relative GFPT2/GFPT1 mRNA and GFPT2/GFPT1 protein ratios in human ESCs and upon differentiation into cardiomyocytes (data obtained from: Frank et al., 2019; Bartsch et al., 2021). (D) Relative GFPT2/GFPT1 mRNA and GFPT2/GFPT1 protein ratios in human ESCs and upon differentiation into neurons (data obtained from: Saez et al., 2018). (E) Model: enzymatic configuration of the HBP in ESCs and somatic cells. The HBP (blue box) generates UDP-GlcNAc in multiple enzymatic steps. While ESCs mainly rely on GFPT2, more differentiated cells use GFPT1 for HBP entry. GFPT2 is less susceptible to UDP-GlcNAc inhibition than GFPT1 (indicated by red arrow). As an alternative regulatory mechanism ESCs require AMDHD2. Differentiation of ESCs induces an HBP reconfiguration, resulting in a decreased GFPT2:GFPT1 ratio. GFPT: glutamine fructose-6-phosphate amidotransferase, GNPDA: D-glucosamine-6-phosphate deaminase, GNA1: D-glucosamine-6-phosphate-Nacetyltransferase, AMDHD2: N-acetylglucosamine-6-phosphatedeacetylase, PGM3: phosphoglucomutase, UAP1: UDP-N-acetylglucosamine pyrophosphorylase.Figure 6—source data 1 ESC, embryonic stem cell; HBP, hexosamine biosynthetic pathway; LIF, leukemia inhibitory factor; WT, wild-type.
Figure 6—figure supplement 1.
Figure 6—figure supplement 1.. Differentiation of ESCs induces an enzymatic reconfiguration of the HBP by reducing the GFPT2:GFPT1 ratio.
The effect of partial differentiation upon LIF removal in AN3-12 cells on the enzymatic HBP composition. (A) Relative Nanog and Klf4 mRNA-level (qPCR) of WT AN3-12 cells and upon partial differentiation by 5 days of LIF removal (mean ± SEM, n=4, ns=not significant, unpaired t-test). (B) Relative Gfpt1 and Amdhd2 mRNA-level (qPCR) of WT AN3-12 cells and upon partial differentiation by 5 days of LIF removal (mean ± SEM, n=4, ns=not significant, unpaired t-test). (C) Representative Western blot analysis of GFPT1 and AMDHD2 in WT AN3-12 cells and upon partial differentiation by 5 days of LIF removal. (D) Quantification of Western blot as shown in (C) (mean ± SD, n=4, ns=not significant, unpaired t-test). ESC, embryonic stem cell; HBP, hexosamine biosynthetic pathway; LIF, leukemia inhibitory factor; WT, wild-type.
Author response image 1.
Author response image 2.

Similar articles

Cited by

References

    1. Adams PD, Afonine PV, Bunkóczi G, Chen VB, Davis IW, Echols N, Headd JJ, Hung L-W, Kapral GJ, Grosse-Kunstleve RW, McCoy AJ, Moriarty NW, Oeffner R, Read RJ, Richardson DC, Richardson JS, Terwilliger TC, Zwart PH. PHENIX: a comprehensive Python-based system for macromolecular structure solution. Acta Crystallographica. Section D, Biological Crystallography. 2010;66:213–221. doi: 10.1107/S0907444909052925. - DOI - PMC - PubMed
    1. Ahangar MS, Furze CM, Guy CS, Cooper C, Maskew KS, Graham B, Cameron AD, Fullam E. Structural and functional determination of homologs of the Mycobacterium tuberculosis N-acetylglucosamine-6-phosphate deacetylase (NagA) The Journal of Biological Chemistry. 2018;293:9770–9783. doi: 10.1074/jbc.RA118.002597. - DOI - PMC - PubMed
    1. Allmeroth K, Horn M, Kroef V, Miethe S, Müller R-U, Denzel MS. Bortezomib resistance mutations in PSMB5 determine response to second-generation proteasome inhibitors in multiple myeloma. Leukemia. 2021;35:887–892. doi: 10.1038/s41375-020-0989-4. - DOI - PMC - PubMed
    1. Arnold CS, Johnson GV, Cole RN, Dong DL, Lee M, Hart GW. The microtubule-associated protein tau is extensively modified with O-linked N-acetylglucosamine. The Journal of Biological Chemistry. 1996;271:28741–28744. doi: 10.1074/jbc.271.46.28741. - DOI - PubMed
    1. Arreola R, Valderrama B, Morante ML, Horjales E. Two mammalian glucosamine-6-phosphate deaminases: a structural and genetic study. FEBS Letters. 2003;551:63–70. doi: 10.1016/s0014-5793(03)00896-2. - DOI - PubMed

Publication types

MeSH terms

Substances

Associated data