. 2022 Mar 1:11:e73695.
doi: 10.7554/eLife.73695.

Ecological and social pressures interfere with homeostatic sleep regulation in the wild

Affiliations

Ecological and social pressures interfere with homeostatic sleep regulation in the wild

J Carter Loftus et al. Elife. .

Abstract

Sleep is fundamental to the health and fitness of all animals. The physiological importance of sleep is underscored by the central role of homeostasis in determining sleep investment - following periods of sleep deprivation, individuals experience longer and more intense sleep bouts. Yet, most sleep research has been conducted in highly controlled settings, removed from evolutionarily relevant contexts that may hinder the maintenance of sleep homeostasis. Using triaxial accelerometry and GPS to track the sleep patterns of a group of wild baboons (Papio anubis), we found that ecological and social pressures indeed interfere with homeostatic sleep regulation. Baboons sacrificed time spent sleeping when in less familiar locations and when sleeping in proximity to more group-mates, regardless of how long they had slept the prior night or how much they had physically exerted themselves the preceding day. Further, they did not appear to compensate for lost sleep via more intense sleep bouts. We found that the collective dynamics characteristic of social animal groups persist into the sleep period, as baboons exhibited synchronized patterns of waking throughout the night, particularly with nearby group-mates. Thus, for animals whose fitness depends critically on avoiding predation and developing social relationships, maintaining sleep homeostasis may be only secondary to remaining vigilant when sleeping in risky habitats and interacting with group-mates during the night. Our results highlight the importance of studying sleep in ecologically relevant contexts, where the adaptive function of sleep patterns directly reflects the complex trade-offs that have guided its evolution.

Keywords: biotelemetry; ecology; evolutionary biology; homeostasis; olive baboon; predation risk; sleep; social behavior.


Conflict of interest statement

JL, RH, CN, MC No competing interests declared

Figures

Figure 1.
Figure 1.. Extracting activity and sleep from accelerometry in a group of wild olive baboons.
Adapting algorithms developed by van Hees et al., 2015 and van Hees et al., 2018, we used the vectorial dynamic body acceleration (VeDBA), a measure of overall activity, to determine the sleep onset and awakening times (A; orange dashed lines), as well as periods of wake after sleep onset (A; blue shading) for each individual baboon on each day. These metrics allowed us to calculate the total sleep time, sleep period duration, sleep efficiency, and sleep fragmentation. The plot (A) shows the data of one individual within a single noon-to-noon period as an example. Averaged across all individuals on all nights (N = 354 baboon-nights), the log VeDBA shows that baboons exhibit activity patterns typical of a diurnal animal with monophasic sleep (B), with a consolidated period of very low levels of activity during the night. Although the timing of waking (C; dotted line) was more consistent across the group and across the study period than the timing of sleep onset (C; dashed line), both sleep onset and waking typically occurred within astronomical twilight. The red shading in (B) indicates ±1 SE. In all subplots, the gray shaded region depicts the period between sunset and sunrise, with double shading from the end of evening astronomical twilight to the beginning of morning astronomical twilight.
Figure 2.
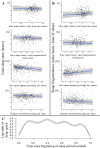
Figure 2.. Recent history of sleep and activity has a weak influence on baboon sleep patterns.
Neither the relative sleep time on the previous night, the relative sleep fragmentation on the previous night, nor the distance traveled on the preceding day influenced sleep duration (Ai, ii, iv) or sleep fragmentation (Bi, ii, iv), although baboons did sleep less (Aiii) and experience more fragmented sleep (Biii) following days with more napping. Additionally, the likelihood of a baboon being asleep did not substantially decrease as the night progressed and the baboon payed off its sleep debt (C). In (C), time since the beginning of the sleep period is scaled from 0 (beginning) to 1 (end of the sleep period). Subplots depict the conditional effect of each variable from models of the data, with raw data points overlaid.
Figure 2—figure supplement 1.
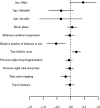
Figure 2—figure supplement 1.. Model output plot of model of total sleep time (for the first 20 days) with all numerical variables standardized.
Points represent posterior means and line segments represent 95% credible intervals. The categorical variable tree is not plotted.
Figure 2—figure supplement 2.
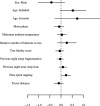
Figure 2—figure supplement 2.. Model output plot of model of sleep fragmentation (for the first 20 days) with all numerical variables standardized.
Points represent posterior means and line segments represent 95% credible intervals. The categorical variable tree is not plotted.
Figure 3.
Figure 3.. The location where baboons sleep has consequences for sleep duration.
Group members spent the majority of the study (32/35 nights) sleeping in 10 yellow fever (V. xanthophloea) trees in a grove along the Ewaso Ng’iro river (A). Within this sleep site, baboons slept longer when sleeping in trees to which they showed high fidelity (C). At 20:55 on the 21st night of the study, a leopard mounted an unsuccessful attack on the group in their sleep site. The following day, the baboons moved to a new sleep site 1.5 km away from their main sleep site (B). Baboons slept substantially less following this change in sleep site, but this effect did not persist beyond the first night in the new location (D). (C) Depicts the conditional effect from a model of the data, with raw data points overlaid, and (D) depicts a violin plot of the data, with color corresponding to the sleep site (A, B). The arrow in (D) indicates the night on which a leopard launched a failed attack on the group.
Figure 3—figure supplement 1.
Figure 3—figure supplement 1.. Comparison of the Shannon entropies of individuals’ sleep tree occupancy within their main sleep site to a null distribution produced by 1000 identity permutations.
The analysis revealed lower entropy in tree occupancy than expected by random chance (one-tailed two-sample Kolmogorov–Smirnov test: p<1.0 × 10⁻⁹), indicating that individuals exhibited high fidelity to particular trees. The red line represents the distribution of Shannon entropies of individuals’ sleep tree occupancy calculated from the empirical data, and the black line represents the distribution of entropy of sleep tree occupancy derived from the permuted dataset.
Figure 3—figure supplement 2.
Figure 3—figure supplement 2.. The conditional effect of tree identity on total sleep time.
The conditional effects plotted here are from the unstandardized Bayesian linear mixed model (LMM) of total sleep time.
Figure 3—figure supplement 3.
Figure 3—figure supplement 3.. The conditional effect of night condition on total sleep time.
The conditional effects presented here are from the unstandardized model of total sleep time.
Figure 3—figure supplement 4.
Figure 3—figure supplement 4.. The conditional effect of night condition on sleep fragmentation.
The conditional effects presented here are from the unstandardized model of sleep fragmentation.
Figure 4.
Figure 4.. Collective dynamics within the sleep site influence sleep patterns.
Group-mates’ periods of nocturnal wakefulness were not staggered, but rather synchronized, as indicated by a significantly lower proportion of time with at least one individual awake (A, dotted red line; Fisher’s exact test: p<0.0001) and a significantly greater proportion of the group exhibiting synchronized behaviors (B, dotted red line; Fisher’s exact test: p<0.0001) than expected based on 1000 time-shifted datasets (gray distribution). Synchronized sleep patterns likely result from individuals waking in response to the nighttime activity of nearby group-mates as dyads show greater synchronization when dyad members sleep in the same tree compared to when they sleep in different trees (C). As a consequence of these local social perturbations, baboons sleep less when sleeping in trees with more group-mates (D). Subplots (C) and (D) depict the conditional effects from models of the data, with raw data points overlaid.
Figure 4—figure supplement 1.
Figure 4—figure supplement 1.. A toy example of the procedure we used to test for sentinel behavior and synchronization of nighttime sleep-wake schedules.
Each row represents a baboon’s time series of sleep and wake activity during the night, with black vertical lines indicating periods of nocturnal waking behavior. Colors correspond to different nights, and the transparency of the color indicates the time within the night, with reference to the empirical, unshifted data. The time-shifting procedure was repeated 1000 times to generate a null distribution for the proportion of minutes in which at least one individual is awake during the night and the mean proportion of the group exhibiting synchronized behavior.
Figure 4—figure supplement 2.
Figure 4—figure supplement 2.. An alternative permutation procedure used to test for sentinel behavior and synchronization of nighttime sleep-wake schedules, and the results produced by this approach.
(A) A toy example of the procedure alternative to the one presented in the main text (and represented in Figure 4—figure supplement 1) that we used to confirm findings concerning sentinel behavior and synchronization of nighttime behavior that we derived from the procedure presented in the main text. Each row represents a baboon’s time series of sleep and wake activity during the night, with black vertical lines indicating periods of nocturnal waking behavior. Colors correspond to different nights, with reference to the empirical, unpermuted data, and the transparency of the color indicates the time within the night. The night permutation procedure was repeated 1000 times to generate a null distribution for the proportion of minutes in which at least one individual is awake during the night and the mean proportion of the group exhibiting synchronized behavior. (B) Comparison of the empirical proportion of minutes in which at least one individual is awake (red dotted line) to its null distribution (gray density plot; Fisher’s exact test: p<0.0001). (C) Comparison of the empirical mean of the proportion of the group exhibiting synchronized behavior (red dotted line) to its null distribution (gray density plot; Fisher’s exact test: p<0.0001). This method of permutation controls for the possibility that baboons are synchronized in their behavior simply as a result of species-typical nocturnal waking patterns that are consistent across baboons and across nights.
Figure 5.
Figure 5.. SPT-window detection algorithm adapted from Figure 1 in van Hees et al., 2018.
Figure 5—figure supplement 1.
Figure 5—figure supplement 1.. Examples of the three different behaviors, ‘wakefulness,’ ‘resting wakefulness,’ and ‘sleep,’ that were scored during the validation study.
Images presented here are extracted from the thermal imaging that was used for the behavioral scoring.
Author response image 1.

Comment in

Similar articles

Cited by

References

    1. Altmann SA, Altmann J. Baboon Ecology: African Field Research. University of Chicago Press; 1970. - DOI
    1. Amlaner CJ, Phil D, Fuller PM. Basics of Sleep Guide. Sleep Research Society; 2009.
    1. Ancoli-Israel S, Cole R, Alessi C, Chambers M, Moorcroft W, Pollak CP. The role of actigraphy in the study of sleep and circadian rhythms. Sleep. 2003;26:342–392. doi: 10.1093/sleep/26.3.342. - DOI - PubMed
    1. Aulsebrook AE, Jones TM, Rattenborg NC, Roth TC, Lesku JA. Sleep Ecophysiology: Integrating Neuroscience and Ecology. Trends in Ecology & Evolution. 2016;31:590–599. doi: 10.1016/j.tree.2016.05.004. - DOI - PubMed
    1. Bäckman J, Andersson A, Pedersen L, Sjöberg S, Tøttrup AP, Alerstam T. Actogram analysis of free-flying migratory birds: new perspectives based on acceleration logging. Journal of Comparative Physiology. A, Neuroethology, Sensory, Neural, and Behavioral Physiology. 2017;203:543–564. doi: 10.1007/s00359-017-1165-9. - DOI - PMC - PubMed

Publication types