. 2022 Mar 1:11:e73520.
doi: 10.7554/eLife.73520.

Robust and annotation-free analysis of alternative splicing across diverse cell types in mice

Affiliations

Robust and annotation-free analysis of alternative splicing across diverse cell types in mice

Gonzalo Benegas et al. Elife. .

Abstract

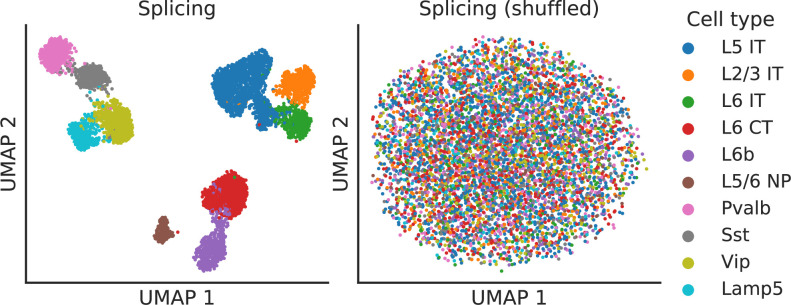
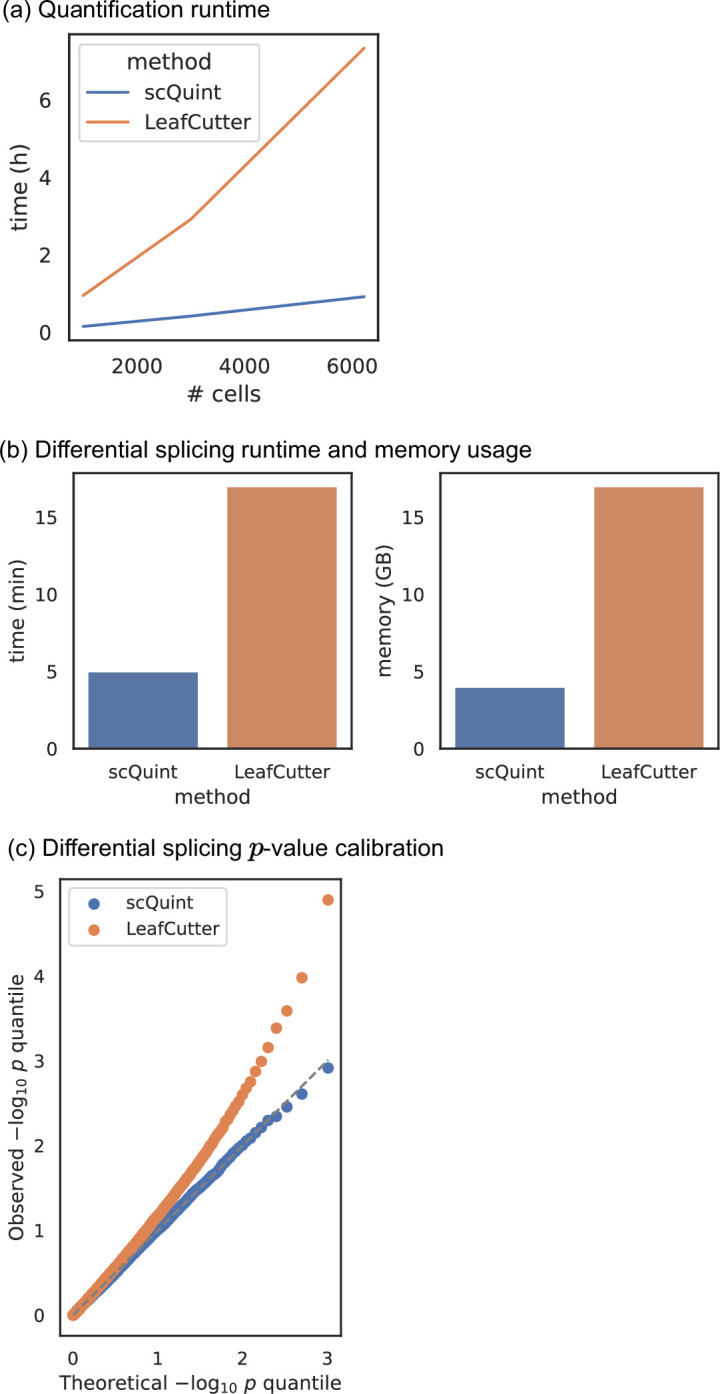
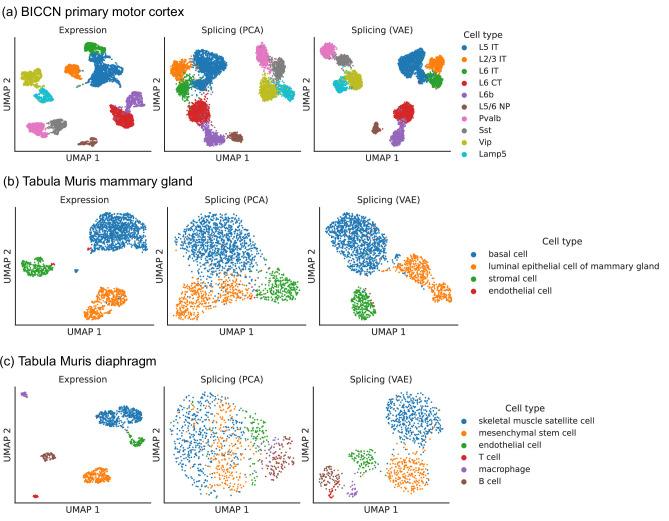
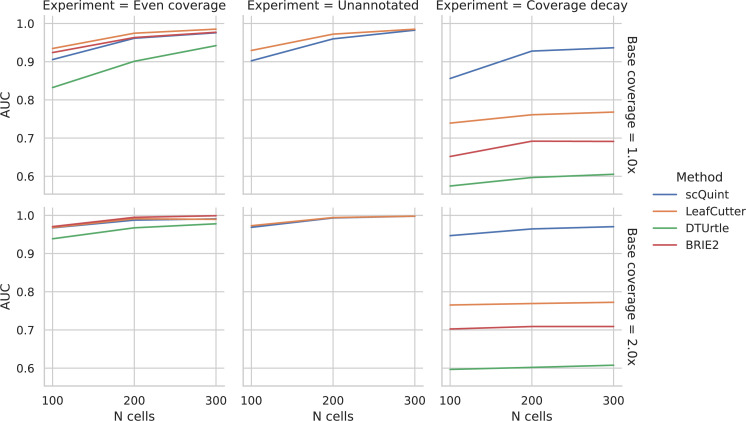
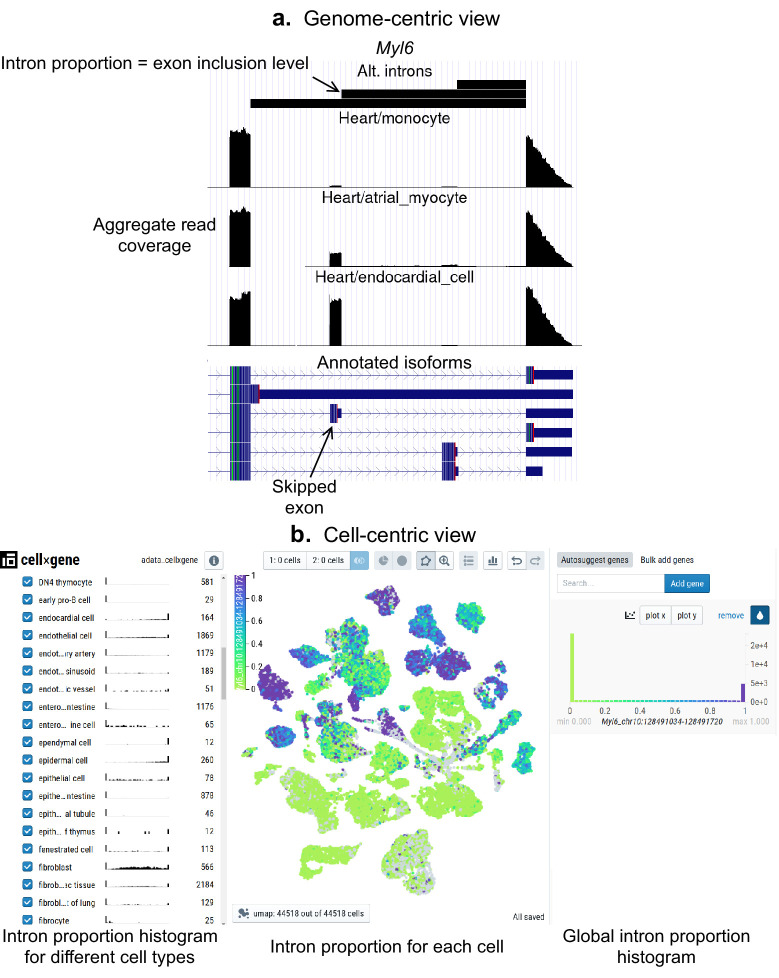
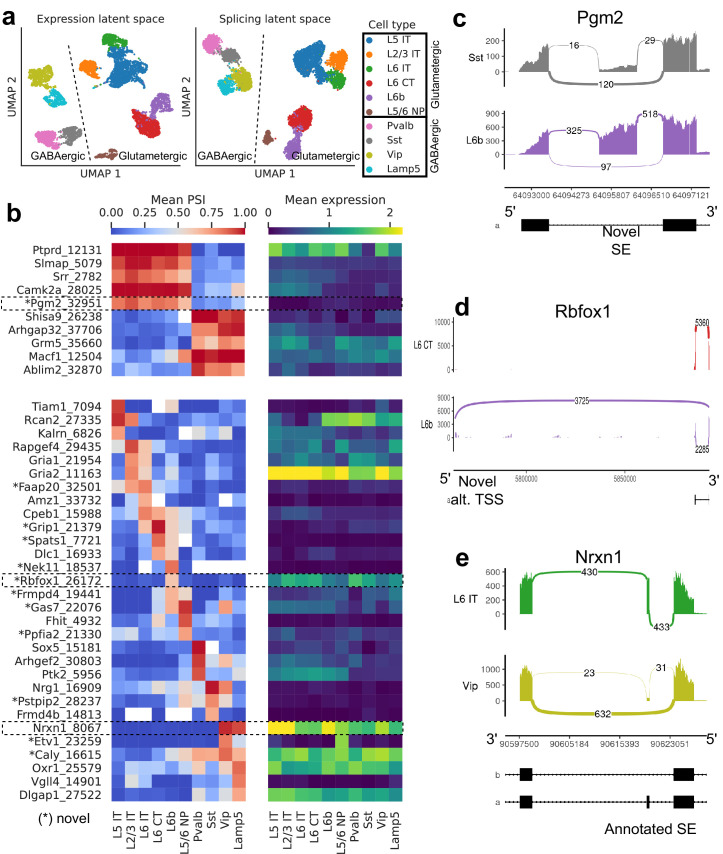
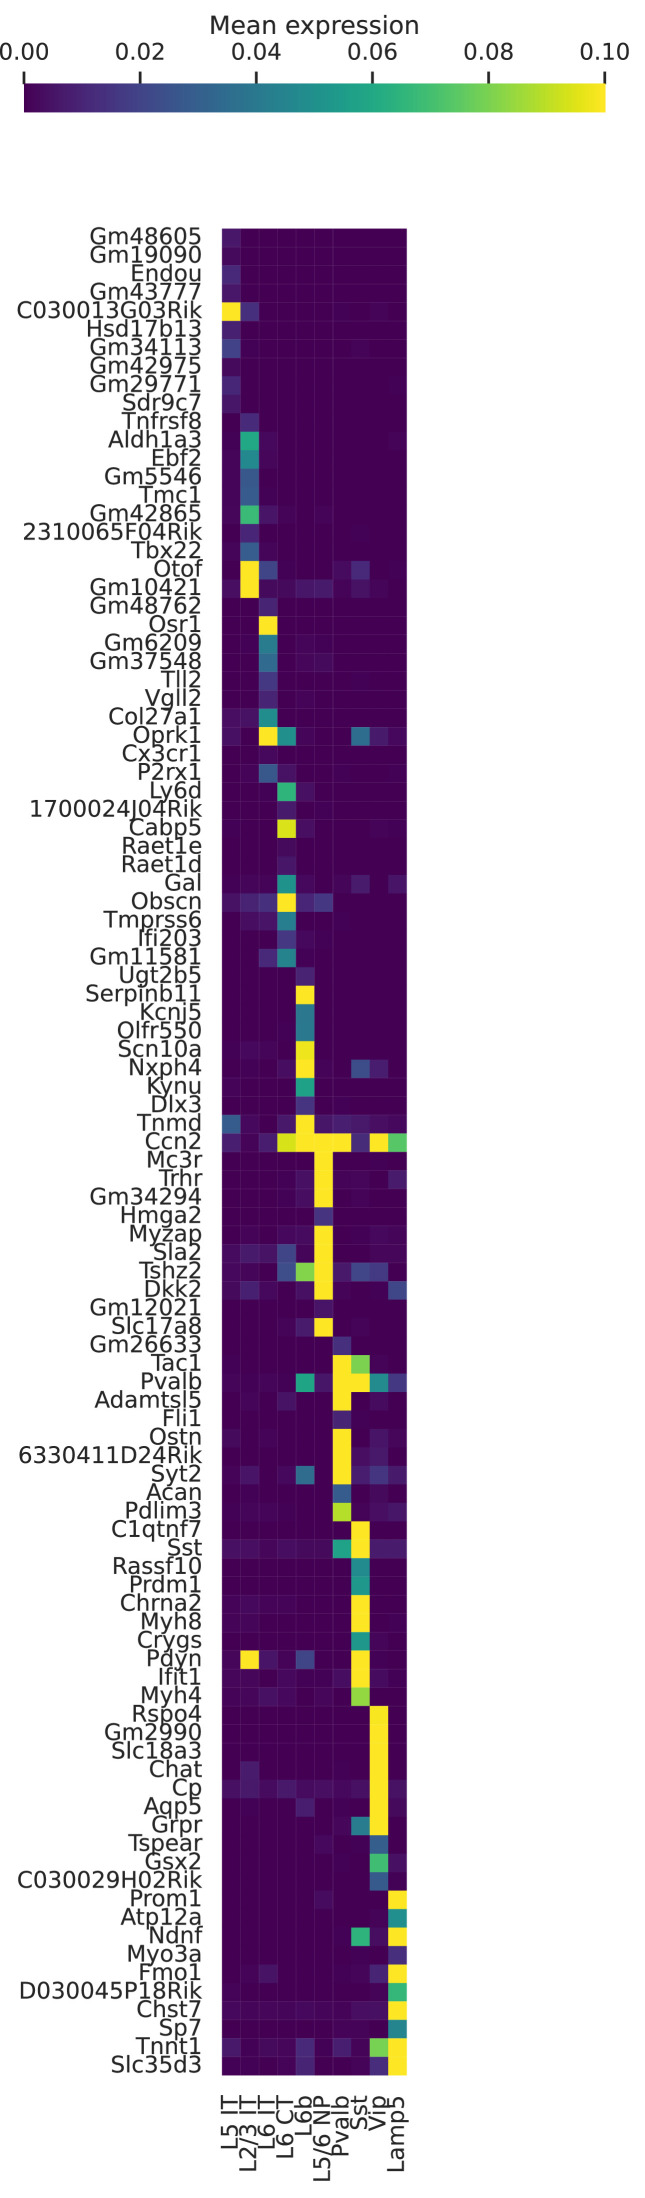
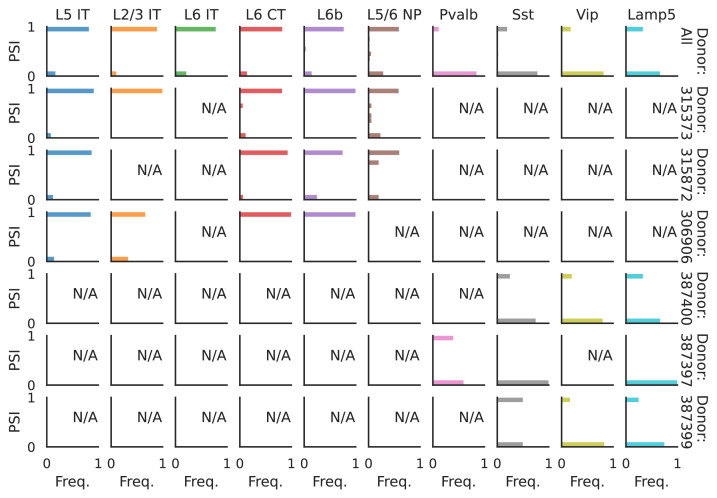
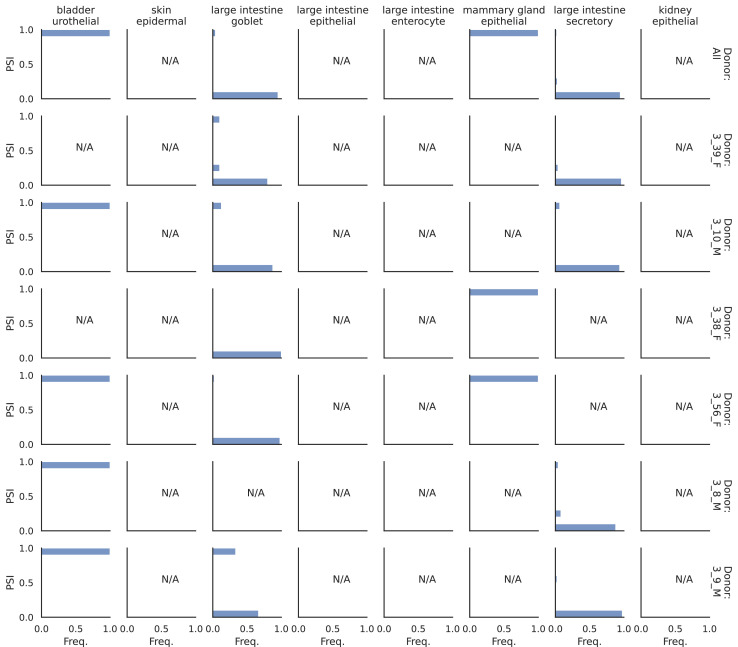
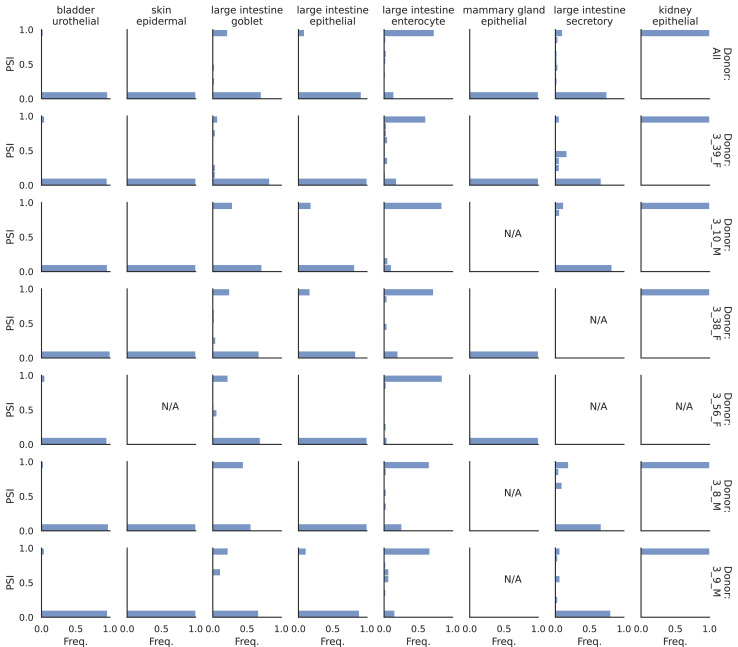
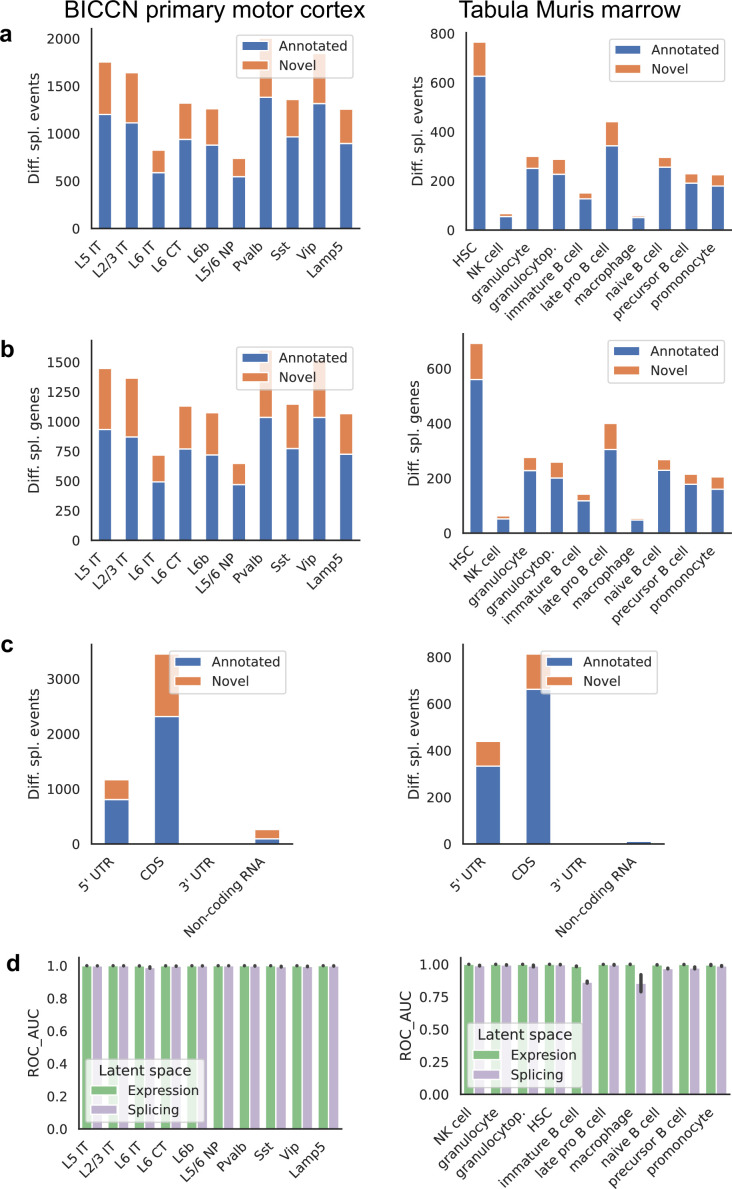
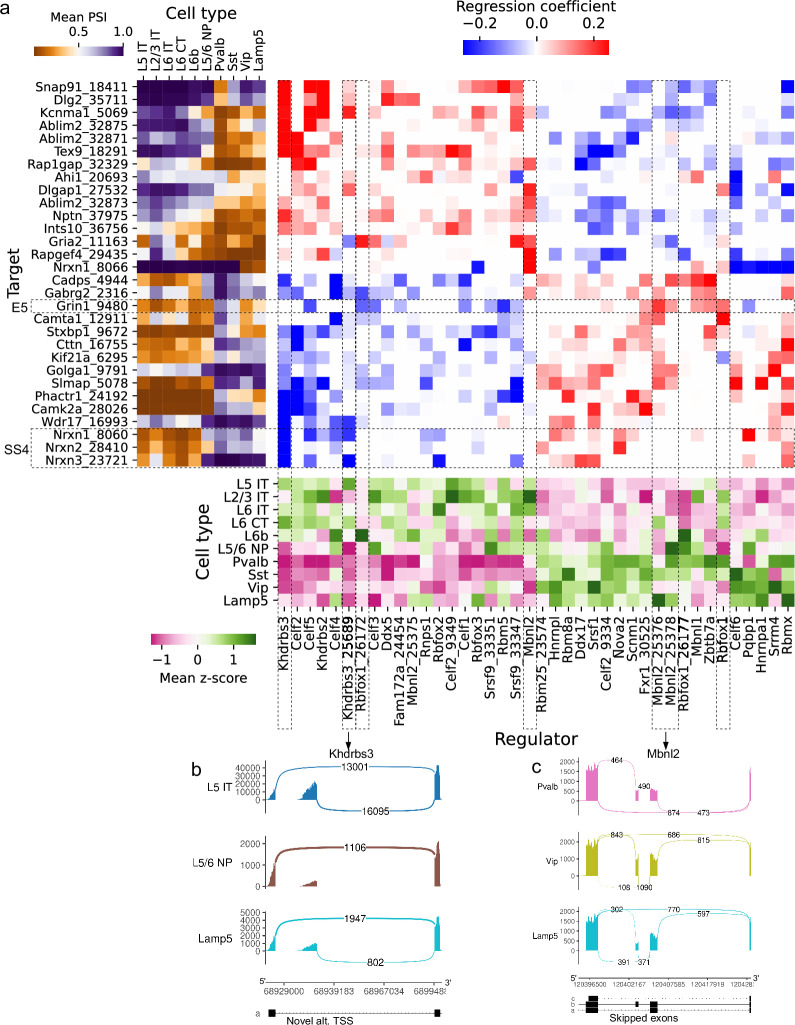
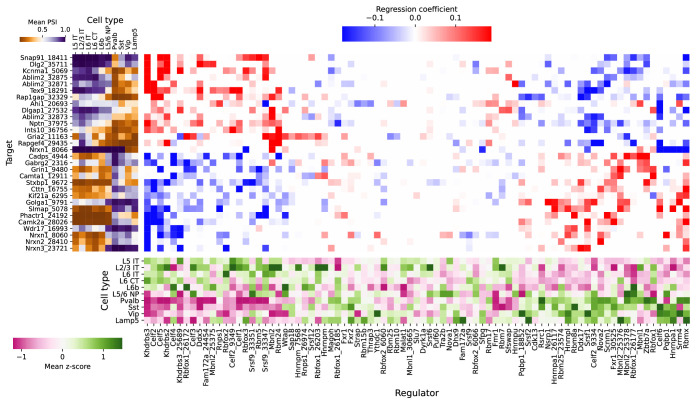
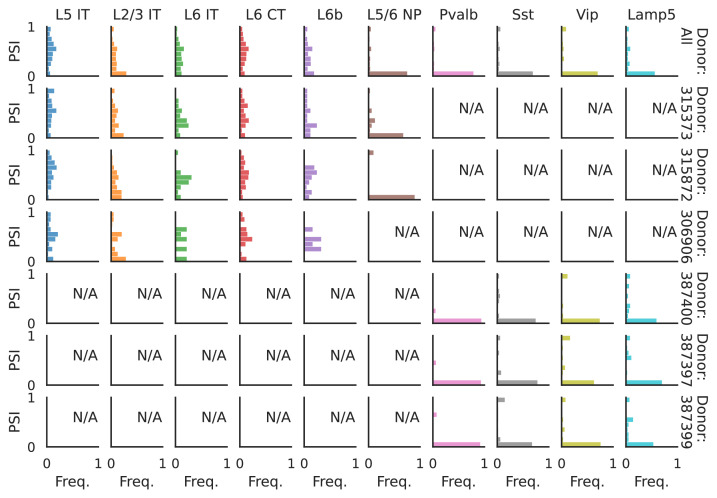
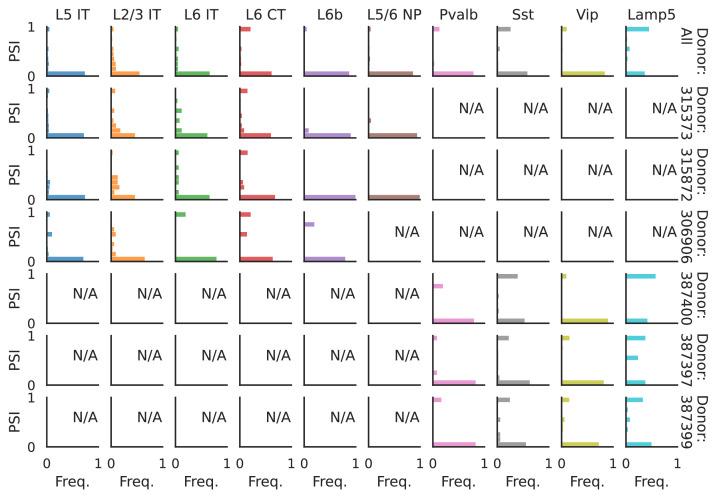
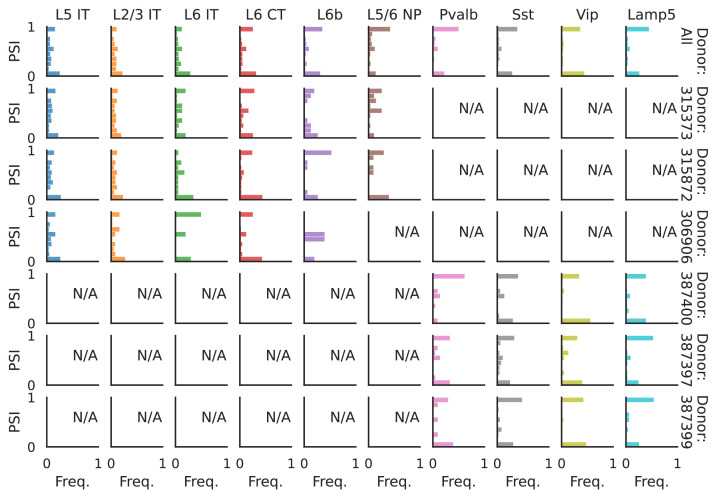
Although alternative splicing is a fundamental and pervasive aspect of gene expression in higher eukaryotes, it is often omitted from single-cell studies due to quantification challenges inherent to commonly used short-read sequencing technologies. Here, we undertake the analysis of alternative splicing across numerous diverse murine cell types from two large-scale single-cell datasets-the Tabula Muris and BRAIN Initiative Cell Census Network-while accounting for understudied technical artifacts and unannotated events. We find strong and general cell-type-specific alternative splicing, complementary to total gene expression but of similar discriminatory value, and identify a large volume of novel splicing events. We specifically highlight splicing variation across different cell types in primary motor cortex neurons, bone marrow B cells, and various epithelial cells, and we show that the implicated transcripts include many genes which do not display total expression differences. To elucidate the regulation of alternative splicing, we build a custom predictive model based on splicing factor activity, recovering several known interactions while generating new hypotheses, including potential regulatory roles for novel alternative splicing events in critical genes like Khdrbs3 and Rbfox1. We make our results available using public interactive browsers to spur further exploration by the community.

Keywords: Tabula Muris; alternative splicing; chromosomes; computational biology; gene expression; mouse; primary motor cortex neurons; single-cell RNA-seq; splicing factors; systems biology.

Plain language summary

Cells are the basic building blocks of all living things. There are numerous types of cells, and each cell has its own machinery to fulfill a specialised role. Despite their different purposes, most cells contain the same instructions, stored as DNA, on how to assemble the proteins needed to perform their intended functions. Cell types often vary in the frequency that each gene is read, leading to different quantities of proteins produced. Moreover, a process known as alternative splicing enables cells to build multiple proteins from the same gene. It works by joining fragments of a gene’s code in various combinations. The resulting RNA sequences are molecular templates that cells use to assemble proteins. Analysing these RNA sequences reveals which genes are switched on in different tissues of the body, and what proteins are being made. However, despite recent advancements, alternative splicing is rarely studied in single cells because of some sizeable technical challenges. Benegas, Fischer and Song developed a computational toolkit designed to handle the unique challenges of analysing alternative splicing events in single cells. The analysis pipeline, called scQuint, was tested on two large datasets that capture cell-to-cell differences in the brain and other tissues of mice. Nearly all the cell types studied exhibited clear differences in alternative splicing, such that cell types could be distinguished based on their splicing profiles. Intriguing patterns of splicing were highlighted in some immune cells and certain types of neurons. Across cell types, the genes with unique splicing patterns were often not the same as those with unique activity patterns, indicating that gene expression and alternative splicing are two complementary processes. New types of alternative splicing events were also identified. Benegas et al. also developed a statistical model to probe the roles of splicing regulators in different cell types. In summary, the scQuint toolkit overcomes critical technical challenges typically encountered when analysing alternative splicing in single cells. It also reveals new insights about mechanisms of alternative splicing. The results are open access, made available using public interactive browsers, which should spur on other researchers to interrogate how alternative splicing differs in single cells.


Conflict of interest statement

GB, JF, YS No competing interests declared

Figures

Figure 1.
Figure 1.. Clustering patterns by cell type and plate in the mammary gland from a three month-old female mouse in Tabula Muris.
Cell embeddings based on different features were obtained by running PCA (gene expression) or VAE (the rest) followed by UMAP and subsequently colored by cell type (left column) and the plate in which they were processed (right column). (a) Gene expression, quantified using featureCounts (log-transformed normalized counts). (b) Isoform proportions. Isoform expression was estimated with kallisto and divided by the total expression of the corresponding gene to obtain isoform proportions. (c) Coverage proportions of 100 base-pair bins along the gene, as proposed by ODEGR-NMF. (d) Exon proportions, as proposed by DEXSeq. (e) Intron proportions across the whole gene, as proposed by DESJ. (f) Alternative intron proportions quantified by LeafCutter. (g) Alternative intron proportions (for introns sharing a 3’ acceptor site) as quantified by scQuint.
Figure 1—figure supplement 1.
Figure 1—figure supplement 1.. Coverage artifacts in mammary gland basal cells from Tabula Muris.
Aggregate read coverage of basal cells is shown for three genes in two female mice: 3_38_F, processed in three different plates, and 3_56_F, processed in two different plates. Visualization on the UCSC Genome Browser. (a) Akr1r1, with relatively uniform coverage, what we expect. (b) Ctnbb1, with a gradual drop in coverage away from the 3’ end. The rate of coverage decay varies across plates. (c) Pdpn, with a sudden drop in coverage halfway through the 3’ UTR. The magnitude of the drop varies across plates.
Figure 1—figure supplement 2.
Figure 1—figure supplement 2.. Technical artifacts in BICCN Cortex.
Aggregate read coverage in Pdpk1 in two cell types, Vip and Sst, further separated according to the ‘batch’ metadata label into two groups. The first group contains cells from batches R8S4-180530 and,R8S4-180524 while the second group contains the remaining batches. Cells from different batches belong to different mice and were processed on different dates. In all groups, coverage decreases rapidly in the 3’ UTR of the isoform with the longest 3’ UTR, eventually reaching zero. Additionally, the relative coverage in this region compared to the rest of the gene (seeming to originate from a different isoform with a short 3’ UTR) varies drastically across batches, and consistently in different cell types. In principle, this could be due to biological differences between mice from different batches, but an explanation based on technical factors such as amplification bias may be more plausible.
Figure 2.
Figure 2.. Overview of scQuint.
(a) Intron usage is quantified from split reads in each cell, with introns sharing 3’ splice sites forming alternative intron groups. (b) Genome-wide intron usage is mapped into a low dimensional latent space using a Dirichlet-Multinomial VAE. Visualization of the latent space is done via UMAP. (c) A Dirichlet-Multinomial GLM tests for differential splicing across conditions such as predefined cell types or clusters identified from the splicing latent space.
Figure 2—figure supplement 1.
Figure 2—figure supplement 1.. Splicing latent space when alternative intron counts are shuffled.
To verify that absolute gene expression does not affect the splicing latent space, we perturbed the BICCN Cortex dataset by resampling alternative intron counts with a fixed proportion in all cells (the proportions in different alternative intron groups varied and were sampled from a uniform Dirichlet distribution). In this scenario, different cell types still vary in their gene expression levels but not in their splicing patterns. As hoped, the splicing latent space does not distinguish between cell types, indicating it is only capturing differences in splicing proportions rather than changes in absolute gene expression.
Figure 2—figure supplement 2.
Figure 2—figure supplement 2.. Comparison with LeafCutter.
(a) Quantification runtime. Time to perform intron quantification on BICCN Cortex dataset, including cell subsampling to understand effect of number of cells. (b) Differential splicing runtime and memory usage. We randomly split all 6220 BICCN Cortex cells into two equally sized groups and performed differential splicing between them. Runtime (left) and memory usage (right) are displayed. (c) Differential splicing p-value calibration. In the same random split of (b), the null hypothesis of no difference in splicing proportions holds, and we expect the distribution of p-values to be uniform. The quantile-quantile plot of p-values obtained with scQuint shows their distribution is indeed uniform, suggesting that the model is well-calibrated under the null; this is not true for p-values obtained by LeafCutter. All experiments were performed on a Skylake processor (2 × 16 cores @ 2.1 GHz) with 96 GB of RAM.
Figure 3.
Figure 3.. Comparison of splicing latent spaces obtained with PCA and VAE.
Cells from (a) the cortex, (b) mammary gland and (c) diaphragm are projected into a latent space using PCA or VAE and visualized using UMAP. Cell type labels are obtained from the original data sources and are based on clustering in the expression latent space. The VAE is able to better distinguish cell types in the splicing latent space than PCA.
Figure 4.
Figure 4.. Evaluation of differential splicing test on simulated data.
ROC AUC for detecting differential transcript usage between two groups, based on the p-value produced by different methods. Unannotated: the transcript reference given to methods is masked. Coverage decay: coverage decay with distance to the 3’ end of the transcript is induced in one of the two groups.
Figure 5.
Figure 5.. Interactive visualizations of splicing patterns.
As an example, a skipped exon in Myl6. (a) The UCSC Genome browser visualization of this locus. Bottom: annotated isoforms of Myl6, including a skipped exon. Center: aggregate read coverage in three cell types with varying inclusion levels of the skipped exon. Top: three alternative introns that share a 3’ acceptor site. The identified intron’s proportion corresponds to the skipped exon’s inclusion level. (b) cell×gene browser visualization of the marked intron’s proportions (Myl6_chr10:128491034–128491720). Center: intron proportion for each cell in the UMAP expression embedding. Sides: intron proportion histogram for (left) different cell types and (right) all cells.
Figure 6.
Figure 6.. Splicing patterns in BICCN Cortex.
(a) Expression and splicing latent spaces, visualized using UMAP. The expression (splicing) latent space is defined by running PCA (VAE) on the gene expression (alternative intron proportion, PSI) matrix. Cell types separate well in both latent spaces. (b) PSI of selected introns (left) and expression (log-transformed normalized counts) of their respective genes (right) averaged across cell types. Top: introns distinguishing Glutamatergic and GABAergic neuron classes. Bottom: introns distinguishing neuron subclasses. (c–e) Sashimi plots (Garrido-Martín et al., 2018) of specific alternative splicing events, displaying overall read coverage with arcs indicating usage of different introns (certain introns are shrunk for better visualization). (c) Novel skipped exon in Pgm2. (d) Novel alternative transcription start site (TSS) in Rbfox1. (e) Annotated skipped exon (SE) in Nrxn1.
Figure 6—figure supplement 1.
Figure 6—figure supplement 1.. Marker genes for cell types in BICCN Cortex.
Mean (log-transformed) expression for some of the top differentially expressed genes in each cell type.
Figure 6—figure supplement 2.
Figure 6—figure supplement 2.. PSI distribution of Pgm2_32951.
Only six individuals with highest number of cells are displayed. Marked N/A are cell types where the individuals have PSI defined in fewer than three cells. Per the experimental design of this dataset, the top 3 individuals have only Glutamatergic cell types sequenced, while the bottom 3 have only GABAergic.
Figure 6—figure supplement 3.
Figure 6—figure supplement 3.. PSI distribution of Rbfox1_26172.
Only six individuals with highest number of cells are displayed. Marked N/A are cell types where the individuals have PSI defined in fewer than three cells. Per the experimental design of this dataset, the top 3 individuals have only Glutamatergic cell types sequenced, while the bottom 3 have only GABAergic.
Figure 6—figure supplement 4.
Figure 6—figure supplement 4.. PSI distribution of Nrxn1_8067.
Only six individuals with highest number of cells are displayed. Marked N/A are cell types where the individuals have PSI defined in fewer than three cells. Per the experimental design of this dataset, the top 3 individuals have only Glutamatergic cell types sequenced, while the bottom 3 have only GABAergic.
Figure 7.
Figure 7.. Global analysis of Tabula Muris.
(a) UMAP visualization of the expression (left) and splicing (right) latent spaces. Each dot is a cell, colored by organ, and overlays indicate the primary cell type comprising that cluster. (b) Tanglegram comparing dendrograms of major cell types based on distances in the expression (left) and splicing (right) latent spaces, highlighting functional classes with specific colors.
Figure 8.
Figure 8.. Splicing in developing marrow B cells from Tabula Muris.
B cell developmental stages include pro-B, pre-B, immature B, and naive B. (a) Expression versus splicing latent space, as defined previously. In the splicing latent space, some cells types (pro-B) are better distinguished than others (immature B). (b) Number of differential splicing events when comparing a B cell stage vs. the rest. (c) PSI of some introns that are differentially spliced throughout development, together with expression of the respective genes (log-transformed normalized counts). Expression and splicing can have very different trajectories. (d) Sashimi plot of novel alternative transcription start site (TSS) in Smarca4. The novel TSS has maximum usage in pre-B cells, and then decays, while the expression peaks at pro-B cells. (e) Sashimi plot of an annotated alternative TSS in Foxp1. The proximal TSS in increasingly used as development progresses, while the expression peaks at pre-B cells.
Figure 8—figure supplement 1.
Figure 8—figure supplement 1.. PSI distribution of Smarca4_28720.
Figure 8—figure supplement 2.
Figure 8—figure supplement 2.. PSI distribution of Foxp1_11076.
Figure 9.
Figure 9.. Alternative splicing patterns across epithelial and endothelial cell types.
(a–b) PSI of selected introns (left) and expression (log-transformed normalized counts) of the corresponding genes (right) averaged across cell types. Novel intron groups are marked with (*). (a) Introns distinguishing epithelial cell types. (b) Introns distinguishing endothelial cell types. (c) Sashimi plot of an alternative TSS in Itpr1. (d) Sashimi plot of a complex alternative splicing event in Khk.
Figure 9—figure supplement 1.
Figure 9—figure supplement 1.. Full-gene view of novel alternative TSS in Itpr1.
Large intestine secretory cells aggregate read coverage visualized in the UCSC Genome Browser.
Figure 9—figure supplement 2.
Figure 9—figure supplement 2.. PSI distribution of Itpr1_26257.
Only six individuals with highest number of cells are displayed. Marked N/A are cell types where the individuals have PSI defined in fewer than three cells.
Figure 9—figure supplement 3.
Figure 9—figure supplement 3.. PSI distribution of Khk_24896.
Only six individuals with highest number of cells are displayed. Marked N/A are cell types where the individuals have PSI defined in fewer than three cells.
Figure 10.
Figure 10.. Patterns across tissues.
(a) Number of differential splicing events detected in each cell type. Cortex cell types have more differential splicing events and larger proportions of novel events (those involving an intron absent from the reference). (b) Number of genes with a detected differential splicing event, for different cell types. (c) Number of differential splicing events in different gene regions aggregated over cell types (duplicate events removed). Cortex cell types have higher proportions of events in coding regions and non-coding RNAs. Note: y-axes are not on the same scale. (d) ROC AUC score for classification of each cell type versus the rest based on either the expression or splicing latent space, using logistic regression, training and testing in non-overlapping sets of individuals. The score for splicing-based classification is near-perfect in most cell types with some exceptions such as immature B cells in the marrow.
Figure 11.
Figure 11.. Associations between splicing factors and alternative splicing.
(a) Regression analysis of exon skipping based on expression and splicing of splicing factors, using the BICCN mouse primary motor cortex dataset. Left panel: mean PSI of skipped exons across cell types. Bottom panel: mean z-scores of selected splicing factor features across cell types, including whole-gene expression (gene name) and PSI of alternative introns (gene name and numerical identifier). Center panel: regression coefficients (log-odds) of each splicing factor feature used to predict skipped exon PSI in our sparse Dirichlet-Multinomial linear model. (b) Novel alternative TSS in Khdrbs3. (c) Annotated skipped exons in Mbnl2.
Figure 11—figure supplement 1.
Figure 11—figure supplement 1.. Full plot of associations between splicing factors and alternative splicing.
Regression analysis of exon skipping based on expression and splicing of splicing factors, using the BICCN mouse primary motor cortex dataset. Left panel: mean PSI of skipped exons across cell types. Bottom panel: mean z-scores of selected splicing factor features across cell types, including whole-gene expression (gene name) and PSI of alternative introns (gene name and numerical identifier). Center panel: regression coefficients (log-odds) of each splicing factor feature used to predict skipped exon PSI in our sparse Dirichlet-Multinomial linear model.
Figure 11—figure supplement 2.
Figure 11—figure supplement 2.. PSI distribution of Khdrbs3_25689.
Only six individuals with highest number of cells are displayed. Marked N/A are cell types where the individuals have PSI defined in fewer than three cells. Per the experimental design of this dataset, the top three individuals have only Glutamatergic cell types sequenced, while the bottom three have only GABAergic.
Figure 11—figure supplement 3.
Figure 11—figure supplement 3.. PSI distribution of Mbnl2_25376.
Only six individuals with highest number of cells are displayed. Marked N/A are cell types where the individuals have PSI defined in fewer than three cells. Per the experimental design of this dataset, the top three individuals have only Glutamatergic cell types sequenced, while the bottom three have only GABAergic.
Figure 11—figure supplement 4.
Figure 11—figure supplement 4.. PSI distribution of Mbnl2_25378.
Only six individuals with highest number of cells are displayed. Marked N/A are cell types where the individuals have PSI defined in fewer than three cells. Per the experimental design of this dataset, the top three individuals have only Glutamatergic cell types sequenced, while the bottom three have only GABAergic.

References

    1. Amemiya HM, Kundaje A, Boyle AP. The ENCODE Blacklist: identification of problematic regions of the genome. Scientific Reports. 2019;9:1–5. doi: 10.1038/s41598-019-45839-z. - DOI - PMC - PubMed
    1. Anders S, Reyes A, Huber W. Detecting differential usage of exons from RNA-seq data. Genome Research. 2012;22:2008–2017. doi: 10.1101/gr.133744.111. - DOI - PMC - PubMed
    1. Arzalluz-Luque Á, Conesa A. Single-cell RNAseq for the study of isoforms-how is that possible? Genome Biology. 2018;19:1496. doi: 10.1186/s13059-018-1496-z. - DOI - PMC - PubMed
    1. Asipu A, Hayward BE, O’Reilly J, Bonthron DT. Properties of normal and mutant recombinant human ketohexokinases and implications for the pathogenesis of essential fructosuria. Diabetes. 2003;52:2426–2432. doi: 10.2337/diabetes.52.9.2426. - DOI - PubMed
    1. Bas-Orth C, Tan YW, Oliveira AMM, Bengtson CP, Bading H. The calmodulin-binding transcription activator CAMTA1 is required for long-term memory formation in mice. Learning & Memory (Cold Spring Harbor, N.Y.) 2016;23:313–321. doi: 10.1101/lm.041111.115. - DOI - PMC - PubMed

Publication types

Associated data