. 2022 Mar 1;132(5):e152170.
doi: 10.1172/JCI152170.

USP25 inhibition ameliorates Alzheimer's pathology through the regulation of APP processing and Aβ generation

Affiliations

USP25 inhibition ameliorates Alzheimer's pathology through the regulation of APP processing and Aβ generation

Qiuyang Zheng et al. J Clin Invest. .

Abstract

Down syndrome (DS), or trisomy 21, is one of the critical risk factors for early-onset Alzheimer's disease (AD), implicating key roles for chromosome 21-encoded genes in the pathogenesis of AD. We previously identified a role for the deubiquitinase USP25, encoded on chromosome 21, in regulating microglial homeostasis in the AD brain; however, whether USP25 affects amyloid pathology remains unknown. Here, by crossing 5×FAD AD and Dp16 DS mice, we observed that trisomy 21 exacerbated amyloid pathology in the 5×FAD brain. Moreover, bacterial artificial chromosome (BAC) transgene-mediated USP25 overexpression increased amyloid deposition in the 5×FAD mouse brain, whereas genetic deletion of Usp25 reduced amyloid deposition. Furthermore, our results demonstrate that USP25 promoted β cleavage of APP and Aβ generation by reducing the ubiquitination and lysosomal degradation of both APP and BACE1. Importantly, pharmacological inhibition of USP25 ameliorated amyloid pathology in the 5×FAD mouse brain. In summary, we identified the DS-related gene USP25 as a critical regulator of AD pathology, and our data suggest that USP25 serves as a potential pharmacological target for AD drug development.

Keywords: Alzheimer disease; Neuroscience.


Figures

Figure 1
Figure 1. Increased USP25 dosage promotes amyloid plaque deposition in 5×FAD mice.
(AC) Representative immunostaining (A) and quantification of 6E10-positive amyloid plaques (B and C) in the hippocampi (Hipp) of 5-month-old 5×FAD (n = 4) and 5×FAD;Dp16 (n = 5) mice. Scale bar: 100 μm. (DF) Representative immunostaining (D) and quantification of 6E10-positive amyloid plaques (E and F) in the hippocampi of 6-month-old 5×FAD (n = 5) and 5×FAD;BAC-Tg-USP25 (n = 6) mice. Scale bar: 100 μm. All data are presented as mean ± SEM. P values were determined by Student’s t test. *P < 0.05; **P < 0.01; ***P < 0.001.
Figure 2
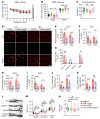
Figure 2. Usp25 deficiency ameliorates amyloid burden in 5×FAD mice.
(A) Morris water maze (MWM) test results depicting escape latency, defined as the time taken to find a hidden platform in the 7-day training phase. (B) MWM probe test results. n = 13–19 mice per group. (C) Percentage freezing time in contextual fear conditioning (FC) tests as a readout of associative memory. n = 18 mice per group. Six- to 7-month-old mice were used in behavioral tests. (D-I) Representative immunostaining (D) and quantification of amyloid plaques with a 6E10 antibody (EG) and thioflavin S (ThioS) (H and I) in the cortices (CTX) and hippocampi (Hipp) in 6-month-old 5×FAD and 5×FAD;Usp25+/– mice. n = 6 mice per group. Scale bar: 50 μm. (J and K) Quantification of soluble Aβ42 (J) and Aβ40 (K) in RIPA buffer in the cortices and hippocampi of 6-month-old 5×FAD and 5×FAD;Usp25+/– mice. n = 10 mice per group. (LN) Golgi staining (L) and quantification of mature, immature, and total dendritic spines (M) and spine size (N) in the cortical layer V regions of 9-month-old WT, Usp25+/–, 5×FAD, and 5×FAD;Usp25+/– mice. Scale bar: 10 μm. n = 4 mice per group, 22–27 dendrites per group were counted in M, and 95–107 spines per group were counted in N. Data are presented as mean ± SEM (A and EK) or as median with minimum to maximum bars (B, C, M, and N). P values were determined by 1-way ANOVA with Dunnett’s post hoc analysis in B and C, by the Mann-Whitney test in EK, by 1-way ANOVA with Tukey’s post hoc analysis in M, and by Kruskal-Wallis test with Dunn’s post hoc analysis in N. *P < 0.05; **P < 0.01; ***P < 0.001; #P < 0.0001.
Figure 3
Figure 3. USP25 regulates APP processing in 5×FAD mice.
(A and B) Immunoblot analysis of APP-processing-related proteins in the cortices of 6-month-old WT, Usp25+/–, 5×FAD, and 5×FAD:Usp25+/– mice. n = 5 per group. (C and D) Immunoblot analysis of APP, BACE1, and USP25 proteins in the cortices of 6-month-old WT and BAC-Tg-USP25 mice. n = 8 per group. The intensity of each immunoblot band was normalized to that of the β-actin band. All data are presented as median with minimum to maximum bars. Values are shown in kDa in A and C. P values were determined by ordinary 1-way ANOVA with Tukey’s post hoc analysis in B and by Student’s t test in D. *P < 0.05; ***P < 0.001; ****P < 0.0001.
Figure 4
Figure 4. Knockdown of USP25 reduces APP processing and Aβ generation in vitro.
(AD) Quantification of secreted and intracellular Aβ42/Aβ40 in SH-SY5Y-APP751 cells upon USP25 siRNA treatment. n = 6 per group. (E and F) Immunoblot analysis of APP-processing-related proteins in SH-SY5Y-APP751 cells upon USP25 siRNA treatment. The intensity of each immunoblot band was normalized to that of the β-actin band. Values are shown in kDa in E. n = 4 per group. All data are presented as mean ± SEM. P values were determined by ordinary 1-way ANOVA with Dunnett’s post hoc analysis. *P < 0.05; **P < 0.01; ***P < 0.001; ****P < 0.0001.
Figure 5
Figure 5. USP25 deubiquitinates and stabilizes APP and BACE1.
(A) Co-IP of endogenous APP and USP25 in C57BL/6 mouse cortical lysates. Rabbit IgG was used as a negative control. (B) Co-IP of the purified His-tagged USP25a catalytic domain (His-USP25aCat) and exogenously expressed BACE1-HA protein in HEK293T cells. Mouse IgG was used as a negative control. (C and D) Immunoblot analysis of polyubiquitinated APP-myc in HEK293T cells upon HA-USP25a overexpression. n = 5. (E and F) Immunoblot analysis of polyubiquitinated BACE1-HA in HEK293T cells upon USP25 knockdown. n = 6. (G and H) Immunoblot analysis of APP and BACE1 in USP25-depleted SH-SY5Y-APP751 cell lysates treated with the proteasomal inhibitor MG132 (10 μM) or the lysosomal inhibitor leupeptin (Leu, 100 μg/mL). The intensity of each immunoblot band was normalized to that of the β-actin band. Values are shown in kDa in A–C, E, and G. n = 6. All data are presented as mean ± SEM. P values were determined by Student’s t test in D and F and by ordinary 1-way ANOVA with Dunnett’s post hoc analysis in H. **P < 0.01; ***P < 0.001; ****P < 0.0001.
Figure 6
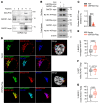
Figure 6. Overexpression of USP25 facilitates sorting of BACE1 into the Golgi apparatus.
(A) Fractions from a 10%~50% sucrose density gradient were collected and concentrated by TCA precipitation and then subjected to immunoblot analysis. GOLPH4 was used as a Golgi marker. (B and C) Cell surface expression of BACE1-myc in HEK293 cells upon USP25a-myc overexpression was determined by surface biotinylation assay. Na+/K+ ATPase, a plasma membrane protein, was used as the internal control. Values are shown in kDa in A and B. TL, total lysate. n = 3 per group. (DG) Immunofluorescence staining and colocalization analysis of APP-EGFP and BACE1-HA with RCAS1-positive Golgi in HeLa cells overexpressing USP25a-Flag or control vector. Scale bar: 10 μm. n = 43 (vector), n = 41 (USP25a-Flag). Data are presented as mean ± SEM (C) or median with minimum to maximum bars (EG). P values were determined by Student’s t test in C and by the Mann-Whitney test in EG. ***P < 0.001; ****P < 0.0001.
Figure 7
Figure 7. Pharmacological inhibition of USP25 ameliorates amyloid plaque deposition in 5×FAD mice.
(A) Seven-month-old 5×FAD mice were intraperitoneally injected with vehicle or AZ1 (20 mg/kg/d) for 4 weeks and then subjected to pathological analyses. (B) Representative immunostaining of 6E10-positive amyloid plaques in 5×FAD+vehicle (Veh) and 5×FAD+AZ1 mice. Scale bar: 500 μm (merge); 250 μm (zoom in (high-magnification images to the right and below merge images)). (C–F) Quantification of 6E10-positive amyloid plaques in the mouse cortex (CTX) (C and D) and hippocampus (Hipp) (E and F). n = 5 mice per group. (G) Representative immunostaining of 6E10-positive amyloid plaques and LAMP1-positive dystrophic neurites in the hippocampi of 5×FAD+vehicle and 5×FAD+AZ1 mice. Scale bar: 100 μm (merge); 20 μm (Zoom in). (H) Quantification of LAMP1-positive dystrophic neurites in G. n = 5 mice per group. (I) Quantification of amyloid plaque–associated LAMP1-positive dystrophic neurites in G. n = 5 mice and 55 amyloid plaques (5×FAD+Veh), n = 5 mice and 47 amyloid plaques (5×FAD+AZ1). Data are presented as mean ± SEM (CF and H) or median with minimum to maximum bars (I). P values were determined by Student’s t test in CF and by the Mann-Whitney test in H, I, K, and L. *P < 0.05; **P < 0.01.
Figure 8
Figure 8. USP25 expression is correlated with APP and Aβ levels in brains from patients with AD.
(A) Immunoblot analysis of USP25 and APP-processing-related proteins in the cortices of age-matched controls (normal) and patients with AD. Values are shown in kDa in A. Data are presented as median with minimum to maximum bars. (B) Quantification of the USP25, APP, BACE1, and synaptophysin protein amounts in A. n = 14 (control), n = 20 (AD). All data are presented as mean ± SEM. P values were determined by Student’s t test. *P < 0.05. (CE) Correlation between USP25 expression and APP, BACE1, and Aβ42 levels. n = 34 (14 controls and 20 AD cases). P values were determined by Spearman’s rank correlation.
Figure 9
Figure 9. Targeting USP25 ameliorates amyloid pathology in Alzheimer’s brains.
USP25 interacts with and deubiquitinates APP and BACE1 in the Golgi apparatus, resulting in amyloid pathology. Genetic depletion or pharmacological inhibition of USP25 induces lysosomal degradation of APP and BACE1 and reverses amyloid pathology in Alzheimer’s brains.

References

    1. Sun X, et al. BACE2, as a novel APP theta-secretase, is not responsible for the pathogenesis of Alzheimer’s disease in Down syndrome. FASEB J. 2006;20(9):1369–1376. doi: 10.1096/fj.05-5632com. - DOI - PubMed
    1. Sun X, et al. Increased BACE1 maturation contributes to the pathogenesis of Alzheimer’s disease in Down syndrome. FASEB J. 2006;20(9):1361–1368. doi: 10.1096/fj.05-5628com. - DOI - PubMed
    1. Wang Z, et al. BACE2, a conditional β-secretase, contributes to Alzheimer’s disease pathogenesis. JCI Insight. 2019;4(1):e123431. doi: 10.1172/jci.insight.123431. - DOI - PMC - PubMed
    1. Wiseman FK, et al. Trisomy of human chromosome 21 enhances amyloid-β deposition independently of an extra copy of APP. Brain. 2018;141(8):2457–2474. doi: 10.1093/brain/awy159. - DOI - PMC - PubMed
    1. Chen XQ, et al. Mechanistic analysis of age-related clinical manifestations in Down syndrome. Front Aging Neurosci. 2021;13:700280. doi: 10.3389/fnagi.2021.700280. - DOI - PMC - PubMed

Publication types

MeSH terms

Substances

Grants and funding