. 2022 Mar;27(2):e13153.
doi: 10.1111/adb.13153.

From binge eating to binge drinking: A new and robust paradigm for assessing binge ethanol self-administration in male rats

Affiliations

From binge eating to binge drinking: A new and robust paradigm for assessing binge ethanol self-administration in male rats

Leandro Ruiz-Leyva et al. Addict Biol. 2022 Mar.

Abstract

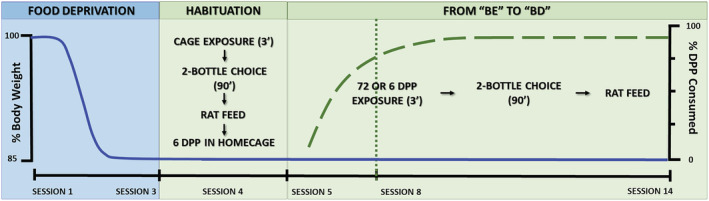
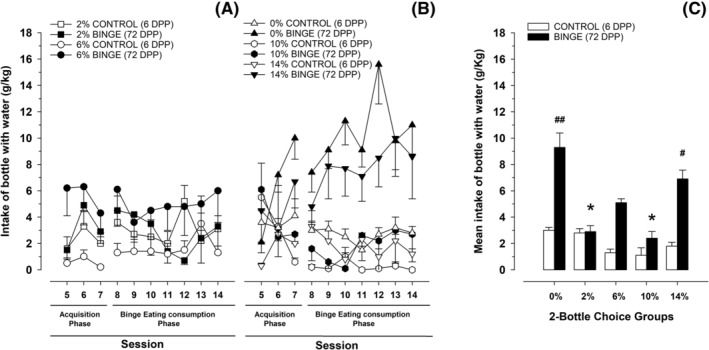
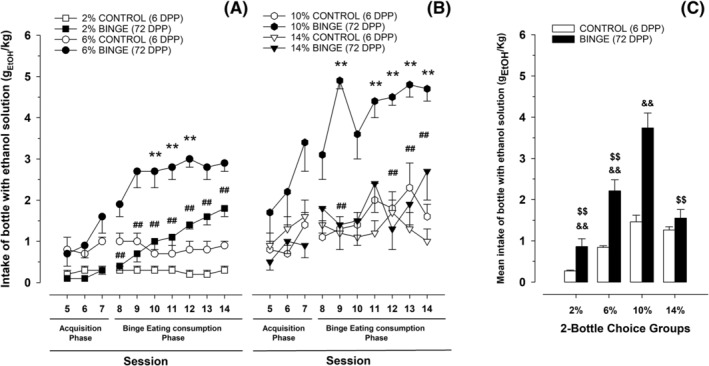
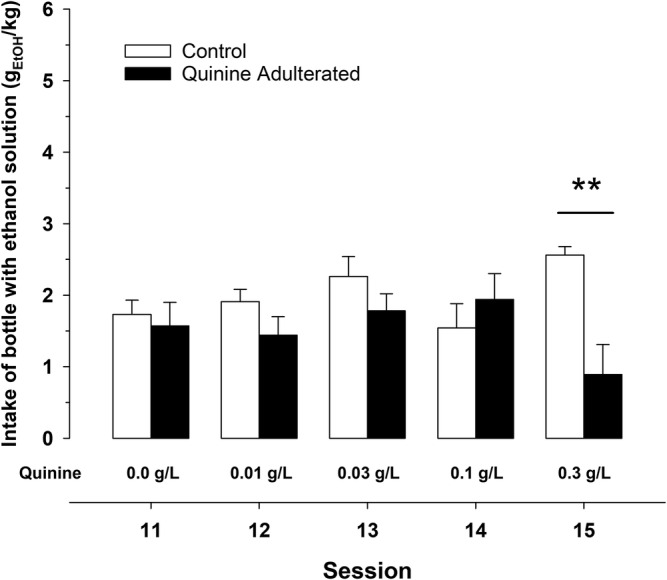
Animal models of alcohol (ethanol) self-administration are crucial to dissect the neurobiological mechanisms underlying alcohol dependence, yet only a few of these induce pharmacologically relevant levels of alcohol consumption and rarely the alcohol self-administration co-occurs with other addictive behaviours. The present study aims to validate a novel model of voluntary ethanol consumption in male Wistar rats, in which ethanol access follows a binge eating experience. Over 10 sessions, Wistar rats were exposed to binge or control eating (i.e., the ingestion of 11.66 and 0.97 kcal/3 min, respectively, derived from a highly palatable food), immediately followed by two-bottle choice intake tests (2%, 6%, 10% or 14% w/w ethanol vs. water). Rats exposed to binge eating drank significantly more 6% or 10% (w/w) ethanol than control peers, reaching up to 6.3 gEtOH /kg. Rats stimulated with 2%, 6%, 10% or 14% ethanol after binge eating, but not those given those ethanol concentrations after control eating, exhibited significant within-group increases in ethanol drinking. This ethanol consumption was not altered by quinine adulteration (up to 0.1 g/L), and it was blocked by naltrexone (10 mg/kg), administered immediately before binge eating. Blood ethanol levels significantly correlated with ethanol consumption; and the more ethanol consumed, the greater the distance travelled in an open field test conducted after the two-bottle choice test. Altogether, this self-administration model seems a valid and robust alternative with remarkable potential for research on different stages of the alcohol addiction and, particularly, to assess interactions between alcohol consumption and others addictive-like behaviours.

Keywords: binge drinking; binge eating; ethanol; naltrexone; self-administration.


Figures

FIGURE 1
FIGURE 1
Schematic representation of body weight scores (solid line) and dustless precision pellet (DPP) consumption (long dash line), exhibited by the rats during the experimental timeline of Experiment 1. The dotted line marks the beginning of the binge eating (BE)‐like DPP consumption
FIGURE 2
FIGURE 2
Panels (A) and (B). Water intake (g/kg) in Wistar rats as a function of ethanol concentration (0%, 2%, 6%, 10% or 14%), eating condition (binge or control dustless precision pellet [DPP] exposure) and session. Panel (C). To facilitate data visualization, this panel depicts the same data as (A) and (B) yet collapsed across sessions. Each point or bar and vertical line represent the mean ± SEM of the values obtained in 7–12 animals per group. (Panel C) Statistically significant differences between the values obtained in binge and control groups in each ethanol concentration: # p < 0.05; ## p < 0.01; and between the values obtained in binge groups compared with 0% ethanol concentration: *p < 0.05
FIGURE 3
FIGURE 3
Panels (A) and (B). Ethanol intake (gEtOH/kg) in Wistar rats as a function of ethanol concentration (2%, 6%, 10% or 14%) and eating condition (binge or control DPP exposure) and session. Panel (C). To facilitate data visualization, this panel depicts the same data as (A) and (B) yet collapsed across sessions. Each point or bar and vertical line represent the mean ± SEM of the values obtained in 7–12 animals per group. (Panels A and B) Statistically significant differences between the values obtained in binge and control groups: *p < 0.05; **p < 0.01; and between the values obtained in binge groups compared with 10% ethanol concentration: # p < 0.05; ## p < 0.01. (Panel C) Statistically significant differences between the values obtained in binge and control groups in each ethanol concentration: && p < 0.01; and between the values obtained in binge groups compared with 10% ethanol concentration: $$ p < 0.01
FIGURE 4
FIGURE 4
Panels (A) and (B). preference scores (percent ethanol preference vs. water) in Wistar rats as a function of ethanol concentration (2%, 6%, 10% or 14%) and eating condition (binge or control dustless precision pellet [DPP] exposure) and session. Panel (C). To facilitate data visualization, this panel depicts the same data as (A) and (B), yet collapsed across sessions. Each point or bar and vertical line represent the mean ± SEM of the values obtained in 7–12 animals per group. A reference line has been set at 50% of preference, indicating that there is no preference at this value
FIGURE 5
FIGURE 5
Association between distance travelled (m) at the open field test or blood ethanol level (mgEtOH/dl, blood ethanol level [BEL]) measured on the day of sampling and ethanol intake scores (gEtOH/kg) achieved by Wistar rats (upper and lower panel). Independent Pearson correlation coefficients indicated that greater ethanol intake was significantly associated with greater distance travelled and with higher BELs
FIGURE 6
FIGURE 6
Effects of the adulteration of the ethanol solution (10% w/w) with increasing quinine concentrations (0.01–0.3 g/L, from Sessions 11 to 15; respectively). Control rats were given exposure to unaltered 10% w/w ethanol. Each bar and vertical line represent the mean ± SEM of the values obtained in 9–10 animals per group. Statistically significant differences in ethanol intake scores between control and quinine adulterated group on session 15 (**p < 0.01)
FIGURE 7
FIGURE 7
Effects of the subcutaneous administration of naltrexone (1–10 mg/kg) on ethanol intake (gEtOH/kg) during Session 12 (administration session), in comparison with Sessions 11 and 13 (pre‐ and post‐administration sessions, respectively). Each bar and vertical line represent the mean ± SEM of the values obtained in 6–12 animals per group. Statistically significant differences between ethanol intake scores obtained in vehicle‐ and 1 mg/kg naltrexone‐treated animals compared with 10 mg/kg of naltrexone‐treated animals: *p < 0.05; **p < 0.01

References

    1. Griswold MG, Fullman N, Hawley C, et al. Alcohol use and burden for 195 countries and territories, 1990‐2016: a systematic analysis for the Global Burden of Disease Study 2016. Lancet. 2018;392(10152):1015‐1035. doi:10.1016/S0140‐6736(18)31310‐2 - PMC - PubMed
    1. Adan A, Benaiges I, Forero DA. Heavy Episodic Drinking or Binge Drinking: A Booming Consumption Pattern. Vol. 1. Elsevier Inc.; 2016. doi:10.1016/B978-0-12-800213-1.00036-5 - DOI
    1. Kuntsche E, Kuntsche S, Thrul J, Gmel G. Binge drinking: health impact, prevalence, correlates and interventions. Psychol Health. 2017;32(8):976‐1017. doi:10.1080/08870446.2017.1325889 - PubMed
    1. National Institute on Alcohol Abuse and Alcoholism . NIAAA council approves definition of binge drinking. NIAAA Newsl Published online 2004:3:3. http://pubs.niaaa.nih.gov/publications/Newsletter/winter2004/Newsletter_...
    1. Ruiz P, Pilatti A, Pautassi RM. Consequences of Alcohol Use, and Its Association with Psychological Distress, Sensitivity to Emotional Contagion and Age of Onset of Alcohol Use, in Uruguayan Youth with or without College Degree. Vol. 82. Elsevier Inc.; 2020. doi:10.1016/j.alcohol.2019.09.001 - PubMed

Publication types