. 2022 Apr 6;14(639):eabm0899.
doi: 10.1126/scitranslmed.abm0899. Epub 2022 Apr 6.

Vaccination with SARS-CoV-2 spike protein lacking glycan shields elicits enhanced protective responses in animal models

Affiliations

Vaccination with SARS-CoV-2 spike protein lacking glycan shields elicits enhanced protective responses in animal models

Han-Yi Huang et al. Sci Transl Med. .

Abstract

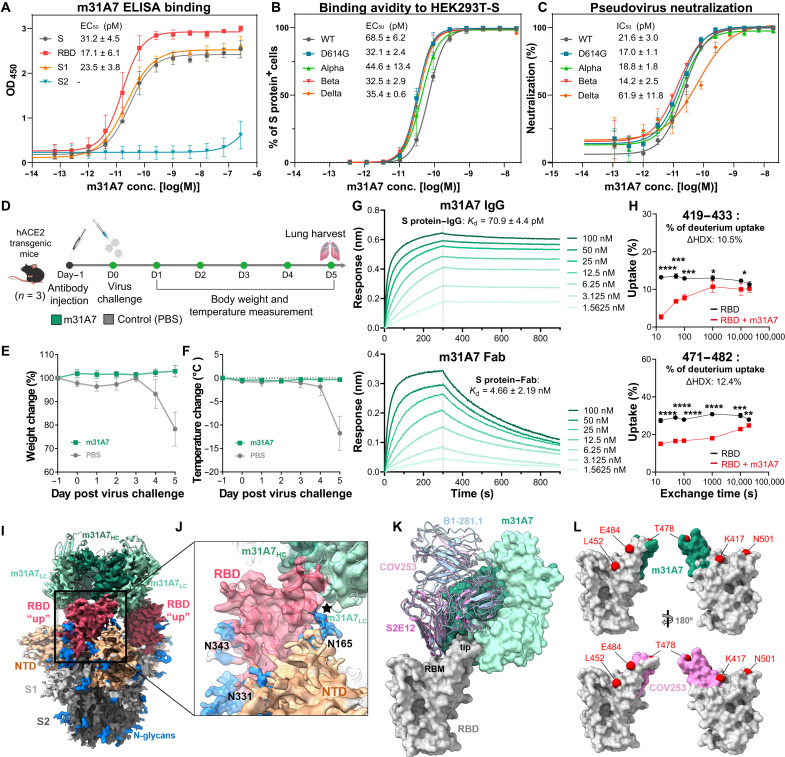
A major challenge to end the pandemic caused by severe acute respiratory syndrome coronavirus 2 (SARS-CoV-2) is to develop a broadly protective vaccine that elicits long-term immunity. As the key immunogen, the viral surface spike (S) protein is frequently mutated, and conserved epitopes are shielded by glycans. Here, we revealed that S protein glycosylation has site-differential effects on viral infectivity. We found that S protein generated by lung epithelial cells has glycoforms associated with increased infectivity. Compared to the fully glycosylated S protein, immunization of S protein with N-glycans trimmed to the mono-GlcNAc-decorated state (SMG) elicited stronger immune responses and better protection for human angiotensin-converting enzyme 2 (hACE2) transgenic mice against variants of concern (VOCs). In addition, a broadly neutralizing monoclonal antibody was identified from SMG-immunized mice that could neutralize wild-type SARS-CoV-2 and VOCs with subpicomolar potency. Together, these results demonstrate that removal of glycan shields to better expose the conserved sequences has the potential to be an effective and simple approach for developing a broadly protective SARS-CoV-2 vaccine.


Figures

Fig. 1.
Fig. 1.. S protein glycosylation impacts ACE2 receptor binding and SARS-CoV-2 infection.
(A to C) Binding avidity of ACE2 was measured for differently glycosylated S protein ectodomains (SFG; original fully glycosylated, blue; deS, nonsialylated, light blue; SHM, high-mannose, yellow; and SMG, mono-GlcNAc, red) from BEAS-2B (A), HEK293T (B), and HEK293S (GnTI¯) cells without or with Endo H digestion (C). Data of three technical replicates are shown as means ± SD, and curves fit by nonlinear regression for EC50 values. (D) Viral infectivity was measured for pseudoviruses carrying differently glycosylated S protein with the same input amount (0.3 μg/ml of p24 equivalent) colored accordingly as in (C). RLU, relative luminescence unit. Data of six technical replicates shown as means ± SD and analyzed with ordinary one-way ANOVA test followed by Tukey’s multiple comparisons test. ns, not significant; ****P < 0.0001. (E) A schematic view of SARS-CoV-2 S protein [wild type (WT)] is shown colored by domain, including N-terminal domain (NTD; 14–306; orange), receptor binding domain (RBD; 319–541; red), two subdomains (SD1/2; 542–685; yellow), fusion peptide proximal region (FPPR; 816–856; green), heptad repeat 1 (HR1; 912–984; teal), connecting domain (CD; 1063–1162; blue), heptad repeat 2 (HR2; 1163–1211; purple), and transmembrane domain (TM; 1214–1234; white). N-glycan (drawn as branches) and O-glycan (circles) sites are marked with residue number. S1 and S2 domains are shown above. (F) Viral titers are shown for pseudoviruses carrying WT S protein or mutants with glycans removed at each shown glycosite, normalized by p24 quantification, and colored accordingly as in (E). (G) Infectivity of the same panel of pseudoviruses as in (F) tested in five hACE2-expressing cell lines. Values in (F) and (G) are normalized against WT values (defined as 100%, colored in dark gray) with means ± SD of three independent experiments.
Fig. 2.
Fig. 2.. S protein glycan profiles demonstrate differences in two cell lines and correlate with sequence conservation.
(A and B) A comparison of the N-glycosylation profile of recombinant S protein expressed from BEAS-2B lung epithelial cells (A) and HEK293T kidney epithelial cells (B) is shown. Glycans are grouped and colored accordingly: complex-S (sialylated complex type; dark blue), complex (non–sialylated complex type; light blue), hybrid-S (sialylated hybrid type; dark yellow), and hybrid (nonsialylated hybrid type; light yellow), high mannose (green), and unoccupied (gray). The percentage of each group is shown for each glycosite in a pie chart, and the proportion of each glycoform (nos. 1 to 27) in a bar chart. The bar graphs represent the means ± SD of three biological replicates. Detailed structure and percentage of each glycoform can be found in tables S1 to S3 and figs. S4 to S6. Fhybrid indicates fucosylated hybrid-type glycans. (C) Glycan profiles from (A) and (B) were mapped on the 3D structure of S ectodomain (modeled from 6VSB). Glycans are colored by the highest-abundance group for BEAS-2B (left) or HEK293T (right) data as labeled (complex type, blue; hybrid type, yellow; and high mannose, green). Non–complex-type N-glycosites are labeled with residue number. (D) Mapping of relative surface accessibility (RSA) on modeled S structure protein is shown, with buried residues colored in dark yellow, glycan shielded in yellow, and exposed in light yellow. (E) Mapping of sequence variation on modeled S protein structure is shown, colored in a heatmap, with darker red indicating higher mutation rates. Several highly conserved glycan-shielded regions are highlighted. More details for (D) and (E) can be found in fig. S9 and data file S1.
Fig. 3.
Fig. 3.. SMG vaccination elicits stronger humoral and cellular immune responses than SFG in BALB/c mice.
(A) Structural models of SFG and SMG protein vaccine are shown (according to Fig. 2C). Blue: glycans; gray: protein. SFG was expressed by HEK293E without further modification. SMG was obtained by enzymatic digestion to truncate all N-glycans of SHM expressed by HEK293S GnTI¯ to single GlcNAc, whereas O-glycans were unmodified. (B) Immunization schedule using proteins as in (A) as immunogens in BALB/c mice (n = 5 in each experiment). SFG (blue), SHM (yellow), SMG (red), and control (gray). Alum, aluminum hydroxide. (C) Anti–S protein IgG titers of serum samples were analyzed by ELISA. (D) Neutralization titers of serum samples were measured using pseudovirus with WT S protein. (E to G) IgG subtype analysis of sera, including IgG1 (E), IgG2a (F), and the IgG2a:IgG1 ratio (G). (H to K) The percentage of Tfh in activated nonregulatory CD4 T cells (H) and the percentages of IFN-γ (I)–, IL-4 (J)–, and IL-21 (K)–expressing Tfh cells (CD4+CD19CD44hiFoxp3PD-1+CXCR5+) in the lymph nodes (LNs) of BALB/c mice by flow cytometry. (L) The percentage of granzyme B−producing CD8+ T cells (CD3+ B220CD8+ CD49b) in the LN of BALB/c mice analyzed by flow cytometry. (M) The ratio of S protein–specific B cells (CD3CD19+S protein+) (percentage) normalized to fluorescence minus one (FMO) control staining (stained without S protein) (percentage) in the spleen is shown. (N) Kappa and lambda light chain usage is shown. (O and P) Heavy (O) and kappa (P) chain distribution of B cell repertoire analysis. Less than 5% usage is shown in white. (Q to S) Anti−S protein IgG titers (Q), pseudovirus neutralization titers (R), and authentic virus neutralization titers (S) are shown for serum isolated from BALB/c mice after three doses of indicated vaccines against SARS-CoV-2 WT (or D614G) and variants (number above each bar indicate fold of increase of SMG compared to SFG group). pNT50 represents the reciprocal dilution achieving 50% neutralization. The dotted line in bar charts represents the lower limit of detection. Data are shown as means ± SEM and analyzed by two-sided Mann-Whitney U test to compare two experimental groups, except in (N), where five samples were pooled together and a chi-squared test was used. P values shown above each bar. *P < 0.05; **P < 0.01.
Fig. 4.
Fig. 4.. SMG vaccination provides enhanced protection against SARS-CoV-2 infection in vivo.
(A) The immunization schedule for Syrian hamsters is shown. SFG (blue), SMG (red), and control (gray). (B) Weight change was measured in Syrian hamsters after WT SARS-CoV-2 challenge. (C) Lung virus titers of challenged hamsters are shown. The dashed line indicates the lower limit of detection. (D) Representative images shown histopathology, immunohistochemistry, and immunofluorescence of the lungs from an infected hamster (3 dpi). First row: Hematoxylin and eosin (H&E) staining; scale bar, 50 μm. Second row: Immunohistochemistry (IHC) staining; scale bar, 50 μm. Third row: Immunofluorescence (IF) staining; scale bar, 100 μm. SARS-CoV-2 N-specific polyclonal antibodies were used for virus detection as brown dots in IHC and green dots in IF staining. Blue: 4,6-diamidino-2-phenylindole (DAPI). (E) The immunization schedule for CAG-hACE2 or K18-hACE2 transgenic mice is shown. (F to I) Anti−S IgG titers (F), SARS-CoV-2 WT microneutralization titers (G), and subtype IgG analysis, including IgG1, IgG2c (H), and IgG2c:IgG1 ratio (I), are shown for serum samples collected from immunized CAG-hACE2 transgenic mice (n = 7). (J) Representative histopathology, immunohistochemistry, and immunofluorescence of the infected mouse lungs (7 dpi) are shown. Scale bars are the same as in (D). (K) Lung virus titers of the infected CAG-hACE2 mice (n = 3). The dashed line indicates the lower limit of detection. (L and M) Weight change (L) and survival analysis (M) are shown for WT-SARS-CoV-2–challenged CAG-hACE2 transgenic mice (n = 4). (N and O) Weight change (N) and survival analysis (O) are shown for SARS-CoV-2 alpha variant–challenged CAG-hACE2 transgenic mice (n = 5). (P and Q) Weight change (P) and survival analysis (Q) are shown for SARS-CoV-2 gamma variant–challenged CAG-hACE2 transgenic mice (n = 5). (R and S) Weight change (R) and survival analysis (S) are shown for SARS-CoV-2 delta variant–challenged K18-hACE2 transgenic mice (n = 4). Data are shown as means ± SEM and analyzed by two-sided Mann-Whitney U tests to compare two experimental groups. ns, not significant; *P < 0.05.
Fig. 5.
Fig. 5.. Functional, prophylactic, and structural characterization of antibody m31A7 elicited by SMG vaccination indicates cross-neutralizing capacity.
(A) ELISA binding of m31A7 to S1, S2, RBD, or the entire S ectodomain. (B) Flow cytometry analysis of m31A7 binding to HEK293T cells expressing S protein of SARS-CoV-2 WT and variants. (C) Neutralization activity of m31A7 against pseudoviruses carrying WT or variant S proteins. Data of three technical replicates for (A), (B), and (C) are shown as means ± SD and curves fit by nonlinear regression for EC50 values. (D) Antibody injection and challenge schedule for K18-hACE2 transgenic mice (n = 3) is shown. (E and F) Weight change (E) and body temperature change (F) are shown for mice treated with m31A7 or PBS. Data are presented as means ± SEM. (G) Binding kinetics of m31A7 IgG and Fab to S protein are presented, with dissociation constants (Kd) shown above. (H) Epitope mapping by HDX-MS of m31A7 is shown in a time course revealing two peptide candidates, 419–433 and 471–482, with greater than 10% ΔHDX at 15 s. Data are shown as means ± SD and analyzed by multiple t tests at each time point. *P < 0.05; **P < 0.01; ***P < 0.001; ****P < 0.0001. (I) The cryo-EM map fitted with m31A7-Fab/S protein complex structure is shown. Heavy chain, dark green; light chain, light green; RBD, red; NTD, orange; the rest of S1, light gray; S2, dark gray; and N-glycans, blue. (J) An enlarged view of RBD-m31A7 interface is shown. The star marks the vicinity between m31A7 light chain and N165-glycan. (K) Superimposition of previously reported mAbs S2E12 (magenta), COV253 (pink), and B1-182.1 (light blue) (PDB 7BEN, 7K4N, and 7MLZ) onto the m31A7-bound RBD (gray). The receptor binding motif and RBD tip are highlighted. (L) A footprint comparison of COV253 (pink) and m31A7 (green) on RBD (gray) shows similarity, with residues of VOCs labeled and drawn as red spheres.

References

    1. Klasse P. J., Nixon D. F., Moore J. P., Immunogenicity of clinically relevant SARS-CoV-2 vaccines in nonhuman primates and humans. Sci. Adv. 7, eabe8065 (2021). - PMC - PubMed
    1. Watanabe Y., Allen J. D., Wrapp D., McLellan J. S., Crispin M., Site-specific glycan analysis of the SARS-CoV-2 spike. Science 369, 330–333 (2020). - PMC - PubMed
    1. Zhao P., Praissman J. L., Grant O. C., Cai Y., Xiao T., Rosenbalm K. E., Aoki K., Kellman B. P., Bridger R., Barouch D. H., Brindley M. A., Lewis N. E., Tiemeyer M., Chen B., Woods R. J., Wells L., Virus-receptor interactions of glycosylated SARS-CoV-2 spike and human ACE2 receptor. Cell Host Microbe 28, 586–601.e6 (2020). - PMC - PubMed
    1. Allen J. D., Chawla H., Samsudin F., Zuzic L., Shivgan A. T., Watanabe Y., He W.-T., Callaghan S., Song G., Yong P., Brouwer P. J. M., Song Y., Cai Y., Duyvesteyn H. M. E., Malinauskas T., Kint J., Pino P., Wurm M. J., Frank M., Chen B., Stuart D. I., Sanders R. W., Andrabi R., Burton D. R., Li S., Bond P. J., Crispin M., Site-specific steric control of SARS-CoV-2 spike glycosylation. Biochemistry 60, 2153–2169 (2021). - PMC - PubMed
    1. Bouwman K. M., Tomris I., Turner H. L., van der Woude R., Shamorkina T. M., Bosman G. P., Rockx B., Herfst S., Snijder J., Haagmans B. L., Ward A. B., Boons G.-J., de Vries R. P., Multimerization- and glycosylation-dependent receptor binding of SARS-CoV-2 spike proteins. PLOS Pathog. 17, e1009282 (2021). - PMC - PubMed

Publication types