. 2022 Mar 7;219(3):e20212045.
doi: 10.1084/jem.20212045. Epub 2022 Mar 1.

Epitope convergence of broadly HIV-1 neutralizing IgA and IgG antibody lineages in a viremic controller

Affiliations

Epitope convergence of broadly HIV-1 neutralizing IgA and IgG antibody lineages in a viremic controller

Valérie Lorin et al. J Exp Med. .

Abstract

Decrypting the B cell ontogeny of HIV-1 broadly neutralizing antibodies (bNAbs) is paramount for vaccine design. Here, we characterized IgA and IgG bNAbs of three distinct B cell lineages in a viremic controller, two of which comprised only IgG+ or IgA+ blood memory B cells; the third combined both IgG and IgA clonal variants. 7-269 bNAb in the IgA-only lineage displayed the highest neutralizing capacity despite limited somatic mutation, and delayed viral rebound in humanized mice. bNAbs in all three lineages targeted the N332 glycan supersite. The 2.8-Å resolution cryo-EM structure of 7-269-BG505 SOSIP.664 complex showed a similar pose as 2G12, on an epitope mainly composed of sugar residues comprising the N332 and N295 glycans. Binding and cryo-EM structural analyses showed that antibodies from the two other lineages interact mostly with glycans N332 and N386. Hence, multiple B cell lineages of IgG and IgA bNAbs focused on a unique HIV-1 site of vulnerability can codevelop in HIV-1 viremic controllers.


Conflict of interest statement

Disclosures: F.A. Rey is a board member of EureKARE and MELETIUS Therapeutics. No other disclosures were reported.

Figures

Figure 1.
Figure 1.
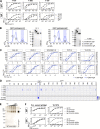
Capture of broadly HIV-1 neutralizing IgG and IgA memory B cell antibodies. (A) Radar plots comparing the in vitro neutralizing activity of IgG (red) and IgA (blue) antibodies purified from elite neutralizers’ sera against a five-virus panel. (B) Heatmaps showing the in vitro neutralizing activity (IC50 in µg/ml) of purified serum IgG and IgA antibodies against two 12-virus reference panels as measured in the TZM-bl assay. (C) ELISA graphs (left) and flow cytometry plots (right) show the binding to BG505 SOSIP. 664 and YU2 foldon-type gp140 (gp140-F) trimers of purified serum IgG/IgA and IgG+/IgA+ memory B cells, respectively. OD405nm, optical densities at 405 nm. Means ± SD of duplicate OD405nm values are shown. (D) Pie charts (left) showing the distribution of unique vs. clonally expanded (Exp.) clones isolated by flow cytometric single B cell sorting using BG505 SOSIP.664 (top) and YU2 gp140-F (bottom) as baits. Colored slices indicate bNAb clonotypes for which dendrograms (right) show the relationship between clonally related IgH nucleotide sequences. Only antibodies highlighted in bold were expressed. (E) ELISA graphs comparing the reactivity of the selected HIV-1 bNAbs to recombinant Env proteins. Means ± SD of duplicate OD405nm values are shown. (F) Heatmap showing the neutralization breadth and potencies of selected anti-gp160 IgG and IgA antibodies as measured in the TZM-bl assay. Means of duplicate values from two independent experiments are shown. Gray cells indicate nontested viruses with 7-319 only. (G) Heatmap comparing the antibody reactivity to Env proteins and neutralizing potencies of 7-107/7-269 clonal variants. (H) Neutralization coverage graph of 7-269 IgA bNAb against a panel of 56 viruses as measured in the TZM-bl assay. The y axis shows the cumulative frequency of IC50 values up to the concentration shown on the x axis. The radar plot (upper left corner) shows the frequency distribution of neutralized viruses according to HIV-1 clades. (I) Coverage neutralization graph (left) comparing the breadth and potency of 7-269 IgA with 10-1074 and PGT121 IgG antibodies (historical data; Bouvin-Pley et al., 2014) in the TZM-bl assay against a clade B-virus panel (n = 38) covering three periods of the HIV-1 epidemic. Violin plots (middle) show neutralization IC50 values for individual pseudotyped virus according to the periods of the epidemic. Pie charts (right) indicate the percentage of neutralized viruses by 7-269 per period. (J) Table presenting the immunoglobulin gene characteristics of the three bNAb clonotypes. n VH Mut, number of somatic mutations in the VH gene. (K) Bubble plot showing the percentage of clonal-related sequences (seq.) for the three pt7 bNAb lineages among all IgH sequences generated by Ig-HTS on DNA libraries from peripheral blood and bone marrow mononuclear cells, and filtered on bNAb-specific V-J rearrangements. (L) Representative graph showing the neutralizing (Neut.) activity of purified monomeric and dimeric 7-269 IgA antibodies (mIgA and dIgA, respectively) against YU2 pseudoviruses as measured in the in vitro TZM-bl assay. Means of duplicate values are shown. Heatmap (right) comparing the IC50 values (nM) of 7-269 mIgA and dIgA antibodies against the selected HIV-1 strains. Means of duplicate values from two independent experiments are shown as in Fig. S2 C. FC, fold-change; norm, normalized values according to the number of antibody binding sites.
Figure S1.
Figure S1.
HIV-1 neutralization by pt7 serum and monoclonal antibodies. (A) Table shows the neutralizing activity of serum IgGs and IgAs purified from six viremic controllers against selected clade B viruses (n = 5). IC50 values (µg/ml) are indicated in cell center. Darker colors indicate higher potency; white, no neutralization. (B) Tables comparing ELISA binding to HIV-1 Env proteins (top) and neutralizing activity against selected clade B viruses (n = 5, bottom) of monoclonal antibodies cloned from pt7 blood IgG+ (red) and IgA+ (blue) memory B cells. 7-125S and 7-216S, SOSIP-isolated antibodies. Darker colors indicate higher Env reactivity or neutralization potency; white, no binding or neutralization. ELISA AUC and IC50 values (µg/ml) are indicated in cell center. Dotted links indicate clonally related members. 10-1074 is the positive control. (C) Table shows the neutralizing activity of selected antibodies produced as recombinant IgGs against 12-virus reference panels. IC50 and IC80 values (µg/ml) are indicated in cell center. Darker colors indicate higher potency; white, no neutralization. (D) Same as C but for clade B viruses only and 7-319 IgG, 7-269 IgG and IgA antibodies. IC50 values (µg/ml) are shown. (E) Same as B but for 7-107 clonal variants expressed as IgGs. (F) Same as C but for 7-269 IgA against a cross-clade extended panel (n = 56). For each viral strain, amino acids at PNGS N295 and N332 are indicated. (G) Same as F but with clade B viruses from three epidemic periods.
Figure S2.
Figure S2.
IgA profiles of pt7 bNAbs and purified serum antibodies. (A) ELISA binding analysis comparing the reactivity of pt7 bNAbs expressed as IgG and IgA against HIV-1 Env proteins. Means ± SD of duplicate OD values are shown. (B) Purification of monomeric and dimeric 7-269 IgA antibodies. FPLC chromatograms show the protein separation of IgA monomers, dimers, and multimers by SEC in two separate experiments. The x axis shows the elution volume (eV) required to obtain the values of absorption units at 280 nm (mAU) indicated on the y axis. Light blue bars indicate selected fractions. Silver-stained SDS-PAGE gels on the right show the protein bands in the purified pooled fractions. (C) Graphs comparing the neutralizing activity of monomeric and dimeric 7-269 IgA antibodies (mIgA and dIgA, respectively) against the selected pseudoviruses as measured in the in vitro TZM-bl assay. Means ± SD of duplicate values for two independent experiments are shown. mIgA and dIgA antibodies from purification 1 were tested in neutralization experiment 1, and mIgA and dIgA antibodies from purification 2 were used in experiment 2. (D) Heatmap showing the ELISA binding analysis of selected pt7 bNAbs against consensus subtype B overlapping Env peptides. Darker colors indicate higher reactivity (OD values); white, no binding. Non–HIV-1 mGO53 and anti-V3crown 10-188 antibody are negative and positive controls, respectively. (E) Silver-stained SDS-PAGE gel shows purified pt7 serum IgAs (ranging from 100 to 500 ng) in nonreducing and nonheated conditions. Monomeric 10-1074 IgA1 antibodies were used as a control. * and ** indicate monomeric and dimeric IgA antibodies, respectively. (F) ELISA binding analysis comparing the reactivity of purified IgG and IgA antibodies from pt7 serum against HIV-1 Env gp120 and selected mutant proteins. Means ± SD of triplicate OD values are shown. 10-1074 IgG1 and IgA1 antibodies were used as controls.
Figure S3.
Figure S3.
Lineage tracing of pt7 bNAbs in the blood and bone marrow. (A) Plots show divergence/identity analysis of pt7 IgG and IgA heavy chain (IgH) sequences obtained by Ig-HTS from peripheral blood (B) and bone marrow (BM) mononuclear cells. IgH sequences filtered on bNAb-specific V-J rearrangements (total numbers are shown below the plots) are depicted as function of the identity to bNAb reference sequence (% bNAb-id) and of divergence to inferred GL sequence (% GL-div). Gate numbers indicate the % of bNAb-relative sequences. (B) Divergence/identity plots showing the overlay of 7-176 and 7-269 sequences from pt7 blood and bone marrow IgA and IgG DNA libraries as shown in A. (C) Phylogenic tree (right) shows the relationship between 7-269 clonally related IgH nucleotide sequences found by high-throughput sequencing in blood and bone marrow IgA-expressing cells (in dark and light blue, respectively) and the bone marrow IgG repertoire (in light red) as shown in B, and by single B cell gp160-capture (as shown in Fig. 1 D, blue) used as reference sequences (in black). Only bone marrow 7-269–related sequences with GL divergence ≤4% were included in the phylogenic analysis. (D) Sequence logo showing the alignment of the CDRH3s from the VH sequences obtained by Ig-HTS shown in C (n = 131). The frequency of Cys residues in position 105 and 110 is shown below.
Figure 2.
Figure 2.
In vivo neutralization and in vitro antiviral properties of 7-269 IgA bNAb. (A) In vivo neutralization activity of human 7-269 bNAb in HIV-1–infected hu-mice. Graphs compare HIV-1 plasma viremia in ART-treated BRGS hu-mice receiving a single i.p. injection (0.5 mg) of 7-269 (n = 5) or mGO53 control (n = 8) IgA antibodies 24 h before ART interruption. (B) Kaplan–Meier analysis of the in vivo effect of 7-269 IgA on viral rebound (VR) following ART interruption. Groups were compared using log-rank (Mantel–Cox) test. (C) Dot plots comparing the percentage of transcytosis (top) and post-transcytosis infectivity (as RLU, bottom) of AD8 and CH058 virions alone (No Ab), in the presence of non–HIV-1 mGO53 control (Ctr) and 7-157 and 7-269 IgA antibodies. Mean values of triplicate values from two independent experiments are shown. Antibody groups were compared to the No Ab group using Mann–Whitney test. **, P < 0.01; ns, not significant. (D) Heatmap comparing the percentage of target cells infected by lab-adapted (AD8, YU2) and T/F (CH058, CH077, THRO) viruses, and bound by selected IgG antibodies (IgG+Gag+) as measured by flow cytometry. Mean values from two independent experiments are shown. (E) Binding of IgA bNAbs to HIV-1–infected cells. Flow cytometric histogram (top left) shows the reactivity of 7-269 IgA antibodies to Gag+ infected target cells. Heatmap (bottom left) shows the same as in D but for IgA antibodies. Graphs (right) show antibody binding titrations to AD8- and CH058-infected cells, measured as percentage IgA+ among Gag+ cells by flow cytometry. Mean values from two independent experiments are shown. FI, fluorescence intensity. (F) ADCC potential of pt7 bNAbs expressed as IgG antibodies against AD8-infected target cells. Flow cytometric histogram (left) comparing the percentage of FarRed+Gag+ cells among infected CEM.NKR cells incubated with 7-269 IgG or non–HIV-1 isotype control (mGO53, IgGCtr) in the presence of human NK cells or not. Histogram (right) comparing the percentage ADCC of AD8-infected targets incubated with selected IgG and IgA antibodies. PGT128 and 10-1074 are positive controls, and mGO53 is the negative control. Dots correspond to means of percentage ADCC values measured in duplicate for each NK-isolated human donor (n = 4 and n = 5 for IgAs and IgGs, respectively). (G) Competition ADCC. Heatmap (left) showing competition for ELISA binding to BG505 SOSIP.664 of selected HIV-1 bNAbs. Lighter colors indicate stronger inhibition; dark blue indicates no competition. Dot plot (right) comparing the percentage ADCC of AD8-infected targets by 7-319 and PGT128 IgG antibodies in the presence of 7-269 IgA used as competitor. Dots correspond to means of percentage ADCC values measured in duplicate for each NK-isolated human donor (n = 8). Groups were compared using two-tailed Wilcoxon test. **, P < 0.01. (H) Bar graphs showing the ADCP activity of selected IgA (blue) and IgG (red) antibodies expressed as normalized PS (nPS). Each dot corresponds to a healthy donor of primary monocytes (n = 4 or 8) and presents the mean of duplicate nPS values. d10-1074, dimeric 10-1074 IgA; 10-1074G, 10-1074GASDIE mutant antibody. Antibody groups were compared to the control (Ctr) group using two-tailed Mann–Whitney test. Only P values <0.05 are indicated: *, P < 0.05; **, P < 0.01. (I) Monocyte- and neutrophil-mediated ADCC potential of 7-269 IgA bNAb against AD8-infected target cells. Bar graphs comparing the percentage of FarRed+Gag+ cells among infected CEM.NKR cells incubated with 7-269 IgA1, 10-1074 IgA1, or non–HIV-1 isotype control (mGO53 IgA1, Ctr) in the presence of human monocytes or neutrophils with target:effector ratios of 1:5, 1:10, and 1:20. Each dot corresponds to a healthy donor of primary monocytes and neutrophils (up to n = 4) and presents the mean of duplicate values. P values comparing HIV-1 antibodies with the control (Ctr) using two-tailed Mann–Whitney test were not significant.
Figure S4.
Figure S4.
Fc receptor expression on human immune effector cells. (A) Representative flow cytometric histogram showing the surface expression of selected Fc receptors (FcR) on purified human monocytes used for ADCP with gp140-coupled beads (left). FI, fluorescence intensity. Gray histograms correspond to unstained cell controls. Dot plot shows the surface expression of selected FcR on human monocytes purified from four donors (right). Percentage of CD16high cells (left y axis) and ΔMFI for all FcR are shown. (B) Representative flow cytometric histogram showing the binding of recombinant Fc proteins and IgA1 antibodies to purified human monocytes used for ADCP with gp140-coupled beads (left). Dot plot shows the binding of Fc proteins and IgA1 antibodies to human monocytes purified from four donors (right). m, monomeric; d, dimeric. (C) Representative flow cytometric histogram showing the binding of 10-1074 IgG antibodies to YU2 gp140-F-coupled FITC beads. mGO53 antibody is the negative isotypic control. (D) Same as in A but for purified human monocytes and neutrophils used as effectors in co-culture with HIV-1–infected CEM-NKR-CCR5 cells.
Figure 3.
Figure 3.
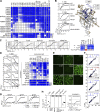
Binding characteristics of coexisting IgG and IgA bNAbs. (A) Heatmap showing the ELISA binding of selected HIV-1 bNAbs to recombinant mutant, kifunensine-treated (gp120kif), V3 loop-deleted (gp120ΔV3) gp120 proteins. Color value is proportional to the reactivity level measured as percentage of binding compared to WT gp120 in at least two independent experiments. (B) Representative ELISA graphs (top left) comparing the binding of selected antibodies from each identified bNAb clonotypes to WT and mutant proteins carrying sensitive substitutions. Means ± SD of duplicate OD405nm values from two independent experiments are shown. Ribbon diagram showing the crystal structure of glycosylated gp120 subunit (gray; glycans in orange; PDB accession no. 5T3Z), in which putative contacting glycans of prototypical bNAbs are colored in blue. (C) Representative graphs showing the neutralizing activity of 7-269 IgA, 7-155 IgG, and control IgG bNAbs against YU2 pseudoviruses produced in the presence of kifunensine (YU2kif; dotted lines) or not (YU2; straight lines). Means ± SD of duplicate values are shown. The heatmap (right) compares the IC50 values (µg/ml) of the selected bNAbs against YU2 and YU2kif. FC, fold-change. Mean values from two independent experiments are shown. (D) Competition ELISA graphs (left) comparing the binding of selected biotinylated bNAbs (-bio) in the presence of potential bNAb competitors. Means ± SD of duplicate OD405nm values from two independent experiments are shown. Heatmap (right) showing competition for BG505 SOSIP.664 binding of selected HIV-1 bNAbs. Lighter colors indicate stronger inhibition; dark blue indicates no competition. (E) Binding of selected HIV-1 bNAbs to HEp2-expressing self-antigens as assayed by indirect IFA. Ctr+, positive control; Ctr− and ED38 are negative and low positive control antibodies, respectively. The scale bars represent 40 µm. (F) Microarray plots showing the reactivity of selected HIV-1 bNAbs to human proteins. Each spot corresponds to the z-scores given on a single protein by the reference antibody (Ref: mGO53, y axis) and test antibody (x axis). Red dots indicate immunoreactive proteins (z > 5) presented in Table S2. Frequency histograms in the upper left corner show the log10 protein displacement (σ) of the MFI signals for HIV-1 bNAbs compared to nonreactive antibody mGO53. The PI corresponds to the Gaussian mean of all array protein displacements. (G) ELISA graphs comparing the binding to Env proteins of the selected bNAbs, GL, and mutated-GL hybrid counterparts. Means ± SD of triplicate OD405nm values are shown (representative of three independent experiments). (H) In vitro neutralizing activity of mutated, GL, and hybrid versions of 7-269 bNAb. Dot plot (left) comparing the IC50 values for the neutralization of clade B viruses (n = 5) as determined in the TZM-bl assay. 10-1074 and 7-269 are positive controls. Neutralization graph (right) shows the neutralizing activity of 7-269 and 7-269.IgLGL against SC422661.8. Means ± SD of duplicate IC50 values are shown (representative of three independent experiments).
Figure 4.
Figure 4.
Structural analyses of the BG505 SOSIP.664-7-269 IgA Fab complex. (A) Side view (left) and top view (right) of the 2.8-Å single-particle cryo-EM reconstruction of the BG505 SOSIP.664-7-269-3BNC117 complex colored by components (dark gray, gp41; light gray, gp120; blue, 7-269 VH; light-blue, 7-269 VL; pink, 3BNC117 Fab; green, N-glycans). (B) Structure of the BG505 SOSIP.664-7-269 complex with other anti-glycan V3 bNAbs superimposed. One protomer was aligned to gp120 in the complex with 10-1074 (PDB accession no. 5T3Z), while another protomer was superimposed to the structure of the Env with 2G12 (PDB accession no. 6OZC). Only the variable heavy and light chains are shown, and the N332 glycan is indicated (green). (C) Structure of the HIV-1 Env-7-269 protomer highlighting in sticks the glycans that establish major (N295 and N332) and minor (N262, N411) contacts with the antibody. The inset in the top right corner presents the glycan residues modeled at each position, indicating with filled symbols those in contact with 7-269. Squares and circles represent N-acetylglucosamine and mannose residues, respectively. (D) Mapping of the 7-269 epitope (colored in blue) on the density from the EM map corresponding to the BG505 SOSIP.664 trimer. The glycans in the interface are shown in sticks, with the sugar residues forming the epitope in blue. (E) Surface representation of the 7-269 variable domains with residues contacting a particular glycan (or glycan and gp120) indicated in the same color. (F) Structural superposition of the IgH and IgL variable domains (VH and VL, respectively) from 7-269 and anti-glycan-V3 bNAbs that have either a protruding CDRH3 with a β-hairpin (left; 10-1074 [PDB accession no. 5T3Z] and 3H+109L [PDB accession no. 5CEZ]) or an extended or short CDRH3 (438-B11 [PDB accession no. 6UUH], BG18 [PDB accession no. 6CH7], and 2G12 [PDB accession no. 6OZC]). (G) Structural superposition of the variable domains from 7-269 and anti-HIV bNAbs harboring an intra-CDRH3 disulfide bond (yellow sticks) and targeting the glycans-V3 (438-B11 [PDB accession no. 6UUH]), glycans-V1/2 (CAP256-VR26.03 [PDB accession no. 4OD1]), and the CD4bs (45-VRC01.H5.F-117225 [PDB accession no. 4S1S]). (H) ELISA graphs comparing the Env binding of 7-269 and associated CDRH3 cysteine mutant antibodies. Means ± SD of duplicate OD405nm values are shown (representative of two independent experiments). (I) Heatmap comparing the neutralizing activity of 7-269 and associated CDRH3 cysteine mutant antibodies as measured in the TZM-bl assay. Representative data of two independent experiments are shown. <, IC50 below the depicted value.
Figure S5.
Figure S5.
Interactions at the BG505 SOSIP-7-269 Fab interface. (A–D) Potential hydrogen bonds formed at the interface of the BG505 SOSIP-7-269 IgA Fab complex. The table in A indicates the atoms involved in forming potential hydrogen bonds at the complex interface and the distance between them. This information is also represented in B–D, where the electron density in which the glycans were built is also shown. (E) Stick representation of residues forming Van der Waals contacts between 7-269 and the gp120 protein subunit. The disulfide bond between C105 and C110 in the CDRH3 is also represented as sticks. For better clarity, glycans are not shown.
Figure 5.
Figure 5.
Cryo-EM structures of 7-155 and 7-176 in complex with BG505 SOSIP.664 trimer. (A) Side view (left) and top view (right) of the 6.7-Å single-particle cryo-EM reconstruction of HIV-1 BG505 SOSIP.664 Env in complex with 7-155 IgG Fab. (B) Same as in A but for the 7.0-Å cryo-EM reconstruction of Env-7-176-IgG Fab complex. (C) Model of the BG505 SOSIP.664-7-155 complex (side view) obtained by fitting the BG505 SOSIP.664 structure and homology models from the antibodies’ variable regions and the BG505 SOSIP.664 structure into their respective single-particle reconstructions. The glycosylated BG505 SOSIP.664 structure was taken from the complex with 7-269, and some mannose residues were trimmed to avoid clashes with the modeled antibody. (D) Same as in C but for BG505 SOSIP.664-7-176 complex. (E) Superposition of the reconstructions obtained for the three BG505 SOSIP.664-bNAb complexes studied (side and top views), showing the overlap between their respective binding sites. For a better comparison, the data from the BG505 SOSIP.664-7-269-3BNC117 complex was reprocessed with a resolution limit of 7 Å.

References

    1. Anthony, C., York T., Bekker V., Matten D., Selhorst P., Ferreria R.C., Garrett N.J., Karim S.S.A., Morris L., Wood N.T., et al. . 2017. Cooperation between strain-specific and broadly neutralizing responses limited viral escape and prolonged the exposure of the broadly neutralizing epitope. J. Virol. 91:e00828-17. 10.1128/jvi.00828-17 - DOI - PMC - PubMed
    1. Astronomo, R.D., Santra S., Ballweber-Fleming L., Westerberg K.G., Mach L., Hensley-McBain T., Sutherland L., Mildenberg B., Morton G., Yates N.L., et al. . 2016. Neutralization takes precedence over IgG or IgA isotype-related functions in mucosal HIV-1 antibody-mediated protection. EBioMed. 14:97–111. 10.1016/j.ebiom.2016.11.024 - DOI - PMC - PubMed
    1. Barnes, C.O., Gristick H.B., Freund N.T., Escolano A., Lyubimov A.Y., Hartweger H., West A.P., Cohen A.E., Nussenzweig M.C., and Bjorkman P.J.. 2018. Structural characterization of a highly-potent V3-glycan broadly neutralizing antibody bound to natively-glycosylated HIV-1 envelope. Nat. Comm. 9:1251. 10.1038/s41467-018-03632-y - DOI - PMC - PubMed
    1. Behrens, A.J., Vasiljevic S., Pritchard L.K., Harvey D.J., Andev R.S., Krumm S.A., Struwe W.B., Cupo A., Kumar A., Zitzmann N., et al. . 2016. Composition and antigenic effects of individual glycan sites of a trimeric HIV-1 envelope glycoprotein. Cell Rep. 14:2695–2706. 10.1016/j.celrep.2016.02.058 - DOI - PMC - PubMed
    1. Black, K.P., Cummins J.E. Jr., and Jackson S.. 1996. Serum and secretory IgA from HIV-infected individuals mediate antibody-dependent cellular cytotoxicity. Clin. Immunol. Immunopathol. 81:182–190. 10.1006/clin.1996.0175 - DOI - PubMed

Publication types