. 2022 Oct;18(10):2333-2349.
doi: 10.1080/15548627.2022.2029671. Epub 2022 Mar 1.

The FACT complex facilitates expression of lysosomal and antioxidant genes through binding to TFEB and TFE3

Affiliations

The FACT complex facilitates expression of lysosomal and antioxidant genes through binding to TFEB and TFE3

Eutteum Jeong et al. Autophagy. 2022 Oct.

Abstract

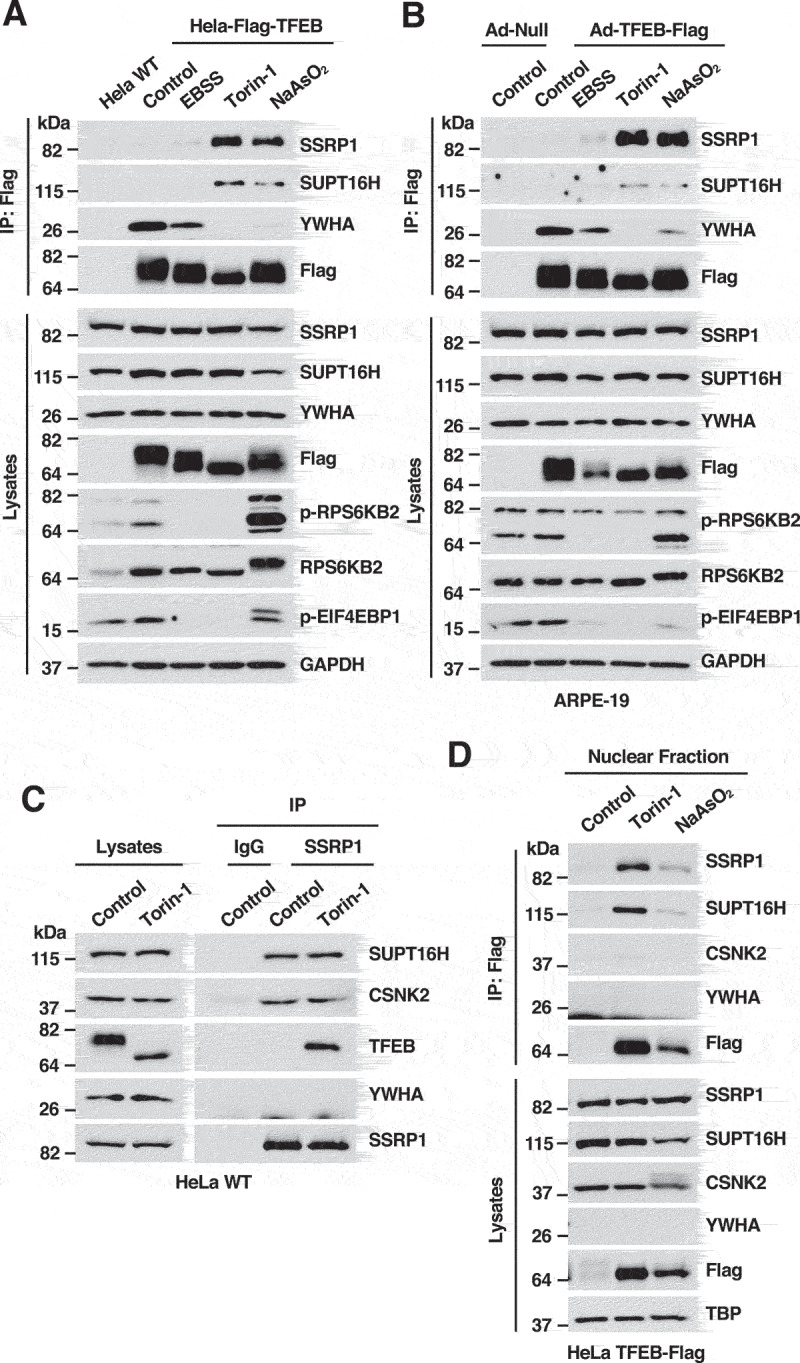
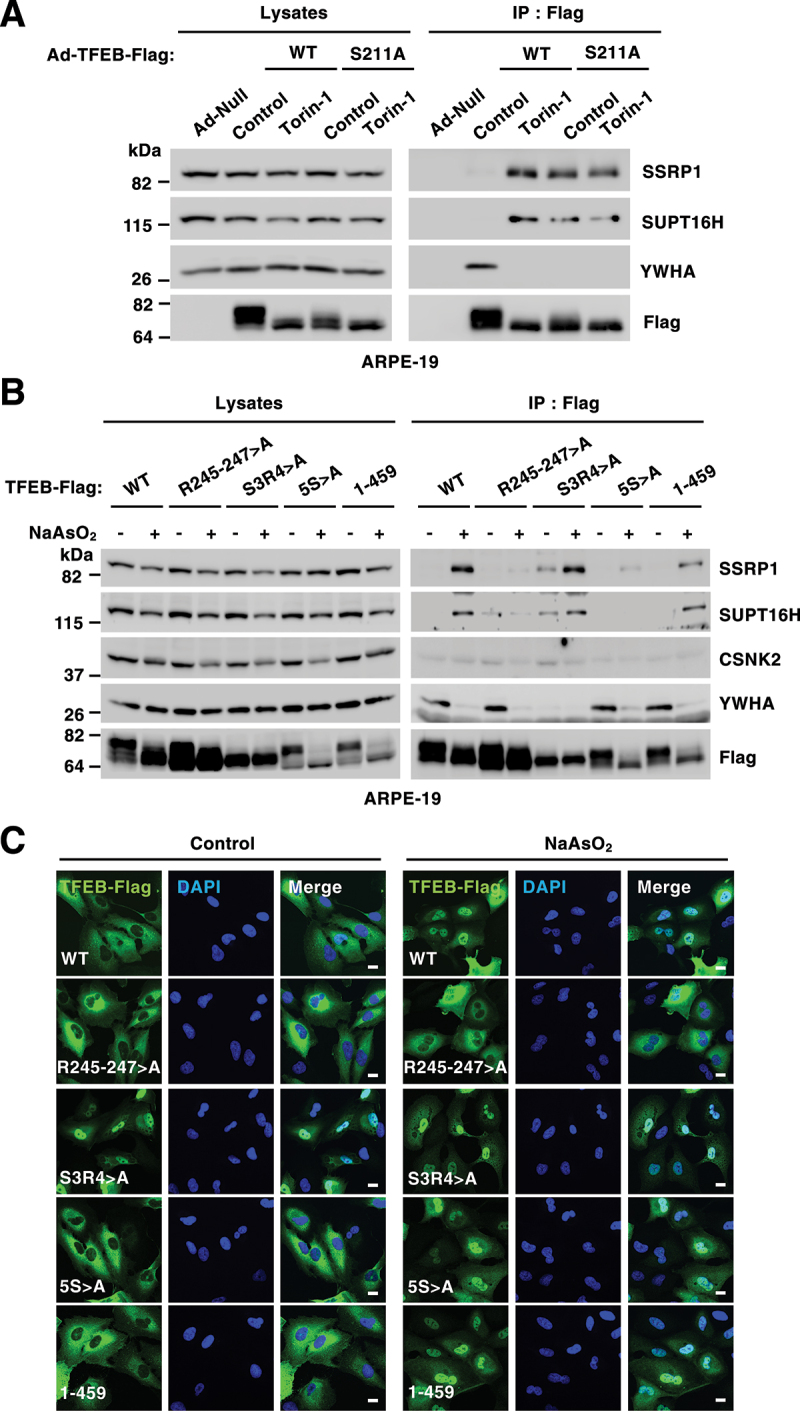
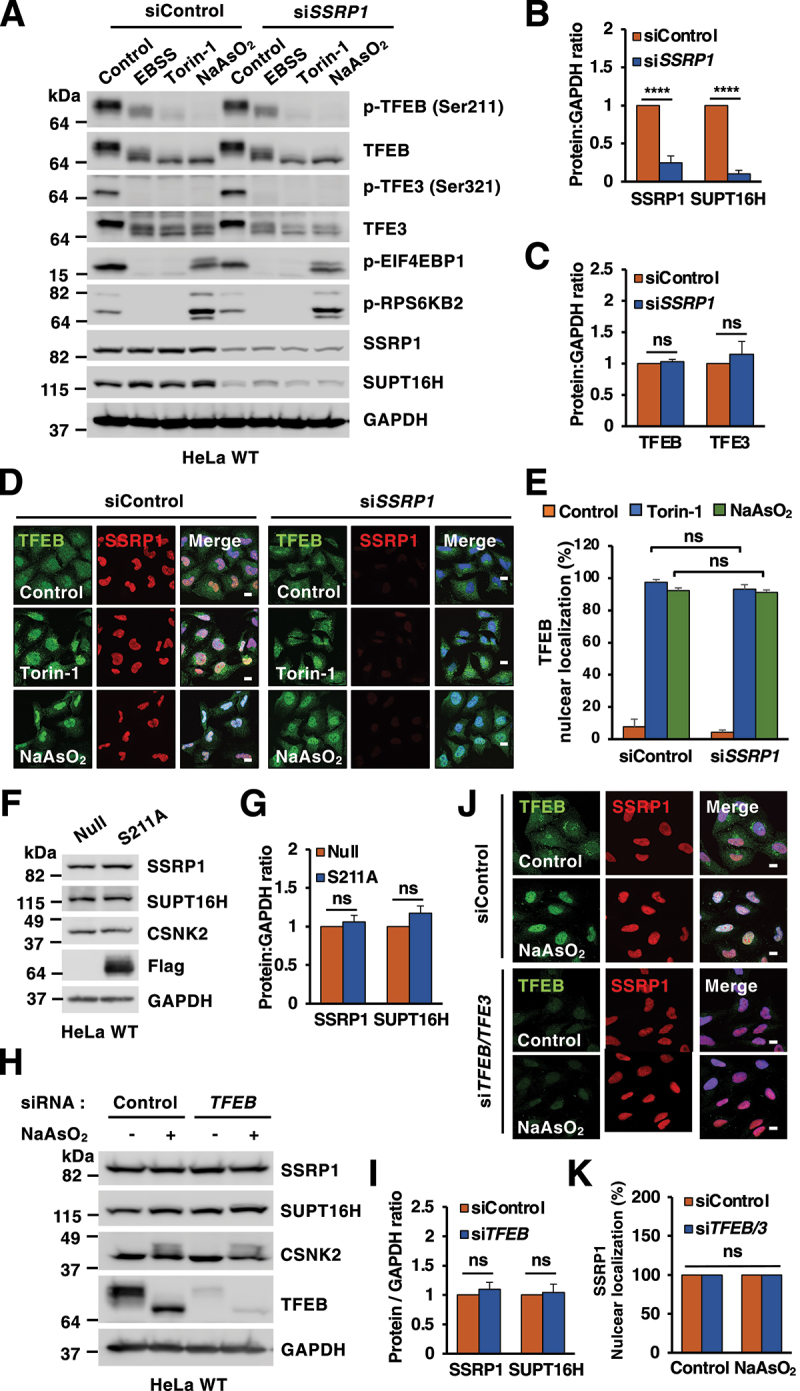
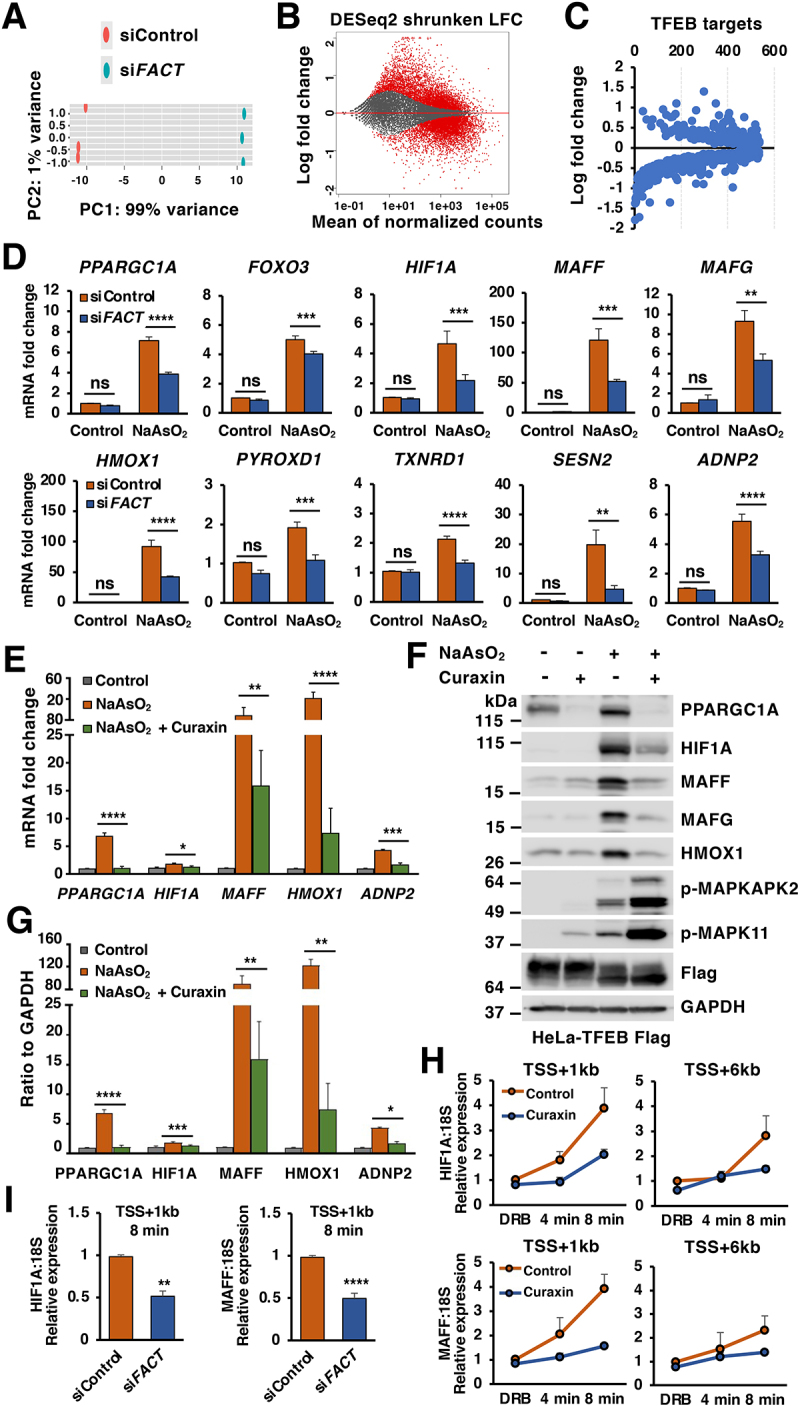
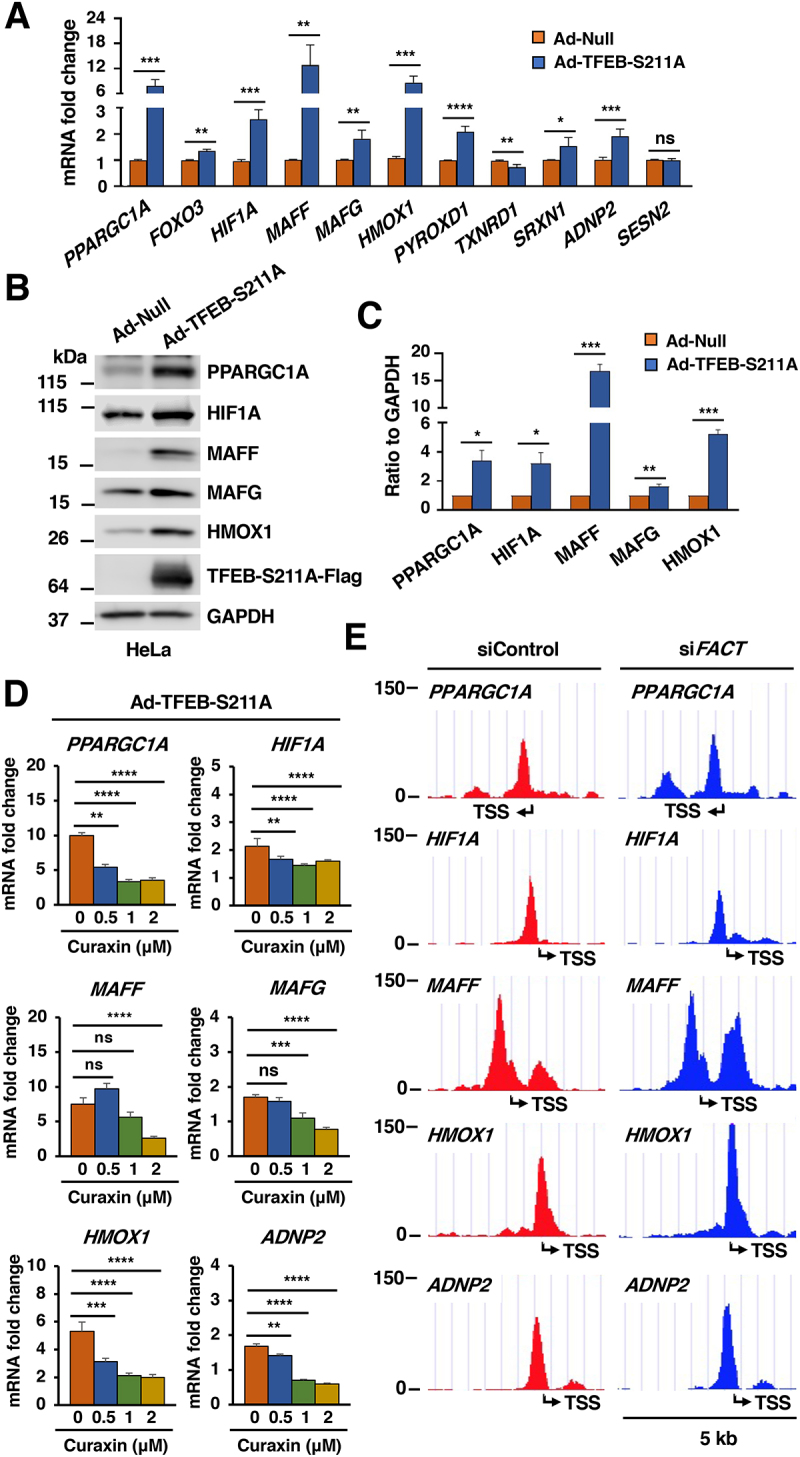
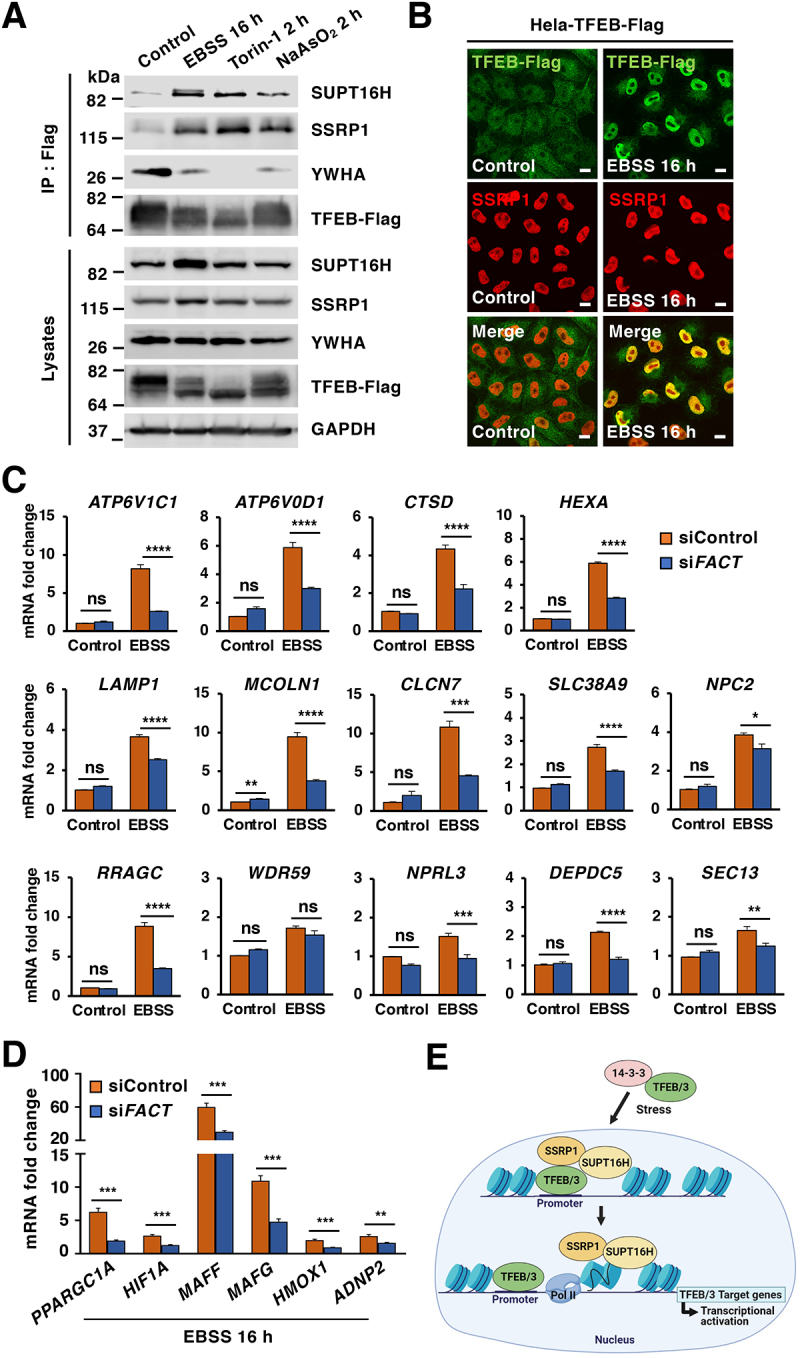
TFEB (transcription factor EB) and TFE3 (transcription factor binding to IGHM enhancer 3) orchestrate the cellular response to a variety of stressors, including nutrient deprivation, oxidative stress and pathogens. Here we describe a novel interaction of TFEB and TFE3 with the FAcilitates Chromatin Transcription (FACT) complex, a heterodimeric histone chaperone consisting of SSRP1 and SUPT16H that mediates nucleosome disassembly and assembly, thus facilitating transcription. Extracellular stimuli, such as nutrient deprivation or oxidative stress, induce nuclear translocation and activation of TFEB and TFE3, which then associate with the FACT complex to regulate stress-induced gene transcription. Depletion of FACT does not affect TFEB activation, stability, or binding to the promoter of target genes. In contrast, reduction of FACT levels by siRNA or treatment with the FACT inhibitor curaxin, severely impairs induction of numerous antioxidant and lysosomal genes, revealing a crucial role of FACT as a regulator of cellular homeostasis. Furthermore, upregulation of antioxidant genes induced by TFEB over-expression is significantly reduced by curaxin, consistent with a role of FACT as a TFEB transcriptional activator. Together, our data show that chromatin remodeling at the promoter of stress-responsive genes by FACT is important for efficient expression of TFEB and TFE3 targets, thus providing a link between environmental changes, chromatin modifications and transcriptional regulation.Abbreviations: ADNP2, ADNP homeobox 2; ATP6V0D1, ATPase H+ transporting V0 subunit d1; ATP6V1A, ATPase H+ transporting V1 subunit A; ATP6V1C1, ATPase H+ transporting V1 subunit C1; CSNK2/CK2, casein kinase 2; CLCN7, chloride voltage-gated channel 7; CTSD, cathepsin D; CTSZ, cathepsin Z; EBSS, earle's balanced salt solution; FACT complex, facilitates chromatin transcription complex; FOXO3, forkhead box O3; HEXA, hexosaminidase subunit alpha; HIF1A, hypoxia inducible factor 1 subunit alpha; HMOX1, heme oxygenase 1; LAMP1, lysosomal associated membrane protein 1; MAFF, MAF bZIP transcription factor F; MAFG, MAF bZIP transcription factor G; MCOLN1, mucolipin TRP cation channel 1; MTORC1, mechanistic target of rapamycin kinase complex 1; NaAsO2, sodium arsenite; POLR2, RNA polymerase II; PPARGC1A, PPARG coactivator 1 alpha; PYROXD1, pyridine nucleotide-disulfide oxidoreductase domain 1; RRAGC, Ras related GTP binding C; SEC13, SEC13 homolog, nuclear pore and COPII coat complex component; SLC38A9, solute carrier family 38 member 9; SSRP1, structure specific recognition protein 1; SUPT16H, SPT16 homolog, facilitates chromatin remodeling subunit; TFEB, transcription factor EB; TFE3, transcription factor binding to IGHM enhancer 3; TXNRD1, thioredoxin reductase 1; UVRAG, UV radiation resistance associated; WDR59, WD repeat domain 59.

Keywords: Autophagy; FACT; TFE3; TFEB; chaperone; histone; lysosomes.


Conflict of interest statement

No potential conflict of interest was reported by the author(s).

Figures

Figure 1.
Figure 1.
TFEB interacts with the FACT complex under stress conditions. (A) Immunoblot analysis of immunoprecipitated TFEB-Flag from HeLa cells incubated with DMSO (Control), EBSS for 4 h, Torin-1 (250 nM) for 2 h or NaAsO2 (250 μM) for 2 h. (B) Immunoblot analysis of immunoprecipitated TFEB-Flag from ARPE-19 cells infected with either Ad-Null or Ad-TFEB-S211A and incubated with DMSO (Control), EBSS for 4 h, Torin-1 (250 nM) for 2 h or NaAsO2 (250 μM) for 2 h. (C) Immunoblot analysis of immunoprecipitated endogenous SSRP1 from HeLa WT cells treated with DMSO (Control) or Torin-1 (250 nM) for 2 h. (D) Immunoblot analysis of proteins from the nuclear fraction of HeLa-TFEB-Flag cells treated with DMSO (Control), Torin-1 (250 nM) for 2 h or NaAsO2 (250 μM) for 2 h. Immunoblots are representative of at least three independent experiments.
Figure 2.
Figure 2.
The interaction between TFEB and the FACT complex occurs in the nucleus. (A) Immunoblot analysis of TFEB-Flag immunoprecipitation from ARPE-19cells infected with Ad-Null, Ad-TFEB-WT-Flag or Ad-TFEB-S211A-Flag and treated with DMSO (Control) or Torin-1 (250 nM) for 2 h. (B) Immunoblot analysis of TFEB-Flag immunoprecipitation from ARPE-19 cells expressing TFEB-WT or the indicated TFEB mutants upon treatment with NaAsO2 (250 μM) for 2 h. (C) Immunofluorescence confocal microscopy analysis of ARPE-19 cells showing the intracellular distribution of recombinant TFEB-WT or the indicated TFEB mutants in response to treatment with NaAsO2 (250 μM) for 2 h. Scale bars: 10 μm.
Figure 3.
Figure 3.
Depletion of the FACT complex does not alter TFEB or TFE3 activation. (A) Immunoblots of protein lysates from HeLa WT cells transfected with the indicated siRNAs upon incubation with DMSO (Control), EBSS for 4 h, Torin-1 (250 nM) for 2 h or NaAsO2 (50 μM) for 6 h. (B and C) Quantification of immunoblots shown in (A). Significance tested with two-way ANOVA with Sidak’s multiple comparisons test (****p < 0.0001) from three independent experiments. (D) Immunofluorescence confocal microscopy analysis of siRNA-transfected HeLa WT cells treated with DMSO (Control), Torin-1 (250 nM) for 2 h or NaAsO2 (50 μM) for 6 h and stained with antibodies against TFEB and SSRP1. Scale bars: 10 μm. (E) Quantification of immunofluorescence images shown in (D). Significance tested with two-way ANOVA with Sidak’s multiple comparisons test from three independent experiments and >100 cells counted per trial. (F) Immunoblot analysis of protein lysates from HeLa WT cells infected with either Ad-Null or Ad-TFEB-S211A-Flag for 40 h. (G) Quantification of immunoblots shown in (F). Significance tested with two-way ANOVA with Sidak’s multiple comparisons testfrom three independent experiments. (H) Immunoblots of protein lysates from HeLa WT cells depleted of TFEB and treated with NaAsO2 (50 μM) for 6 h. (I) Quantification of immunoblots shown in (H). Significance tested with two-way ANOVA with Sidak’s multiple comparisons test from three independent experiments. (J) Immunofluorescence confocal microscopy analysis of HeLa WT cells depleted of TFEB and TFE3 stained with antibodies against endogenous TFEB and SSRP1. Scale bars: 10 μm. (K) Quantification of immunofluorescence images shown in (J). Significance tested with two-way ANOVA with Sidak’s multiple comparisons test from three independent experiments and >100 cells counted per trial.
Figure 4.
Figure 4.
The FACT complex modulates cellular response to oxidative stress. (A) Principal component analysis of genes with q-value < 0.05 reveals distinct clustering of siControl- and siFACT-treated cells upon incubation with NaAsO2 (50 μM) for 6 h. (B) Volcano plot indicating distribution of genes significantly up- and downregulated in control versus FACT complex depleted cells incubated with NaAsO2 (50 μM) for 6 h. Cutoffs indicate genes with q-value < 0.05. (C) Volcano plot indicating distribution of previously identified TFEB target genes in control versus FACT complex depleted HeLa-TFEB-Flag cells as described in (B). (D) Relative quantitative real-time PCR analysis of PPARGC1A, FOXO3, HIF1A, MAFF, MAFG, HMOX1, PYROXD1, TXNRD1, SESN2 and ADNP2 mRNA transcript levels in HeLa-TFEB-Flag cells treated with either control or FACT siRNAs upon incubation with NaAsO2 (50 μM) for 6 h. Significance tested with two-way ANOVA with Sidak’s multiple comparisons test (*p < 0.05, **p < 0.01, ***p < 0.001, ****p < 0.0001) from three independent experiments. (E) Relative quantitative real-time PCR analysis of PPARGC1A, HIF1A, MAFF, HMOX1 and ADNP2 mRNA transcript levels in HeLa-TFEB-Flag cells treated with DMSO (Control), NaAsO2 (50 μM) or NaAsO2 (50 μM) plus curaxin (1 μM) for 6 h. Data represented as geometric mean ± SD and significance tested with Student’s t-test (*p < 0.05, **p < 0.01, ***p < 0.001, ****p < 0.0001) from three independent experiments (F) Immunoblots analysis of protein lysates from HeLa-TFEB-Flag cells treated with NaAsO2 (50 μM), Curaxin (1 μM) alone or NaAsO2 (50 μM) plus curaxin (1 μM) for 6 h. (G) Quantification of immunoblots shown in (F). Data represents mean relative protein levels ± SD with n = 5. Significance tested using Student’s test (*p < 0.05, **p < 0.01, ***p < 0.001, ****p < 0.0001). (H and I) Transcription elongation rate was analyzed by relative quantitative real-time PCR for HIF1A and MAFF pre-mRNA transcript levels in HeLa-TFEB-Flag cells treated with NaAsO2 (50 μM) plus curaxin (1 μM) for 6 h (H) or siRNA transfected HeLa-TFEB-Flag cells upon NaAsO2 (50 μM) incubation for 6 h (I). Data represents mean relative protein levels ± SD with n = 4. Significance tested using Student’s test (**p < 0.01, ****p < 0.0001).
Figure 5.
Figure 5.
The FACT complex promotes TFEB-dependent expression of oxidative stress genes. (A) Relative quantitative real-time PCR analysis of PPARGC1A, FOXO3, HIF1A, MAFF, MAFG, HMOX1, PYROXD1, TXNRD1, SRXN1, ADNP2 and SESN2 mRNA transcript levels in HeLa WT cells infected with adenovirus expressing TFEB-S211A-Flag compared to Null for 40 h. Data represented as geometric mean ± SD and significance tested with Student’s t-test (*p < 0.05, **p < 0.01, ***p < 0.001, ****p < 0.0001) from at least three independent experiments. (B) Immunoblot analysis of protein lysates from HeLa WT cells infected with either Null adenovirus or adenovirus expressing TFEB-S211A-Flag for 40 h. (C) Quantification of immunoblots shown in (B). Data represents mean relative protein levels ± SD with n = 3. Significance tested using Student’s test (*p < 0.05, **p < 0.01, ***p < 0.001). (D) Relative quantitative real-time PCR analysis of PPARGC1A, HIF1A, MAFF, MAFG, HMOX1 and ADNP2 mRNA transcript levels in HeLa WT cells infected with adenovirus expressing TFEB-S211A-Flag upon incubation with curaxin for 4 h at different doses. Significance tested with two-way ANOVA with Sidak’s multiple comparisons test (**p < 0.01, ***p < 0.001, ****p < 0.0001) from three independent experiments. (E) Schematic representations of the TFEB-Flag binding region in the promoter of PPARGC1A, HIF1A, MAFF, HMOX1 and ADNP2 in HeLa-TFEB-Flag cells transfected with either control or FACT siRNAs treated with NaAsO2 (50 μM) for 6 h. The transcription start site is indicated as TSS.
Figure 6.
Figure 6.
The FACT complex modulates TFEB transcriptional activity under starvation conditions. (A) Immunoblot analysis of immunoprecipitated TFEB from HeLa-TFEB-Flag cells incubated with DMSO (Control), EBSS for 16 h, Torin-1 (250 nM) for 2 h or NaAsO2 (250 μM) for 2 h. (B) Immunofluorescence images of HeLa-TFEB-Flag cells treated with EBSS for 16 h and stained with antibodies against TFEB and SSRP1. Scale bars: 10 μm. (C) Relative quantitative real-time PCR analysis of ATP6V1C1, ATP6V0D1, CTSD, HEXA, LAMP1, MCOLN1, CLCN7, SLC38A9, NPC2, RRAGC, WDR59, NPRL3, DEPDC5, and SEC13 in control and FACT-depleted HeLa-TFEB-Flag cells upon incubation with EBSS for 16 h. Significance tested with two-way ANOVA with Sidak’s multiple comparisons test (*p < 0.05, **p < 0.01, ***p < 0.001, ****p < 0.0001) from three independent experiments. (D) Relative quantitative real-time PCR analysis of PPARGC1A, HIF1A, MAFF, HMOX1, and ADNP2 mRNA transcript levels in control and FACT-depleted cells incubated with EBSS for 16 h compared to control condition. Data represented as geometric mean ± SD and significance tested with Student’s t-test (*p < 0.05, **p < 0.01, ***p < 0.001) from three independent experiments (E) Model depicting the proposed pathway of TFEB/TFE3-FACT complex activated by stress.

References

    1. Raben N, Puertollano R.. TFEB and TFE3: linking Lysosomes to Cellular Adaptation to Stress. Annu Rev Cell Dev Biol. 2016. Oct 6;32(1):255–278. - PMC - PubMed
    1. Sha Y, Rao L, Settembre C, et al. STUB1 regulates TFEB-induced autophagy-lysosome pathway. EMBO J. 2017. Sep 1;36(17):2544–2552. - PMC - PubMed
    1. Martina JA, Guerrero-Gomez D, Gomez-Orte E, et al. A conserved cysteine-based redox mechanism sustains TFEB/HLH-30 activity under persistent stress. EMBO J. 2021. Feb 1;40(3):e105793. - PMC - PubMed
    1. Napolitano G, Esposito A, Choi H, et al. mTOR-dependent phosphorylation controls TFEB nuclear export. Nat Commun. 2018. Aug 17;9(1):3312. - PMC - PubMed
    1. Martina JA, Puertollano R. Rag GTPases mediate amino acid-dependent recruitment of TFEB and MITF to lysosomes. J Cell Biol. 2013. Feb 18;200(4):475–491. - PMC - PubMed

Publication types

MeSH terms

Substances