. 2022 Mar 22;7(6):e146374.
doi: 10.1172/jci.insight.146374.

Snapshots of nascent RNA reveal cell- and stimulus-specific responses to acute kidney injury

Affiliations

Snapshots of nascent RNA reveal cell- and stimulus-specific responses to acute kidney injury

Tian Huai Shen et al. JCI Insight. .

Abstract

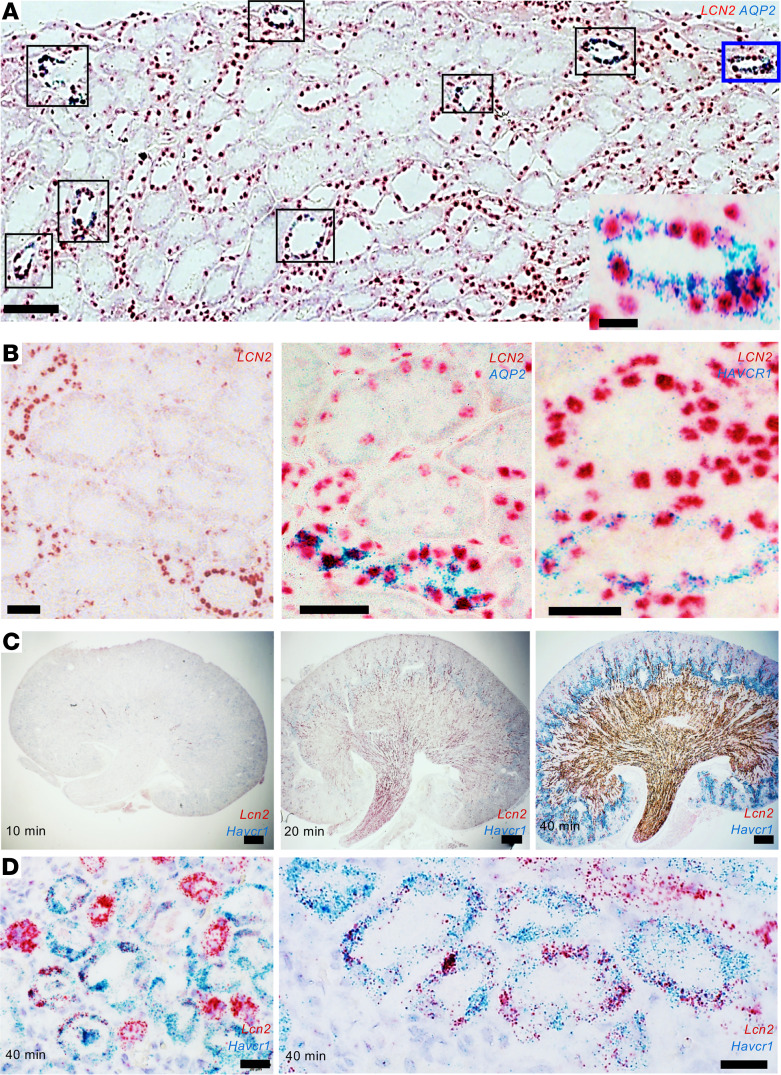
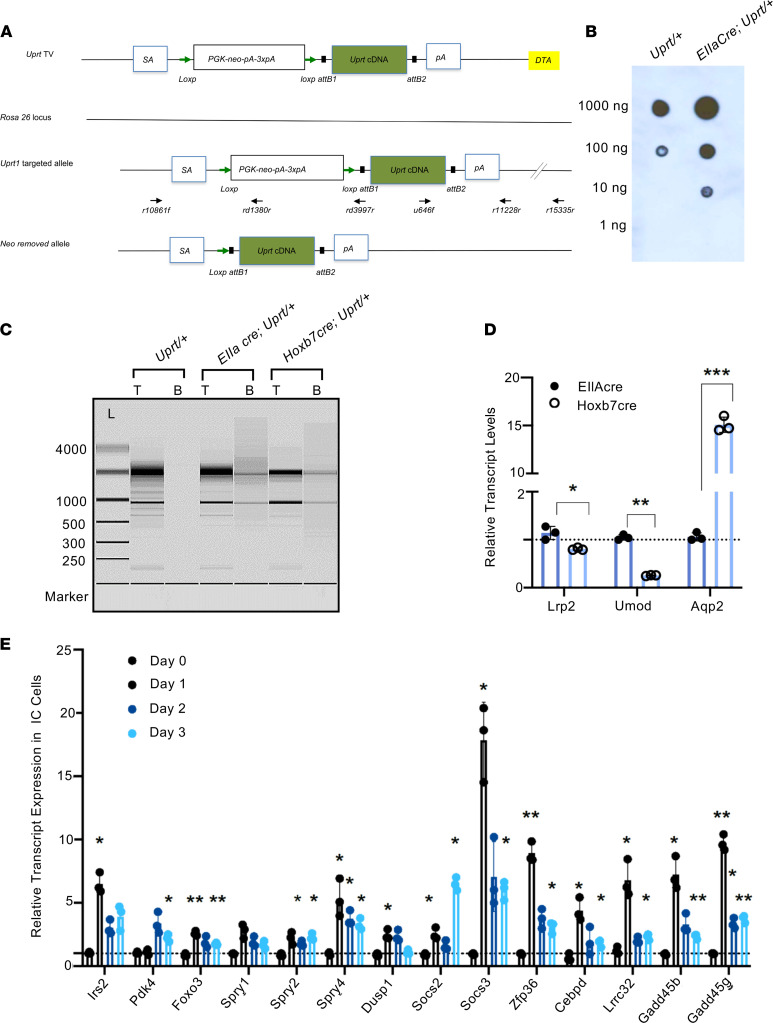
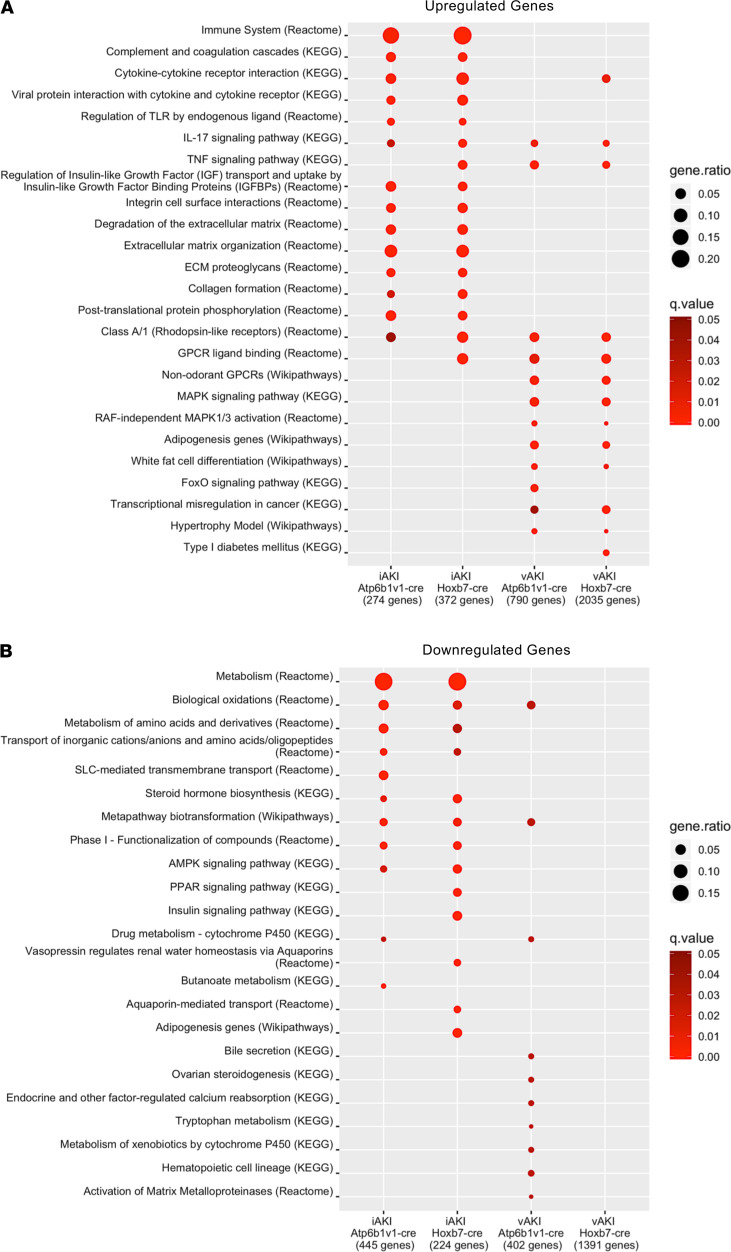
The current strategy to detect acute injury of kidney tubular cells relies on changes in serum levels of creatinine. Yet serum creatinine (sCr) is a marker of both functional and pathological processes and does not adequately assay tubular injury. In addition, sCr may require days to reach diagnostic thresholds, yet tubular cells respond with programs of damage and repair within minutes or hours. To detect acute responses to clinically relevant stimuli, we created mice expressing Rosa26-floxed-stop uracil phosphoribosyltransferase (Uprt) and inoculated 4-thiouracil (4-TU) to tag nascent RNA at selected time points. Cre-driven 4-TU-tagged RNA was isolated from intact kidneys and demonstrated that volume depletion and ischemia induced different genetic programs in collecting ducts and intercalated cells. Even lineage-related cell types expressed different genes in response to the 2 stressors. TU tagging also demonstrated the transient nature of the responses. Because we placed Uprt in the ubiquitously active Rosa26 locus, nascent RNAs from many cell types can be tagged in vivo and their roles interrogated under various conditions. In short, 4-TU labeling identifies stimulus-specific, cell-specific, and time-dependent acute responses that are otherwise difficult to detect with other technologies and are entirely obscured when sCr is the sole metric of kidney damage.

Keywords: Chronic kidney disease; Nephrology.


Figures

Figure 1
Figure 1. Patterning of gene expression.
(A) Human kidney biopsy. Mild ATI due to NSAIA. LCN2 (NGAL) is strongly expressed in AQP2+ collecting ducts (e.g., boxed tubules) containing both intercalated cells (AQP2) and principal cells (AQP2+) expressing LCN2 (NGAL). One tubule is outlined and shown in the inset. (B) Human kidney biopsies. Left: Ischemic ATI with hepatorenal syndrome. Middle: Nephrectomy — 18 minutes of warm ischemia followed by cold ischemia. Right: Delayed graft function and tacrolimus toxicity. Note AQP2 (middle) and HAVCR1 (KIM-1; right) mark collecting ducts and proximal tubules, respectively. Distal nephron segments consistently express LCN2 (NGAL), but proximal tubule expression is variable. A total of 2 nephrectomies and 5 biopsies were analyzed. (C) Cross-clamping the mouse renal pedicle for 10–40 minutes resulted in the progressive broadening of Lcn2 (Ngal) message throughout the medullary and cortical-medullary zones and Havcr1 (Kim-1) message in the cortex and outer stripe of the outer medulla. (D) Severe ischemia (40 minutes) induced overlapping Lcn2 (Ngal) and Havcr1 (Kim-1) expression in the proximal tubule. ISH detected by RNAscope; red = LCN2; blue = AQP2 or HAVCR1 (KIM-1). Bars A = 100 μm; bars A (inset) = 10 μm; bars B = 50 μm; bars C = 500 μm; bars D = 20 μm.
Figure 2
Figure 2. Cell- and time-specific labeling of nascent RNA by UPRT.
(A) Uprt mice. A knockin vector was created with Uprt cDNA flanked by a floxed-stop cassette. Rosa26Uprt is expressed after Cre-mediated deletion of PGK-neo-pA-3xpA. DTA, diphtheria toxin A; SA, splicing acceptor; pA, poly(A) tail; TV, targeting vector. (B) Dot blot analysis of biotinylated RNA. Total RNA was extracted from kidneys of 3-month RosaUprt/+ and RosaUprt/+ EIIaCre littermates, thio-biotinylated in vitro, and spotted on zeta membranes. The thio-biotinylated RNAs were detected with streptavidin-HRP and visualized with ECL. RNA isolated from Uprt-expressing kidneys (EIIaCre RosaUprt/+) was efficiently biotinylated. (C) Capture of nascent RNA from Uprt+ mice by magnetic beads. A total of 1 ng of total kidney RNA (T) and 0.14 ng of biotinylated RNA were loaded on RNA pico-chips and analyzed by Agilent 2100 Bioanalyzer. RNA size ladder (L) in nt at left. Note that ribosomal RNA was de-enriched in the biotinylated RNA pool. (D) Snapshots of nascent RNA. Aqp2, a collecting duct marker, was enriched in the Hoxb7Cre RosaUprt/+ RNA pool compared with the EIIaCre RosaUprt/+ pool, whereas markers of TALH and proximal tubule, Umod and Lrp2, respectively, were de-enriched. Actb was an internal control. Transcript levels in EIIaCre were set to 1. *P < 0.05; **P < 0.01; ***P < 0.001. Data represent mean ± SD. Student’s 2-tailed t test (n = 3 technical replicates). (E) Time-dependent gene expression. Atp6v1b1Cre RosaUprt/+ mice (3 months old) were treated with water and food withdrawal for 0, 1, 2, and 3 days. 4-TU was administered and labeled RNA was isolated for reverse transcriptase quantitative PCR (RT-qPCR) after 4 hours. mRNA expression level of day 0 control was set as 1; Actb was a reference. Bonferroni-adjusted significance: *P < 0.05, **P < 0.01, ***P < 0.001 compared with day 0 control (2-tailed Student’s t test). n = 3 technical replicates. Data represent mean ± SD.
Figure 3
Figure 3. Enrichment of kidney segment markers in nascent RNA.
Normalized counts (DESeq2) were plotted for 3 RNA pools (total kidney RNA; Hoxb7Cre RosaUprt/+ and Atp6v1b1Cre RosaUprt/+ pulldown RNA; respectively, n = 10, 21, 11 independent RNA samples). The y axis represents the ratio of counts per library size normalized for the average count of each gene across all samples. G, glomerulus; PT, proximal tubule; TALH, thick ascending limb of Henle; CD, collecting duct; PC, principal cells of the collecting duct; IC, intercalated cells of the collecting duct; α-IC, α-intercalated cells, β-IC, β-intercalated cells. Note the de-enrichment of most G, PT, and TALH markers and conversely the enrichment of PC markers by HoxB7Cre (Aqp 2, 3, 4), IC markers by Atp6v1b1Cre (Foxi1, Atp6v0d2, Atp6v1g3, Oxgr1), and collecting duct markers in both pulldowns (Rhcg, Slc4a8, Slc26a4). Some genes failed to comply with their known status as a canonical marker, suggesting low rates of RNA turnover or incomplete characterization of their distribution, including Slc9a3 (95). Alternatively, some genes are expressed in multiple segments of the kidney — Rhbg (96): connecting segment and CD; Car12 (carbonic anhydrase 12) (32): PT and CD; Car2 (carbonic anhydrase 2) (97): TALH and CD; Slc4a1 (98): RBC and CD — and consequently demonstrated mixed patterns in RNA pulldowns. HoxB7Cre pulldown vs. total RNA: adjusted P (padj) < 10–3 (range: 3.0 × 10⁻³ to 2.2 × 10–104) for all genes except Rhcg, Atp6v1g3, Slc4a1 (padj = NS). Atp6v1b1Cre pulldown vs. total RNA: padj < 10–3 (range: 7.7 × 10⁻³ to 2.07 × 10–126) for all genes except for Rhcg, Slc4a1, Atp6v1b1, Slc9a2, Aqp3, Aqp4 (padj = NS).
Figure 4
Figure 4. Models of different forms of azotemia.
(A) Ischemic injury of the kidney elevated sCr at the 24-hour time point (P = NS; control n = 16, ischemia n = 13) but had no effect on BUN (P = NS) or hematocrit (HCT; P = NS). Volume depletion (volume depletion) elevated sCr 3-fold (P < 10–5; volume depletion n = 14), BUN 3-fold (P < 0.001; control n = 11, volume depletion n = 11), and HCT 1.5-fold (P < 0.01; control n = 6, volume depletion n = 11). Ischemia differed from volume depletion in all 3 parameters. Significance was determined by Student’s 2-tailed t test. P values were Bonferroni corrected. Data represent mean ± SD. Bars = 100 μm. PVC, packed volume of cells. (B) Renal artery ischemia generated focal coagulative necrosis of tubules (*) while volume depletion failed to demonstrate evidence of extensive kidney damage. H&E stain. Bars = 100 μm. (C) Renal artery ischemia generated TUNEL+ cell death (green) throughout the cortico-medullary junction and medulla, whereas volume depletion had little effect, except for a few scattered cells in the medulla. TUNEL was assayed by Click-iT Plus TUNEL kit (Invitrogen). Bars = 100 μm. (D) Urinary tubular injury markers Kim-1 and Ngal were induced by ischemic injury in a dose-dependent fashion but demonstrated limited responses to prolonged volume depletion (3 days) despite higher sCr levels. Urine Ngal and Kim-1 were quantified by ELISA (mouse Ngal: R&D Systems MLCN20; mouse Kim-1: R&D Systems MKM100) (n = 4) and compared with normal control. (A and D) *P < 0.05; **P < 0.01; ***P < 0.001; ****P < 0.00001 (2-tailed Student’s t test). P values were Bonferroni corrected. The box plots depict the minimum and maximum values (whiskers), the upper and lower quartiles, and the median. The length of the box represents the interquartile range.
Figure 5
Figure 5. Response to AKI differs according to stimulus and cell type.
(A) Comparison of differential gene expression. Hoxb7-Cre = collecting duct; Atp6v1b1-Cre = intercalated cells and their derivatives. Volcano plot shows log2 fold change for all DEGs with cutoff –1, +1 and padj < 0.05 in each RNA pool. (B) The Venn diagrams represent significantly upregulated and downregulated DEGs (log2 fold ≥ 1; padj < 0.05). The numbers in the Venn diagrams represent the number of DEGs shown in A. Note the differential responses to ischemia and to volume depletion (stimulus-specific responses) in the collecting duct. Also note that the 2 Cre drivers enrich for different sets of genes despite overlapping RNA pools (cell-specific responses). (C) Heatmap of all DEGs according to stimulus and cell type (padj < 0.05). (D) Pearson correlation matrix of all DEGs according to stimulus and cell type. Numbers represent correlation coefficients (P < 10–4). n = 7, volume depleted; n = 7, ischemia; control, n = 8.
Figure 6
Figure 6. Pathway overrepresentation analysis.
Enrichment of pathways in (A) significant upregulated DEGs (padj < 0.05; log2 fold change ≥ 1) and (B) significant downregulated DEGs (padj < 0.05; log2 fold change ≤ 1) from each RNA pool. Red color represents –log10 q value restricted to q < 0.05. Note the relatedness of pathways uniquely activated by ischemia or by volume depletion.

Similar articles

Cited by

References

    1. Bellomo R, et al. Acute renal failure — definition, outcome measures, animal models, fluid therapy and information technology needs: the Second International Consensus Conference of the Acute Dialysis Quality Initiative (ADQI) group. Crit Care. 2004;8(4):R204–R212. - PMC - PubMed
    1. Mehta RL, et al. Acute kidney injury network: report of an initiative to improve outcomes in acute kidney injury. Crit Care. 2007;11(2):R31. doi: 10.1186/cc5713. - DOI - PMC - PubMed
    1. Khwaja A. KDIGO clinical practice guidelines for acute kidney injury. Nephron Clin Pract. 2012;120(4):c179–c184. - PubMed
    1. Kellum JA, et al. Kidney Disease: Improving Global Outcomes (KDIGO) acute kidney injury work group. KDIGO clinical practice guideline for acute kidney injury. Kidney Int Suppl. 2012;2(1):1–138.
    1. Sise ME, et al. Urine neutrophil gelatinase-associated lipocalin identifies unilateral and bilateral urinary tract obstruction. Nephrol Dial Transplant. 2011;26(12):4132–4135. doi: 10.1093/ndt/gfr569. - DOI - PMC - PubMed

Publication types