. 2022 Apr 8;7(7):e150696.
doi: 10.1172/jci.insight.150696.

Intact mitochondrial substrate efflux is essential for prevention of tubular injury in a sex-dependent manner

Affiliations

Intact mitochondrial substrate efflux is essential for prevention of tubular injury in a sex-dependent manner

Allison McCrimmon et al. JCI Insight. .

Abstract

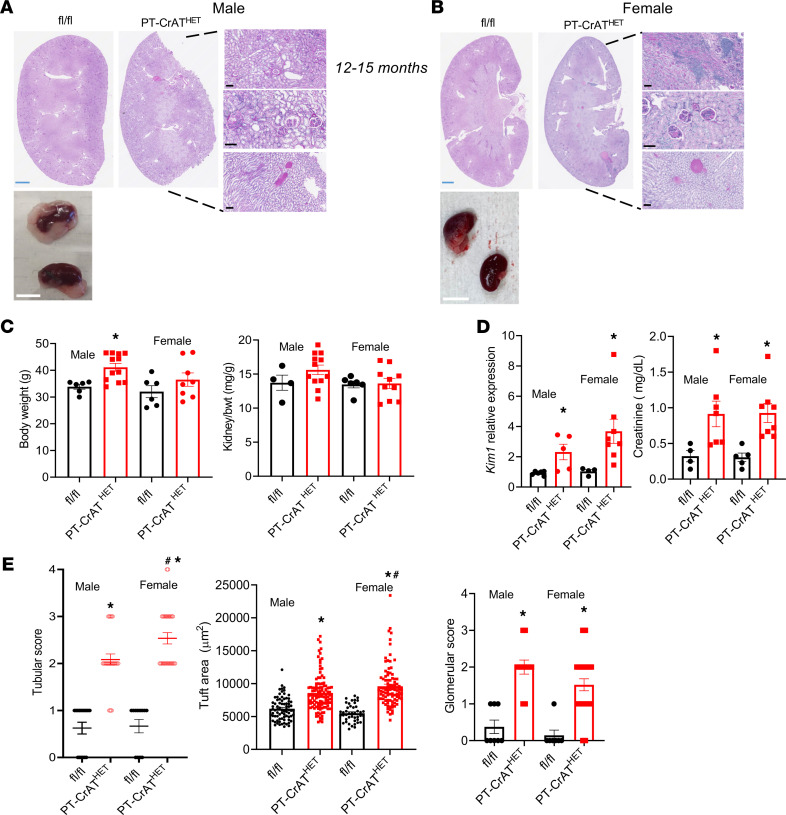
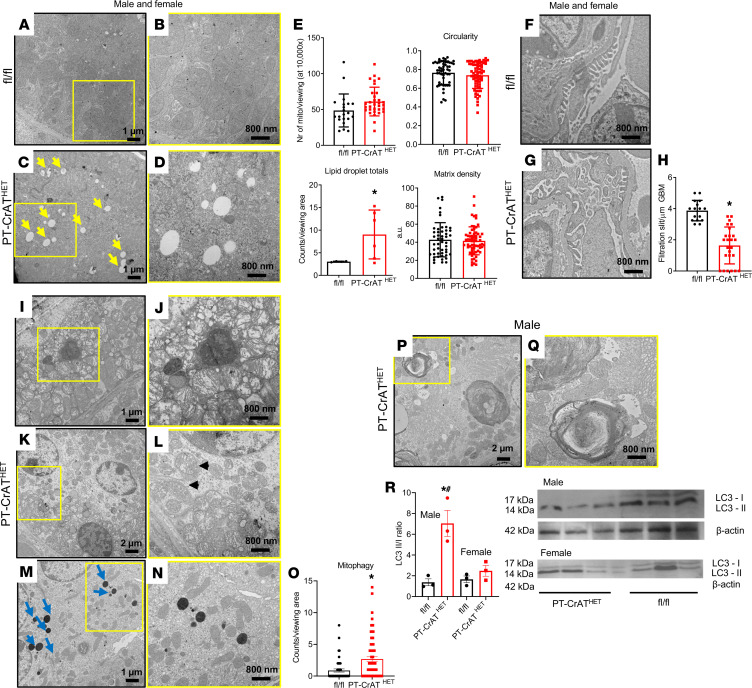
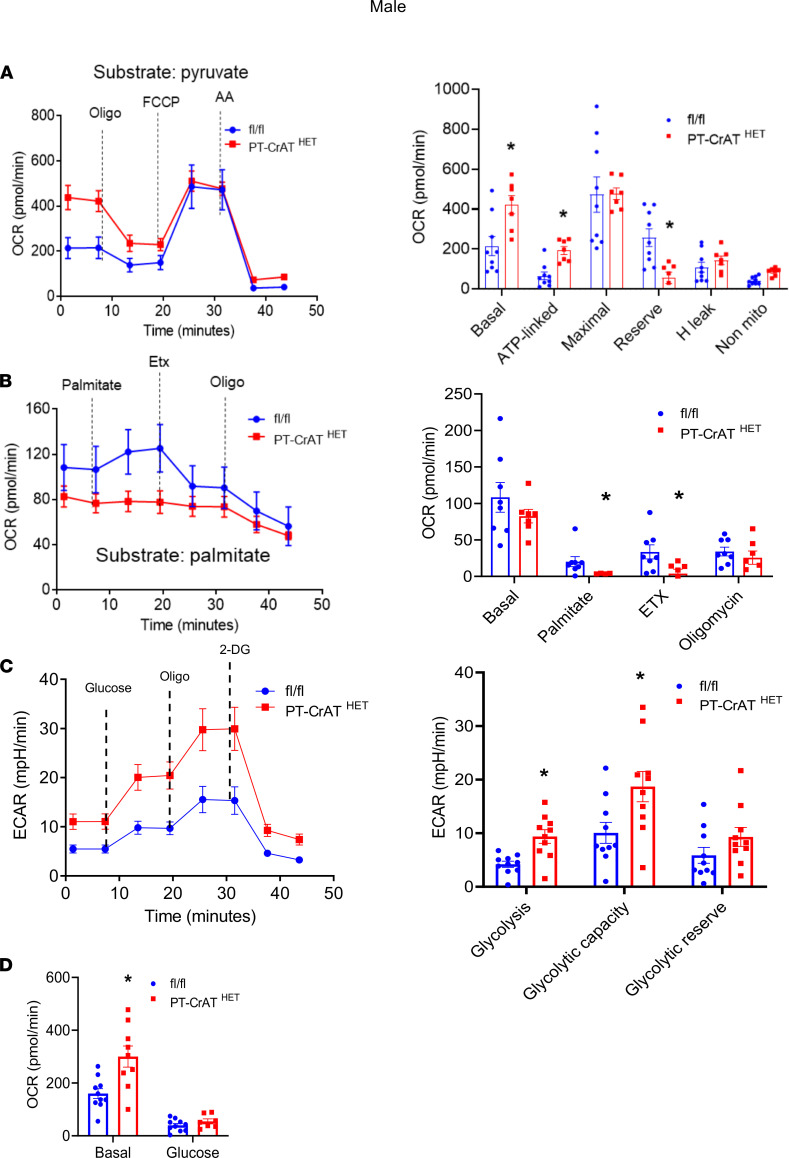
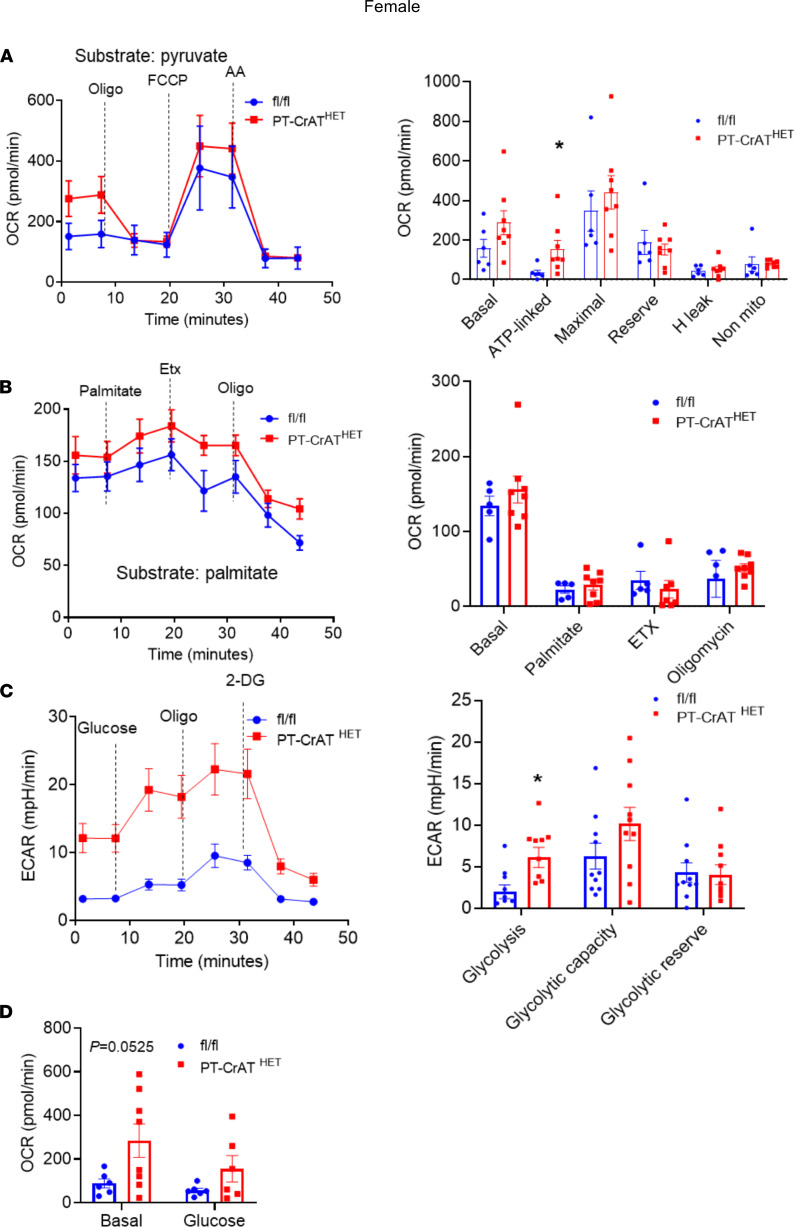
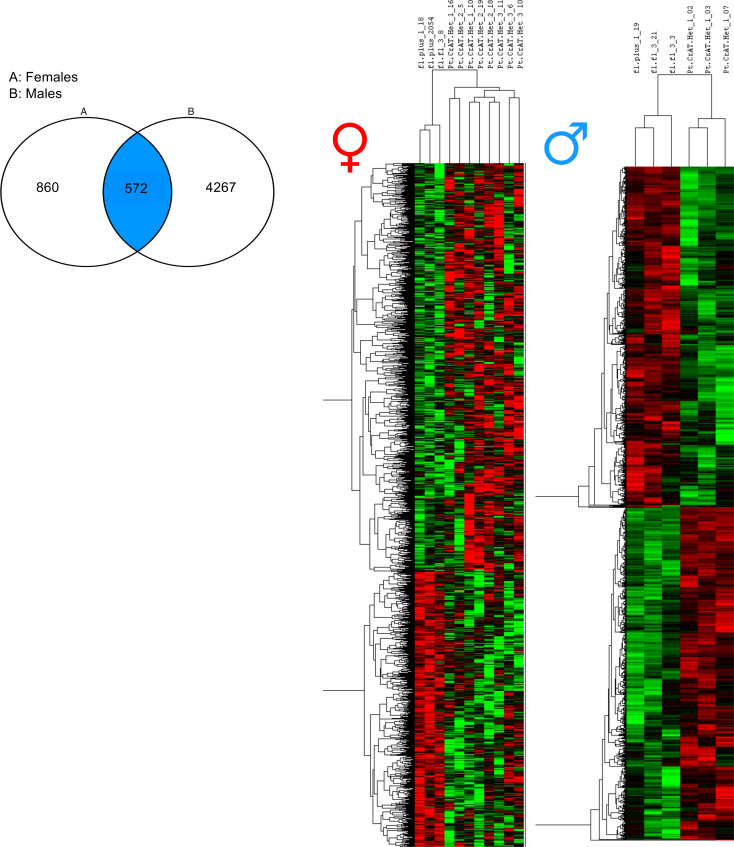
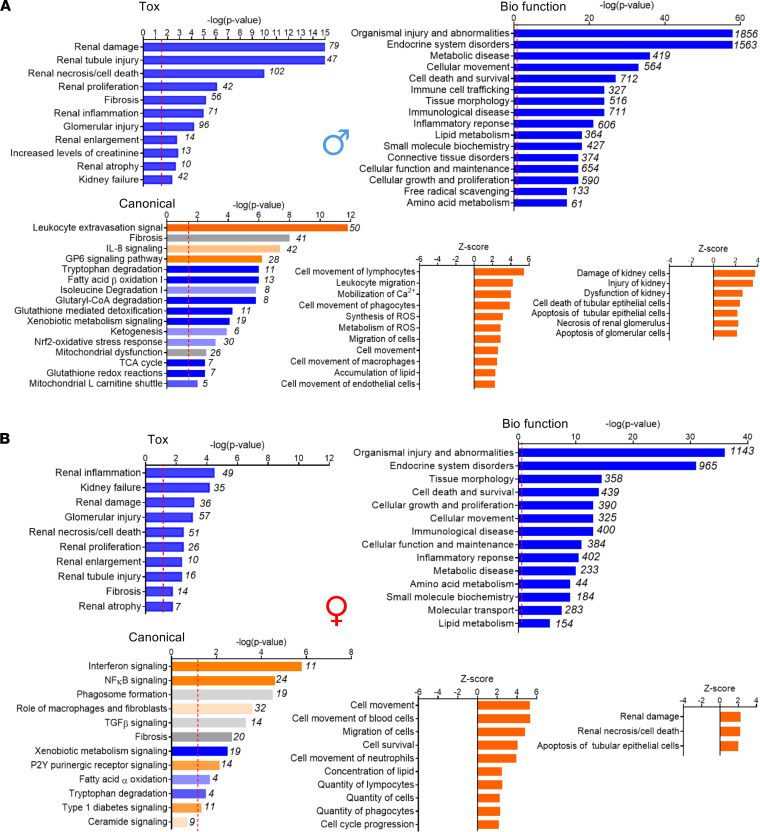
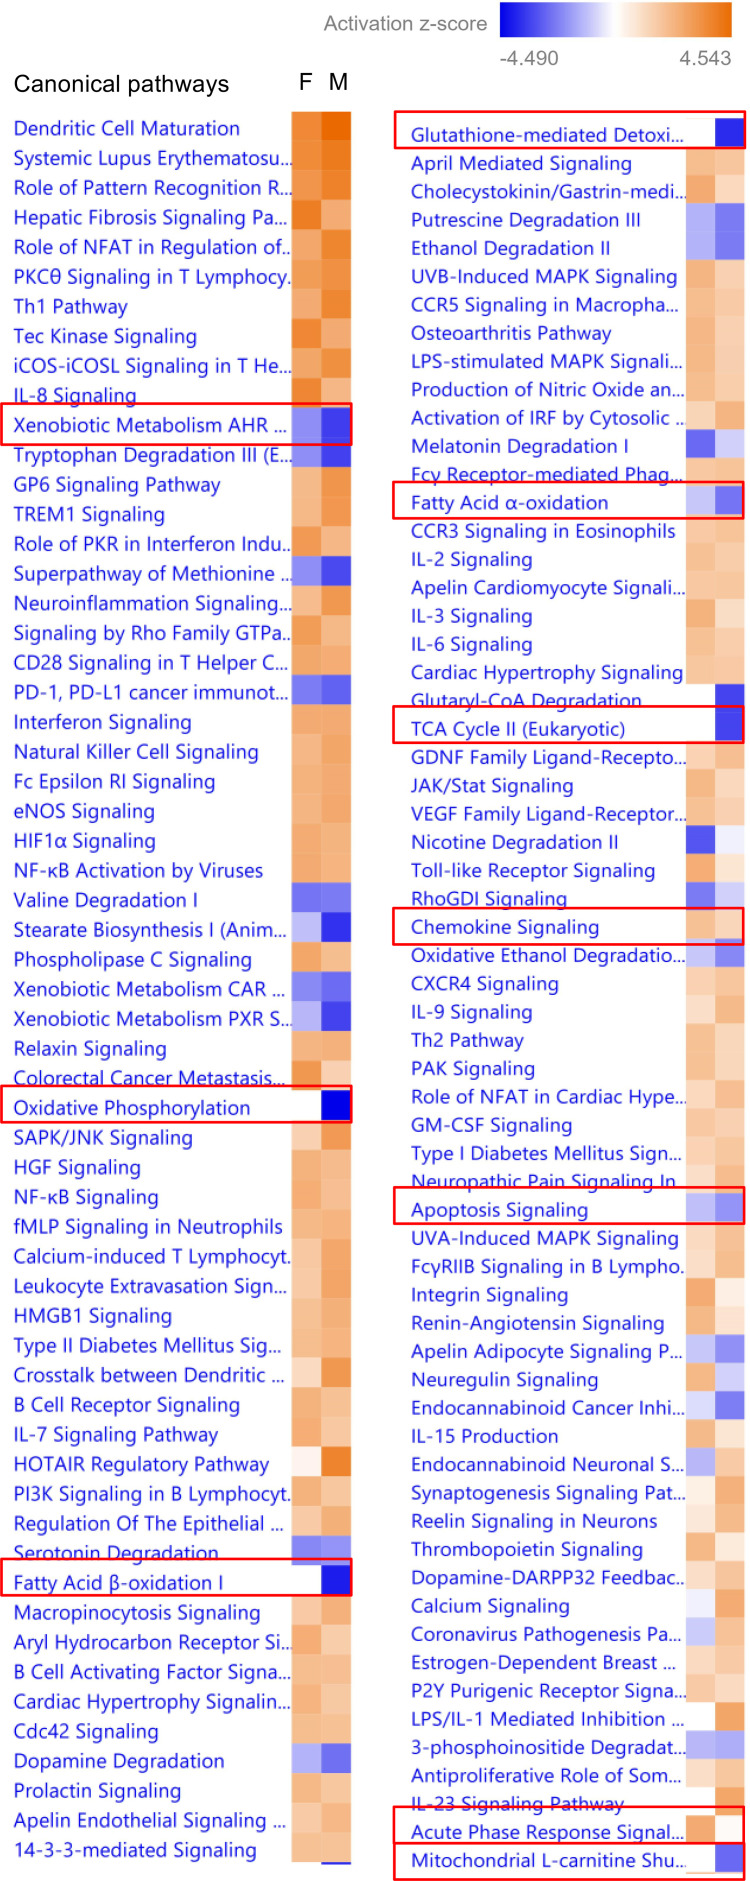
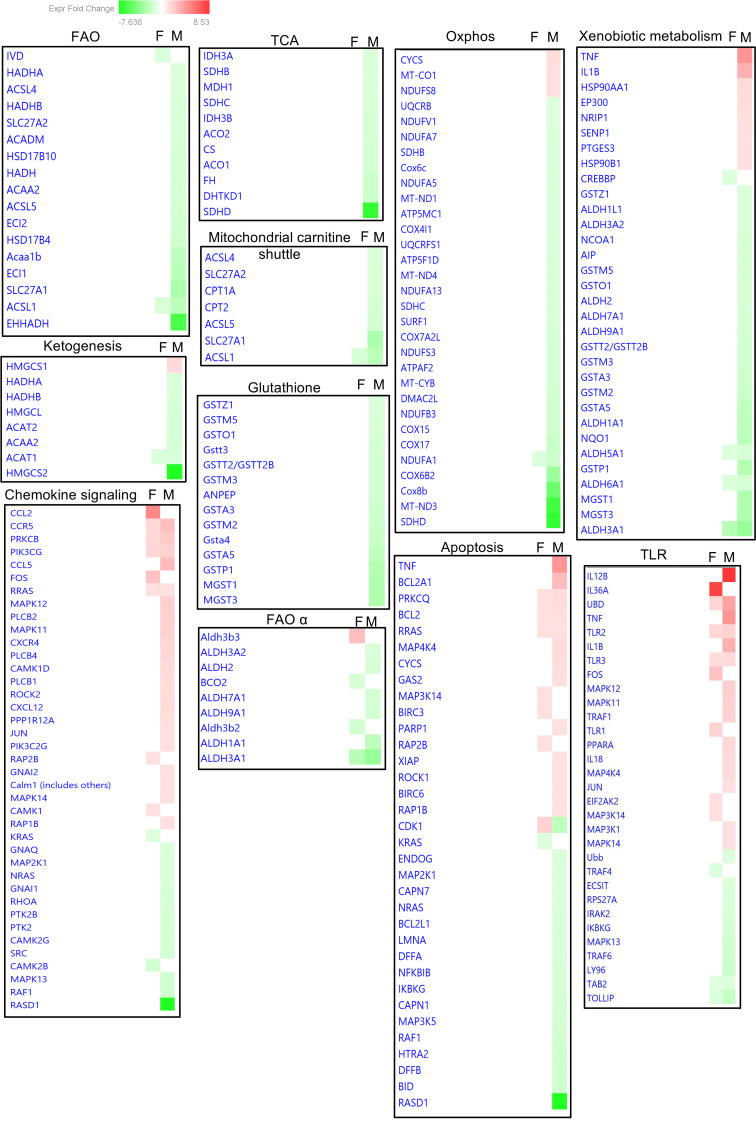
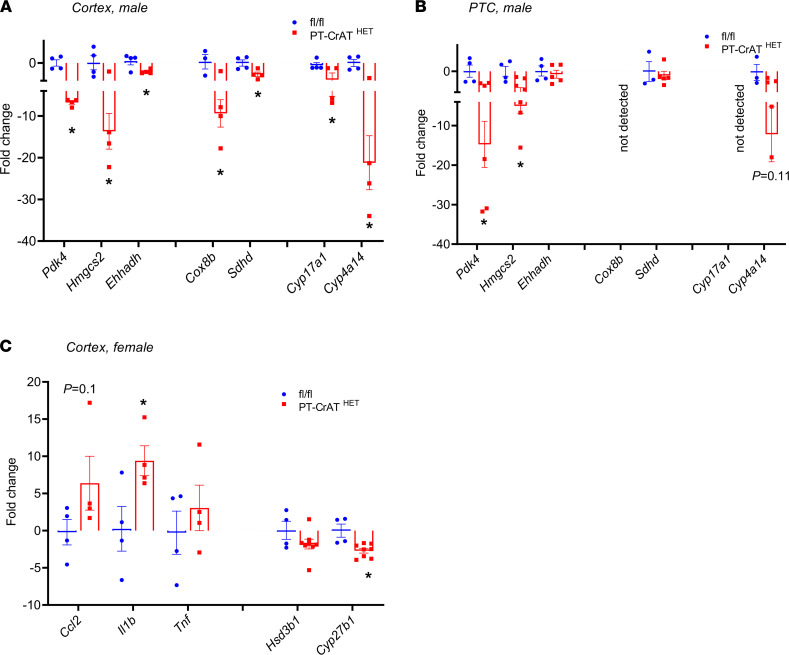
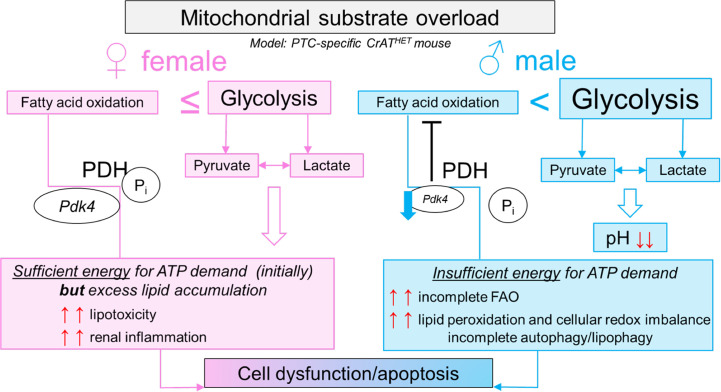
The importance of healthy mitochondrial function is implicated in the prevention of chronic kidney disease (CKD) and diabetic kidney disease (DKD). Sex differences also play important roles in DKD. Our previous studies revealed that mitochondrial substrate overload (modeled by homozygous deletion of carnitine acetyl-transferase [CrAT]) in proximal tubules causes renal injury. Here, we demonstrate the importance of intact mitochondrial substrate efflux by titrating the amount of overload through the generation of a heterozygous CrAT-KO model (PT-CrATHET mouse). Intriguingly, these animals developed renal injury similarly to their homozygous counterparts. Mitochondria were structurally and functionally impaired in both sexes. Transcriptomic analyses, however, revealed striking sex differences. Male mice shut down fatty acid oxidation and several other metabolism-related pathways. Female mice had a significantly weaker transcriptional response in metabolism, but activation of inflammatory pathways was prominent. Proximal tubular cells from PT-CrATHET mice of both sexes exhibited a shift toward a more glycolytic phenotype, but female mice were still able to oxidize fatty acid-based substrates. Our results demonstrate that maintaining mitochondrial substrate metabolism balance is crucial to satisfying proximal tubular energy demand. Our findings have potentially broad implications, as both the glycolytic shift and the sexual dimorphisms discovered herein offer potentially new modalities for future interventions for treating kidney disease.

Keywords: Chronic kidney disease; Fatty acid oxidation; Metabolism; Mitochondria; Nephrology.


Conflict of interest statement

Conflict of interest: The authors have declared that no conflict of interest exists.

Figures

Figure 1
Figure 1. Impaired mitochondrial substrate efflux in PTC modeled by CrAT haploinsufficiency causes renal injury.
(A and B) PAS staining of PT-CrATHET kidneys of male and female mice showing typical features of kidney injury when compared with fl/fl controls. Scale bars: blue, 2.5 mm; white, 10 mm; black, 100 μm. (C) Body weights and kidney/body weight ratios. (D) Havcr1 (Kim-1) expression levels and serum creatinine levels. (E) Tubular injury scores, glomerular tuft area, and glomerular scores were analyzed and compared. n = 5–7 mice/group, n = ~30 viewing areas/mouse kidney at the same magnification. *P < 0.05 versus control, #P < 0.05 versus male. Data are shown as mean ± SEM; 2-way ANOVA, Bonferroni’s post hoc test or Kruskal-Wallis test.
Figure 2
Figure 2. Ultrastructural analysis reveals lipid deposition and impaired autophagy in mitochondrial substrate overload–induced kidney disease.
Representative TEM microphotographs at 10,000×, yellow squares indicate an image on the next subpanel at 20,000×. (AD) Normal mitochondrial structure is shown in fl/fl mice (A and B) while PT-CrATHET mice display several large lipid droplets in PT cells (yellow arrows) (C and D). (E) Images were analyzed and mitochondrial number, circularity, and matrix density, and total number of lipid droplets were counted. (F) Normal podocyte foot processes in fl/fl mice. (G and H) Podocytes from PT-CrATHET mice have foot process effacement, analyzed as number of filtration slits/μm. (IN) Further examples of ultrastructural damage seen in several of the PT-CrATHET samples are shown in representative photographs. Lipid droplets and mitochondria with fragmented cristae (I and J), mitochondria with double membranes indicating mitophagy (black arrowheads, K and L) autolysosome-like bodies (blue arrows, M and N; counted in O), and — in males only — several large multilamellar body-like structures (P and Q). (R) Western blot analysis of the autophagy marker LC3-I/II. All images were analyzed using ImageJ, n = ~30–40 pictures/mouse kidney at the same magnification. *P < 0.05. Data are shown as mean ± SEM; 2-tailed Student’s unpaired t test or Mann-Whitney U test.
Figure 3
Figure 3. Glycolytic shift in PT-CrATHET tubules in males.
Mitochondrial oxygen consumption rates (OCR) and extracellular acidification rates (ECAR) were measured in freshly isolated PT fragments from male mice. (AD) Representative OCR/ECAR graphs showing a typical respiratory curve of PTC and its analysis using pyruvate (A), palmitate (B), or glucose (C and D). Oligo, oligomycin; AA, antimycin A; Etx, etomoxir; 2-DG, 2-deoxyglucose. n = 8 biological replicates, n = 10 technical replicates/experiment; 30 μg protein equivalent of PTC loaded/well. Data are shown as mean ± SEM. *P < 0.05; 2-tailed Student’s unpaired t test.
Figure 4
Figure 4. Glycolytic shift in PT-CrATHET tubules in females.
Mitochondrial oxygen consumption rates (OCR) and extracellular acidification rates (ECAR) were measured in freshly isolated PT fragments from female mice. (AD) Representative OCR/ECAR graphs showing a typical respiratory curve of PTC and its analysis using pyruvate (A), palmitate (B), or glucose (C and D). Oligo, oligomycin; AA, antimycin A; Etx, etomoxir; 2-DG, 2-deoxyglucose. n = 8 biological replicates, n = 10 technical replicates/experiment; 30 μg protein equivalent of PTC loaded/well. Data are shown as mean ± SEM. *P < 0.05; 2-tailed Student’s unpaired t test.
Figure 5
Figure 5. Impaired mitochondrial substrate efflux–induced transcriptomic responses in males and females.
Transcriptomic analyses of male and female kidneys from PT-CrATHET mice were performed using NGS and Ingenuity Pathway Analysis. Left panel shows the number of differentially regulated/expressed genes in PT-CrATHET females versus males and genes that are common in both sexes. Right panel shows cluster analysis with the distribution of all up- versus downregulated genes and potential outliers in normal versus PT-CrATHET kidneys. n = 3–6 animals/group; genes with a P < 0.1 cutoff in differential expression were considered in the analysis.
Figure 6
Figure 6. Transcriptomic pathway analyses of male and female kidneys from PT-CrATHET mice.
Transcriptomic pathway analyses of male and female kidneys from PT-CrATHET mice were performed using Ingenuity Pathway Analysis. The most prominent pathways enriched in disease development regarding toxicology, biological function, canonical pathways, and the activation Z scores are shown in males and females. Numbers behind each horizontal bar indicate the number of molecules (genes) found to be differentially expressed in a given pathway in PT-CrATHET mice. n = 3–6 animals/group; genes with a P < 0.1 cutoff in differential expression were considered in the analysis. Dashed red line indicates the threshold level.
Figure 7
Figure 7. Sex differences in transcriptional pathways in the PT-CrATHET model.
IPA’s Comparison Analysis showing the differences in enrichment of canonical pathways in males versus females based on absolute Z scores (inhibited, blue; activated, orange). Pathways with the most relevance to metabolic changes were marked with a red rectangle. n = 4–7 animals/group; genes with a P < 0.1 cutoff in differential expression were considered in the IPA analysis.
Figure 8
Figure 8. Sex differences in differential expression of genes in the PT-CrATHET model.
Heatmap analysis of individual genes in males versus females was conducted in IPA to reveal the most significant sex differences in gene up-/downregulation based on fold-change expression (upregulated, red; downregulated, green; also see color scale). n = 4–7 animals/group; genes with a P < 0.1 cutoff in differential expression were considered in the IPA analysis.
Figure 9
Figure 9. Selected metabolic and inflammatory genes in the PT-CrATHET model.
(AC) Some examples of the most relevant genes of metabolic (male) and inflammatory (female) pathways are shown and confirmed using qPCR analysis of male and female cortex (A and C) and male PTC (B). n = 4–6 animals/group; *P < 0.05. Data are shown as mean ± SEM; Student’s unpaired t test.
Figure 10
Figure 10. Proposed schematics of mitochondrial substrate overload in PTC.

Similar articles

Cited by

References

    1. Coresh J, et al. Prevalence of chronic kidney disease in the United States. JAMA. 2007;298(17):2038–2047. doi: 10.1001/jama.298.17.2038. - DOI - PubMed
    1. Chen J, et al. The metabolic syndrome and chronic kidney disease in U.S. adults. Ann Intern Med. 2004;140(3):167–174. doi: 10.7326/0003-4819-140-3-200402030-00007. - DOI - PubMed
    1. Sharma K. Mitochondrial hormesis and diabetic complications. Diabetes. 2015;64(3):663–672. doi: 10.2337/db14-0874. - DOI - PMC - PubMed
    1. Sharma K. Mitochondrial dysfunction in the diabetic kidney. Adv Exp Med Biol. 2017;982:553–562. - PubMed
    1. Kanwar YS, et al. Diabetic nephropathy: mechanisms of renal disease progression. Exp Biol Med (Maywood) 2008;233(1):4–11. doi: 10.3181/0705-MR-134. - DOI - PubMed

Publication types