. 2022 Apr;298(4):101779.
doi: 10.1016/j.jbc.2022.101779. Epub 2022 Feb 26.

Small molecule LATS kinase inhibitors block the Hippo signaling pathway and promote cell growth under 3D culture conditions

Affiliations

Small molecule LATS kinase inhibitors block the Hippo signaling pathway and promote cell growth under 3D culture conditions

Ayako Aihara et al. J Biol Chem. 2022 Apr.

Abstract

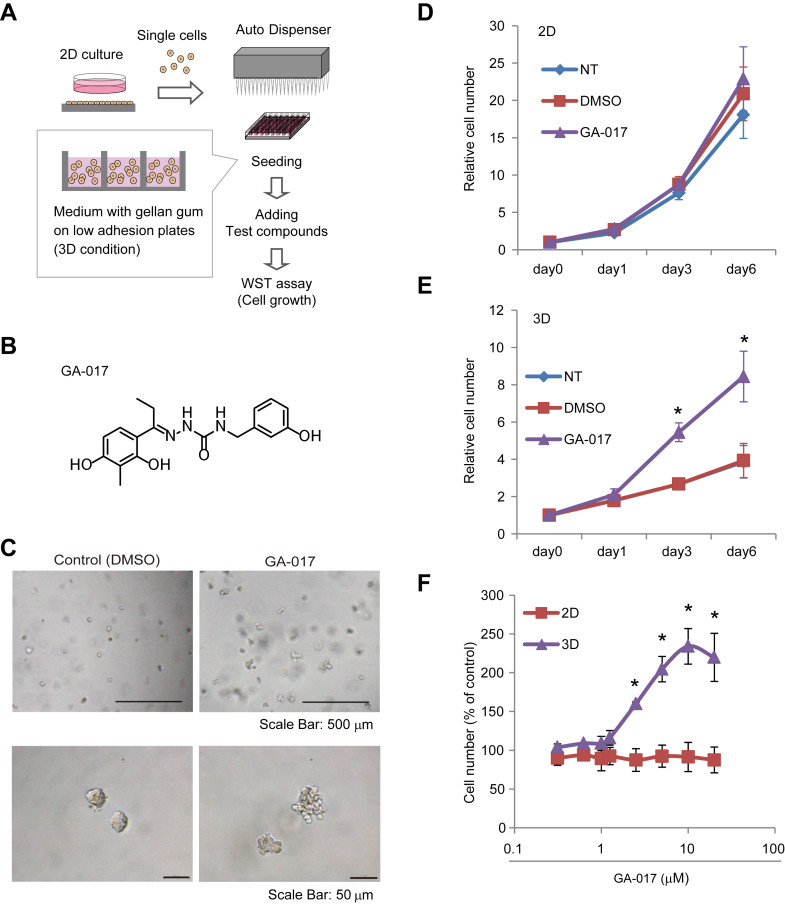
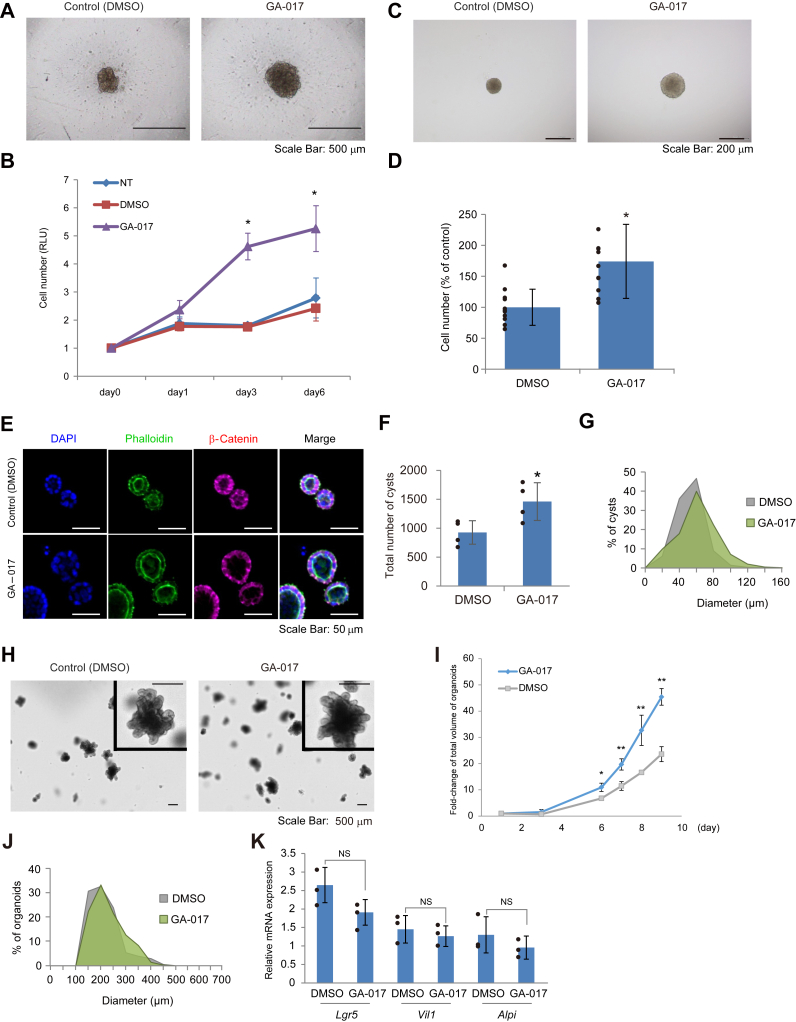
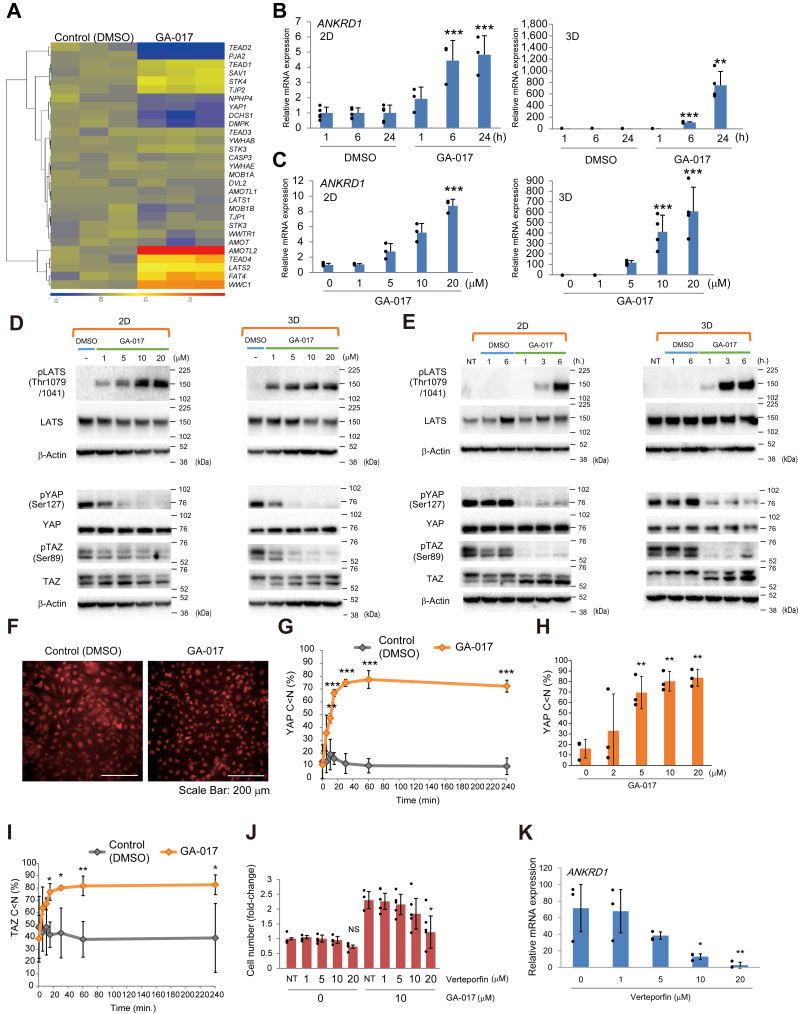
Although 3D cell culture models are considered to reflect the physiological microenvironment and exhibit high concordance with in vivo conditions, one disadvantage has been that cell proliferation is slower in 3D culture as compared to 2D culture. However, the signaling differences that lead to this slower proliferation are unclear. Here, we conducted a cell-based high-throughput screening study and identified novel small molecules that promote cell proliferation, particularly under 3D conditions. We found that one of these molecules, designated GA-017, increases the number and size of spheroids of various cell-types in both scaffold-based and scaffold-independent cultures. In addition, GA-017 also enhances the ex vivo formation of mouse intestinal organoids. Importantly, we demonstrate that GA-017 inhibits the serine/threonine protein kinases large tumor suppressor kinase 1/2, which phosphorylate Yes-associated protein and transcriptional coactivator with PDZ-binding motif , key effectors of the growth- and proliferation-regulating Hippo signaling pathway. We showed that GA-017 facilitates the growth of spheroids and organoids by stabilizing and translocating Yes-associated protein and transcriptional coactivator with PDZ-binding motif into the cell nucleus. Another chemical analog of GA-017 obtained in this screening also exhibited similar activities and functions. We conclude that experiments with these small molecule large tumor suppressor kinase inhibitors will contribute to further development of efficient 3D culture systems for the ex vivo expansion of spheroids and organoids.

Keywords: Hippo pathway; LATS; cell culture; high-throughput screening; inhibitor.


Conflict of interest statement

Conflict of interest All authors are inventors on patents related to this work. The authors declare that they have no other conflicts of interest with the contents of this article.

Figures

Figure 1
Figure 1
Identification of GA-017.A, illustration of high-throughput screening for cell growth regulators under 3D conditions using gellan gum. SKOV3 cells were suspended in medium containing gellan gum and dispersed in wells of low-attachment microplates. The cells formed spheroids during the culture while suspended. B, the chemical structure of GA-017. C, images of SKOV3 cells cultured in gellan gum–containing medium with DMSO or 10 μM GA-017 for 4 days. Left: control (DMSO), right: 10 μM GA-017, upper: low magnification, lower: high magnification. The bars represent 50 or 500 μm. D and E, time course of SKOV3 cell growth under 2D (D) or 3D (E) conditions evaluated using an ATP assay. The cell numbers on each day were normalized by the value on day 0. DMSO: vehicle control, GA-017: 10 μM GA-017. F, dose-dependent effect of GA-017 on SKOV3 cell growth evaluated using an ATP assay under 2D or 3D (with gellan gum) conditions for 4 days of culture. Y-axis indicates relative cell number (% of control) to vehicle control (DMSO). The data represent means ± SD of 3 to 4 independent experiments. Statistical significance was analyzed using Dunnett’s test for D, E, and F. ∗p<0.01. DMSO, dimethyl sulfoxide; NT, nontreatment,.
Figure 2
Figure 2
GA-017 promotes growth and/or organoid formation of SKOV3 and A431 spheroids, MDCK cysts, and mouse intestinal organoids.A and B, SKOV3 cells were cultured in wells of low-attachment U-bottom plates with DMSO or GA-017 for up to 6 days. A, images of SKOV3 cells cultured for 4 days in the well. Left: control (DMSO), right: 10 μM GA-017. The bars represent 500 μm. B, time course of SKOV3 cell growth evaluated using an ATP assay. Each RLU was normalized by that on day 0. DMSO: vehicle control, GA-017: 10 μM GA-017. The data represent means ± SD of three independent experiments. ∗p<0.01. C and D, A431 cells were cultured in hanging drops with DMSO or 10 μM of GA-017 for 2 days. C, images of A431 cells cultured in the drop. Left: control (DMSO), right: 10 μM GA-017. D, the number of cells cultured with DMSO or GA-017. Y-axis indicates relative cell number (% of control) to vehicle control (DMSO). The data represent means ± SD of 11 independent experiments. ∗p<0.01. E and G, MDCK cells were cultured in Matrigel for 6 days with DMSO (0.01%) or 10 μM GA-017. E, fluorescent images of MDCK cysts cultured for 6 days. Upper: control (DMSO), lower: 10 μM GA-017. β-catenin: magenta, phalloidin: green, nuclear (DAPI): blue. F, total number of MDCK cysts (diameter >30 μm). The data represent means ± SD of three independent experiments. ∗p<0.05. G, size distribution of MDCK cysts formed in Matrigel with GA-017 or DMSO. Shown is the ratio to the total cyst number. H–K, mouse intestinal organoids were cultured in Matrigel for up to 9 days with DMSO (0.01%) or 10 μM GA-017. H, images of organoids cultured for 9 days in Matrigel. Left: control (DMSO), right: 10 μM GA-017. I, time course of organoid formation. Y-axis indicates the total volume of organoids/total volume of initial crypts (day 1). ∗p<0.05, ∗∗p<0.01. J, size distribution of intestinal organoids formed in Matrigel with GA-017 or DMSO. Shown is the ratio to the total organoid number. K, relative Lgr5, Vil1, and Alpi mRNA expression in organoids on day 9, normalized by Gapdh. The data represent means ± SD of three independent experiments. Statistical significance was analyzed using Dunnett’s test for B or Student’s t test for D, F, I, and K. ∗p<0.01. DMSO, dimethyl sulfoxide; MDCK, Madin-Darby canine kidney; NS, not significant; NT, nontreatment.
Figure 3
Figure 3
GA-017 promotes YAP nuclear translocation.A, heat map of Hippo signaling-related genes (GO:0035329) from DNA array data of SKOV3 cells cultured in gellan gum–containing medium with DMSO (control) or 10 μM GA-017 for 24 h. B and C, relative ANKRD1 mRNA expression in SKOV3 cells cultured under 2D or 3D (with gellan gum) conditions with DMSO or GA-017. Signals were normalized by that of the GAPDH gene. Y-axis indicates relative mRNA expression to vehicle control (DMSO). Note the different scales of the Y-axes between 2D and 3D. The data represent means ± SD of three independent experiments. B, time course of ANKRD1 expression in response to DMSO or 10 μM GA-017. Left: 2D, right: 3D. ∗∗p<0.01, ∗∗∗p<0.001. C, dose-response to GA-017 at 24 h. Left: 2D, right: 3D. ∗∗∗p<0.001. D and E, western blot analysis of protein expression and phosphorylation levels of LATS, YAP, and TAZ in SKOV3 cells cultured in 2D or 3D (with gellan gum) with DMSO or GA-017. β-Actin was used for an internal control. The data are representative of three independent experiments. D, dose-response to GA-017 for 1 h. E, time course response to 10 μM GA-017. FH, nuclear translocation of YAP in SKOV3 cells cultured in 2D with DMSO or GA-017, detected by immunofluorescent staining. The data represent means ± SD of three independent experiments. F, fluorescent images of YAP nuclear translocation after treatment with 10 μM GA-017 for 4 h. The data are representative of three independent experiments. G, time course response to DMSO or 10 μM GA-017. Y-axis indicates the percent of cells with higher YAP signal intensity in the nucleus than the cytoplasm (C < N). ∗∗p<0.01, ∗∗∗p<0.001. H, dose-response to GA-017 for 4 h. ∗∗p<0.01. I, nuclear translocation of TAZ in SKOV3 cells cultured in 2D with DMSO or GA-017. Y-axis indicates the percent of cells with higher TAZ signal intensity in the nucleus than the cytoplasm (C < N). The data represent means ± SD of three independent experiments. ∗p<0.05, ∗∗p<0.01. J, SKOV3 cells were cultured with GA-017 and/or Verteporfin (YAP inhibitor) in low-attachment U-bottom plates for 4 days, and cell number was evaluated using an ATP assay. Y-axis indicates relative cell number (% of control) to nontreatment control (NT). ∗p<0.05. K, relative ANKRD1 mRNA expression in SKOV3 cells treated with DMSO or 10 μM GA-017 for 1 day in the presence or absence of 1 to 20 μM Verteporfin. Y-axis indicates relative mRNA expression to control (DMSO). The data represent means ± SD of 3 to 5 independent experiments. ∗p<0.05, ∗∗p<0.01. Statistical significance was analyzed using Dunnett’s test for C, H, J, and K or Student’s t test for B, G, and I. YAP, Yes-associated protein; DMSO, dimethyl sulfoxide; TAZ, transcriptional coactivator with PDZ-binding motif.
Figure 4
Figure 4
GA-017 inhibits LATS activity.A, tree-view map of 321 kinases examined in this study. Kinases inhibited by 0.1 μM GA-017 are indicated by red circles, with the size reflecting the degree of inhibition (i.e., with larger circles meaning stronger inhibition). Illustration reproduced the courtesy of Carna Biosciences, Inc. B and C, dose-response curves of GA-017 inhibition rate against LATS1 (B) and LATS2 (C) in the presence of 400 μM ATP. IC50 values were determined based on these experiments. Curve fitting was conducted using ImageJ (version 1.50i, Wayne Rasband National Institutes of Health). The data represent means ± SD of three independent experiments. D and E, lineweaver-Burk plots (the reciprocal of reaction velocity [V] versus reciprocal of the molar concentration of ATP) show the competitive inhibition of ATP by GA-017 against LATS1 (D) and LATS2 (E). Reaction velocity was determined as a function of ATP concentration ([ATP]), which was in the range from 100 to 400 μM. The data represent means ± SD of three independent experiments. IC50, 50% inhibition concentration; LATS, large tumor suppressor kinase.
Figure 5
Figure 5
LATS inhibition results in enhanced cell proliferation.AC, SKOV3 cells were cultured for 4 days in normal medium on normal flat-bottom plates (700 cells/well) (A) or low-attachment U-bottom plates (700 cells/well) (B) or in medium containing gellan gum on low-attachment flat-bottom plates (2000 cells/well) (C). DMSO, GA-017, or indicated kinase inhibitors were added during the culture. Cell number was evaluated using an ATP assay. Y-axis indicates relative cell number (% of control) to nontreatment control (NT). The data represent means ± SD of three independent experiments. Statistical significance was analyzed using Dunnett’s test. D, SKOV3 cells were cultured for 4 days on low-attachment U-bottom plates with DMSO or 10 μM GA-017 in the presence or absence of 0.1 to 10 μM kinase inhibitors. Cell number was evaluated using an ATP assay. Y-axis indicates relative cell number (% of control) to nontreatment control (NT) or vehicle control (DMSO). The data represent means ± SD of three independent experiments. Statistical significance was analyzed using Dunnett’s test. E and F, LATS1 or LATS2 was knocked out using the CRISPR/Cas9 method. E, confirmation of LATS1/2 deletion by Western blotting. Negative control was treated similarly in the procedure of the CRISPR/Cas9 method, but LATS1/2 was not deleted. β-Actin was used for an internal control. F, Cell growth of negative control, LATS1-deleted or LATS2-deleted cells on low-attachment U-bottom plates for 4 days was evaluated using an ATP assay. DMSO or 10 μM GA-017 was added during the culture. Each RLU was normalized by that of negative control. Statistical significance was analyzed using Tukey's test. The data represent means ± SD of three independent experiments. ∗ p <0.05, ∗∗p <0.01, ∗∗∗p <0.001. DMSO, dimethyl sulfoxide; LATS, large tumor suppressor kinase.
Figure 6
Figure 6
GA-017 does not affect signaling pathways other than YAP/TAZ.A, the mRNA expression of ERα-, p53-, mTOR-, and SREBP-regulated genes in SKOV3 cells cultured in medium containing gellan gum with DMSO or 10 μM GA-017 for 1 day. Signals were normalized by that of the GAPDH gene. Y-axis indicates relative mRNA expression to vehicle control (DMSO). The data represent means ± SD of three independent experiments. Statistical significance was analyzed using Student’s t test. B, SKOV3 cells were cultured in wells of low-attachment U-bottom plates with DMSO, GA-017, or indicated inhibitors and activators for 4 days. Cell number was evaluated using an ATP assay. Statistical significance was analyzed using Dunnett’s test. The data represent means ± SD of three independent experiments. C, SKOV3 cells were cultured in the presence of 10 μM GA-017 with DMSO or indicated inhibitors and activators for 4 days. Cell number was evaluated using an ATP assay. The data represent means ± SD of three independent experiments. Statistical significance was analyzed using Student’s t test. ∗∗∗p <0.001.; DMSO, dimethyl sulfoxide; ERα, estrogen receptor-α; SREBP, sterol regulatory element-binding protein; TAZ, transcriptional coactivator with PDZ-binding motif; YAP, Yes-associated protein.
Figure 7
Figure 7
Proposed mechanism of action of GA-017. GA-017 inhibits the kinase activity of LATS1/2 and subsequently stabilizes YAP/TAZ, inducing the expression of YAP/TAZ-regulated genes. The gene products consequently enhance the proliferation of cells. Subsequently observed changes in MST1/2 and LATS1/2 are indicated on the left. A possible feedback is also shown. LATS, large tumor suppressor protein; MST, Mammalian Ste20-like kinase; TAZ, transcriptional coactivator with PDZ-binding motif; YAP, Yes-associated protein.

References

    1. MacKee C., Chaudhry G.R. Advances and challenges in stem cell culture. Colloids Surf. B Biointerfaces. 2017;159:62–77. - PubMed
    1. Nava M.M., Raimondi M.T., Pietrabissa R. Controlling self-renewal and differentiation of stem cells via mechanical cues. J. Biomed. Biotechnol. 2012;2012:797410. - PMC - PubMed
    1. Fang Y., Eglen R.M. Three-dimensional cell cultures in drug discovery and development. SLAS Discov. 2017;22:456–472. - PMC - PubMed
    1. Kapałczyńska M., Kolenda T., Przybyła W., Zajączkowska M., Teresiak A., Filas V., Ibbs M., Bliźniak R., Łuczewski Ł., Lamperska K. 2D and 3D Cell Cultures - a comparison of different types of cancer cell cultures. Arch. Med. Sci. 2018;14:910–919. - PMC - PubMed
    1. Pampaloni F., Reynaud E.G., Stelzer E.H. The third dimension bridges the gap between cell culture and live tissue. Nat. Rev. Mol. Cell. Biol. 2007;8:839–845. - PubMed

MeSH terms

Substances