Randomized Controlled Trial
. 2022 Mar-Apr;15(2):458-471.
doi: 10.1016/j.brs.2022.02.008. Epub 2022 Feb 26.

Daily prefrontal closed-loop repetitive transcranial magnetic stimulation (rTMS) produces progressive EEG quasi-alpha phase entrainment in depressed adults

Affiliations
Randomized Controlled Trial

Daily prefrontal closed-loop repetitive transcranial magnetic stimulation (rTMS) produces progressive EEG quasi-alpha phase entrainment in depressed adults

Josef Faller et al. Brain Stimul. 2022 Mar-Apr.

Abstract

Background: Transcranial magnetic stimulation (TMS) is a non-invasive neuromodulation modality that can treat depression, obsessive-compulsive disorder, or help smoking cessation. Research suggests that timing the delivery of TMS relative to an endogenous brain state may affect efficacy and short-term brain dynamics.

Objective: To investigate whether, for a multi-week daily treatment of repetitive TMS (rTMS), there is an effect on brain dynamics that depends on the timing of the TMS relative to individuals' prefrontal EEG quasi-alpha rhythm (between 6 and 13 Hz).

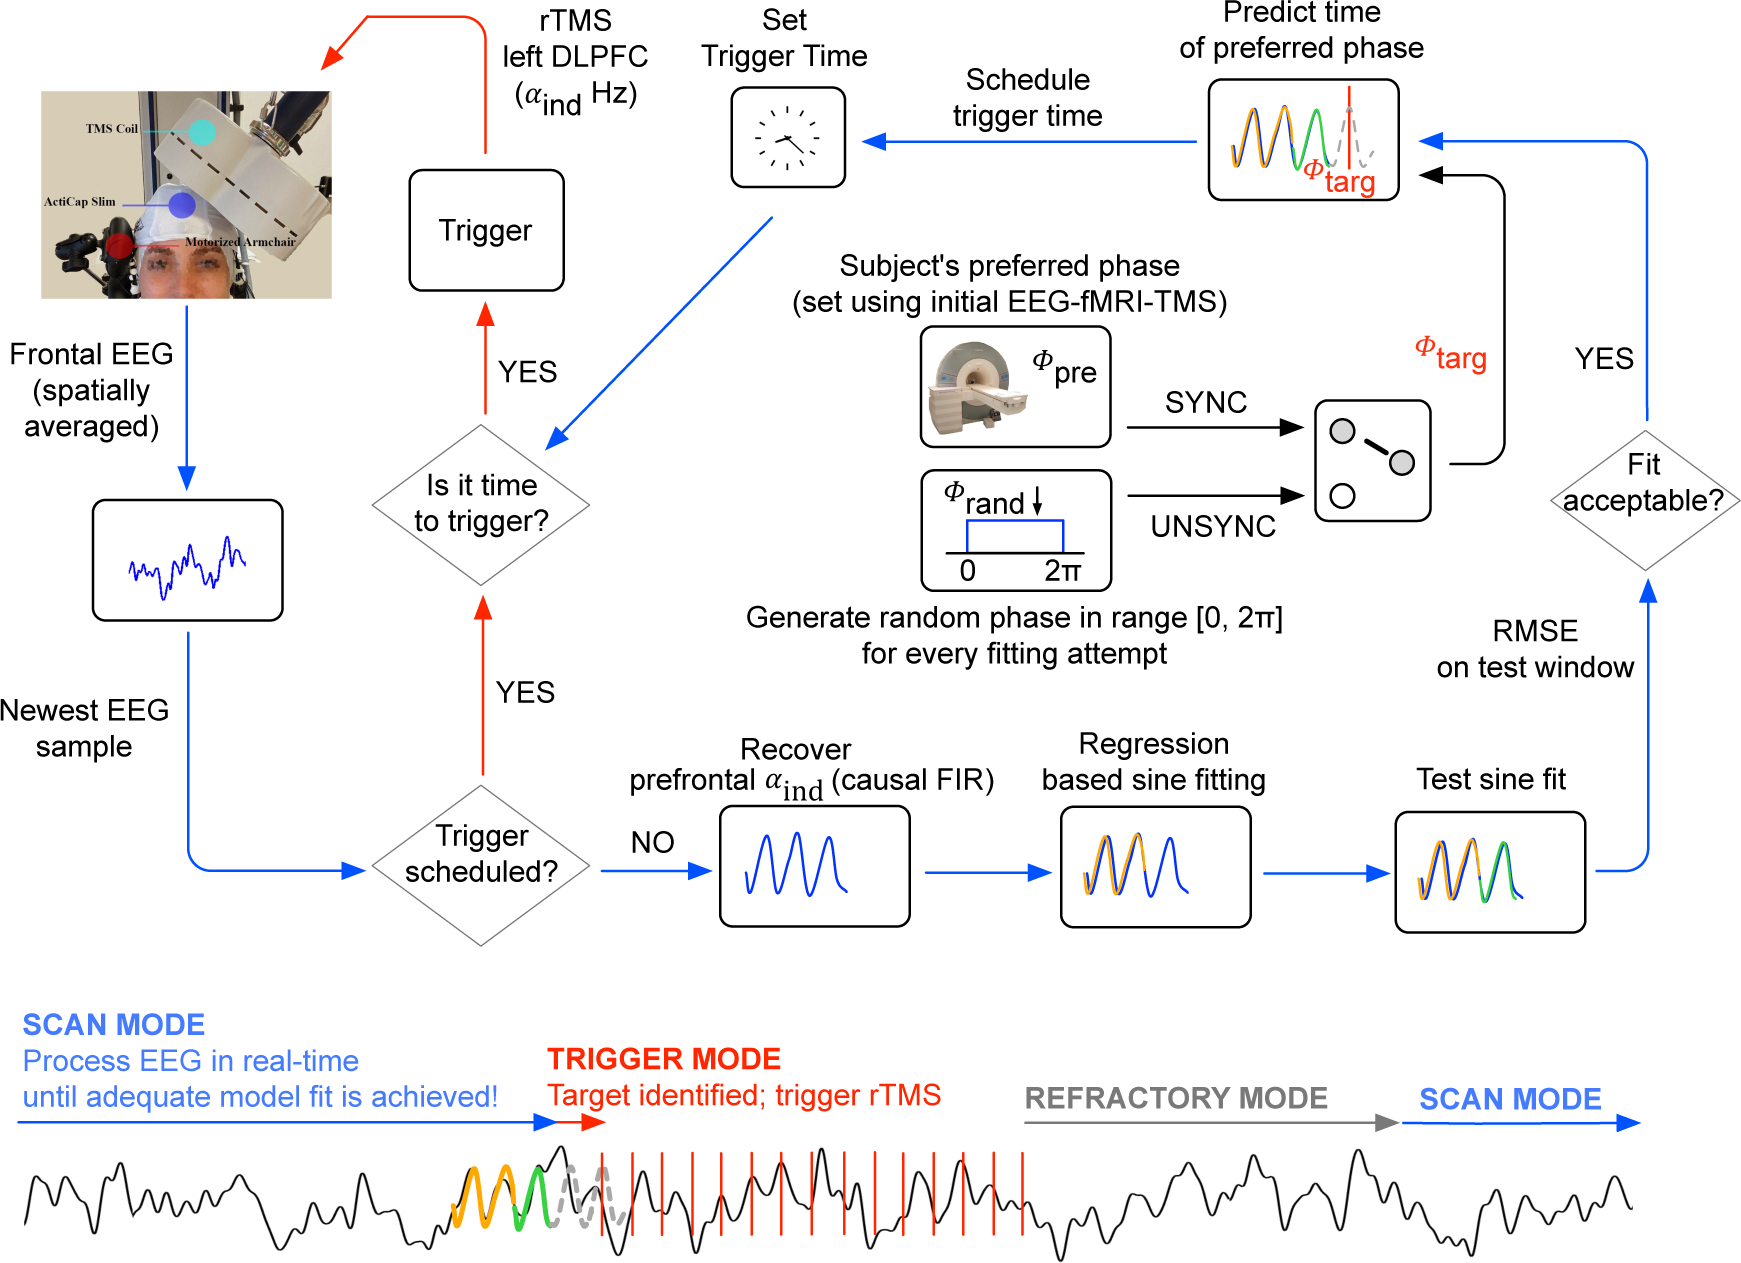
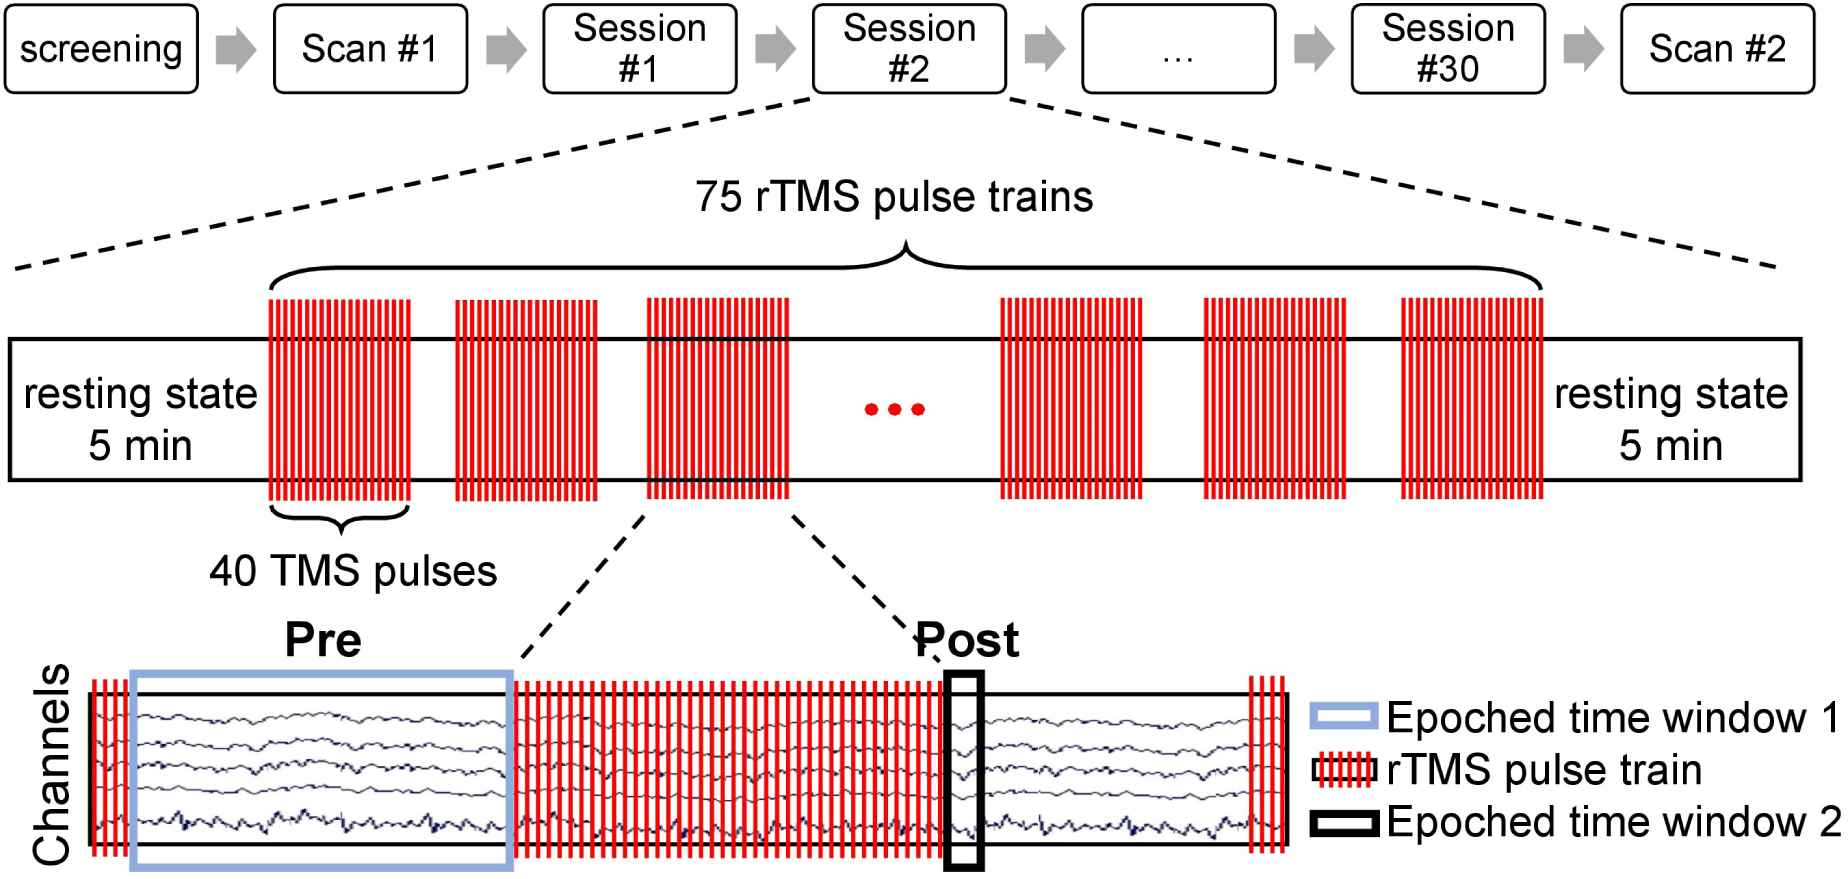
Method: We developed a novel closed-loop system that delivers personalized EEG-triggered rTMS to patients undergoing treatment for major depressive disorder. In a double blind study, patients received daily treatments of rTMS over a period of six weeks and were randomly assigned to either a synchronized or unsynchronized treatment group, where synchronization of rTMS was to their prefrontal EEG quasi-alpha rhythm.

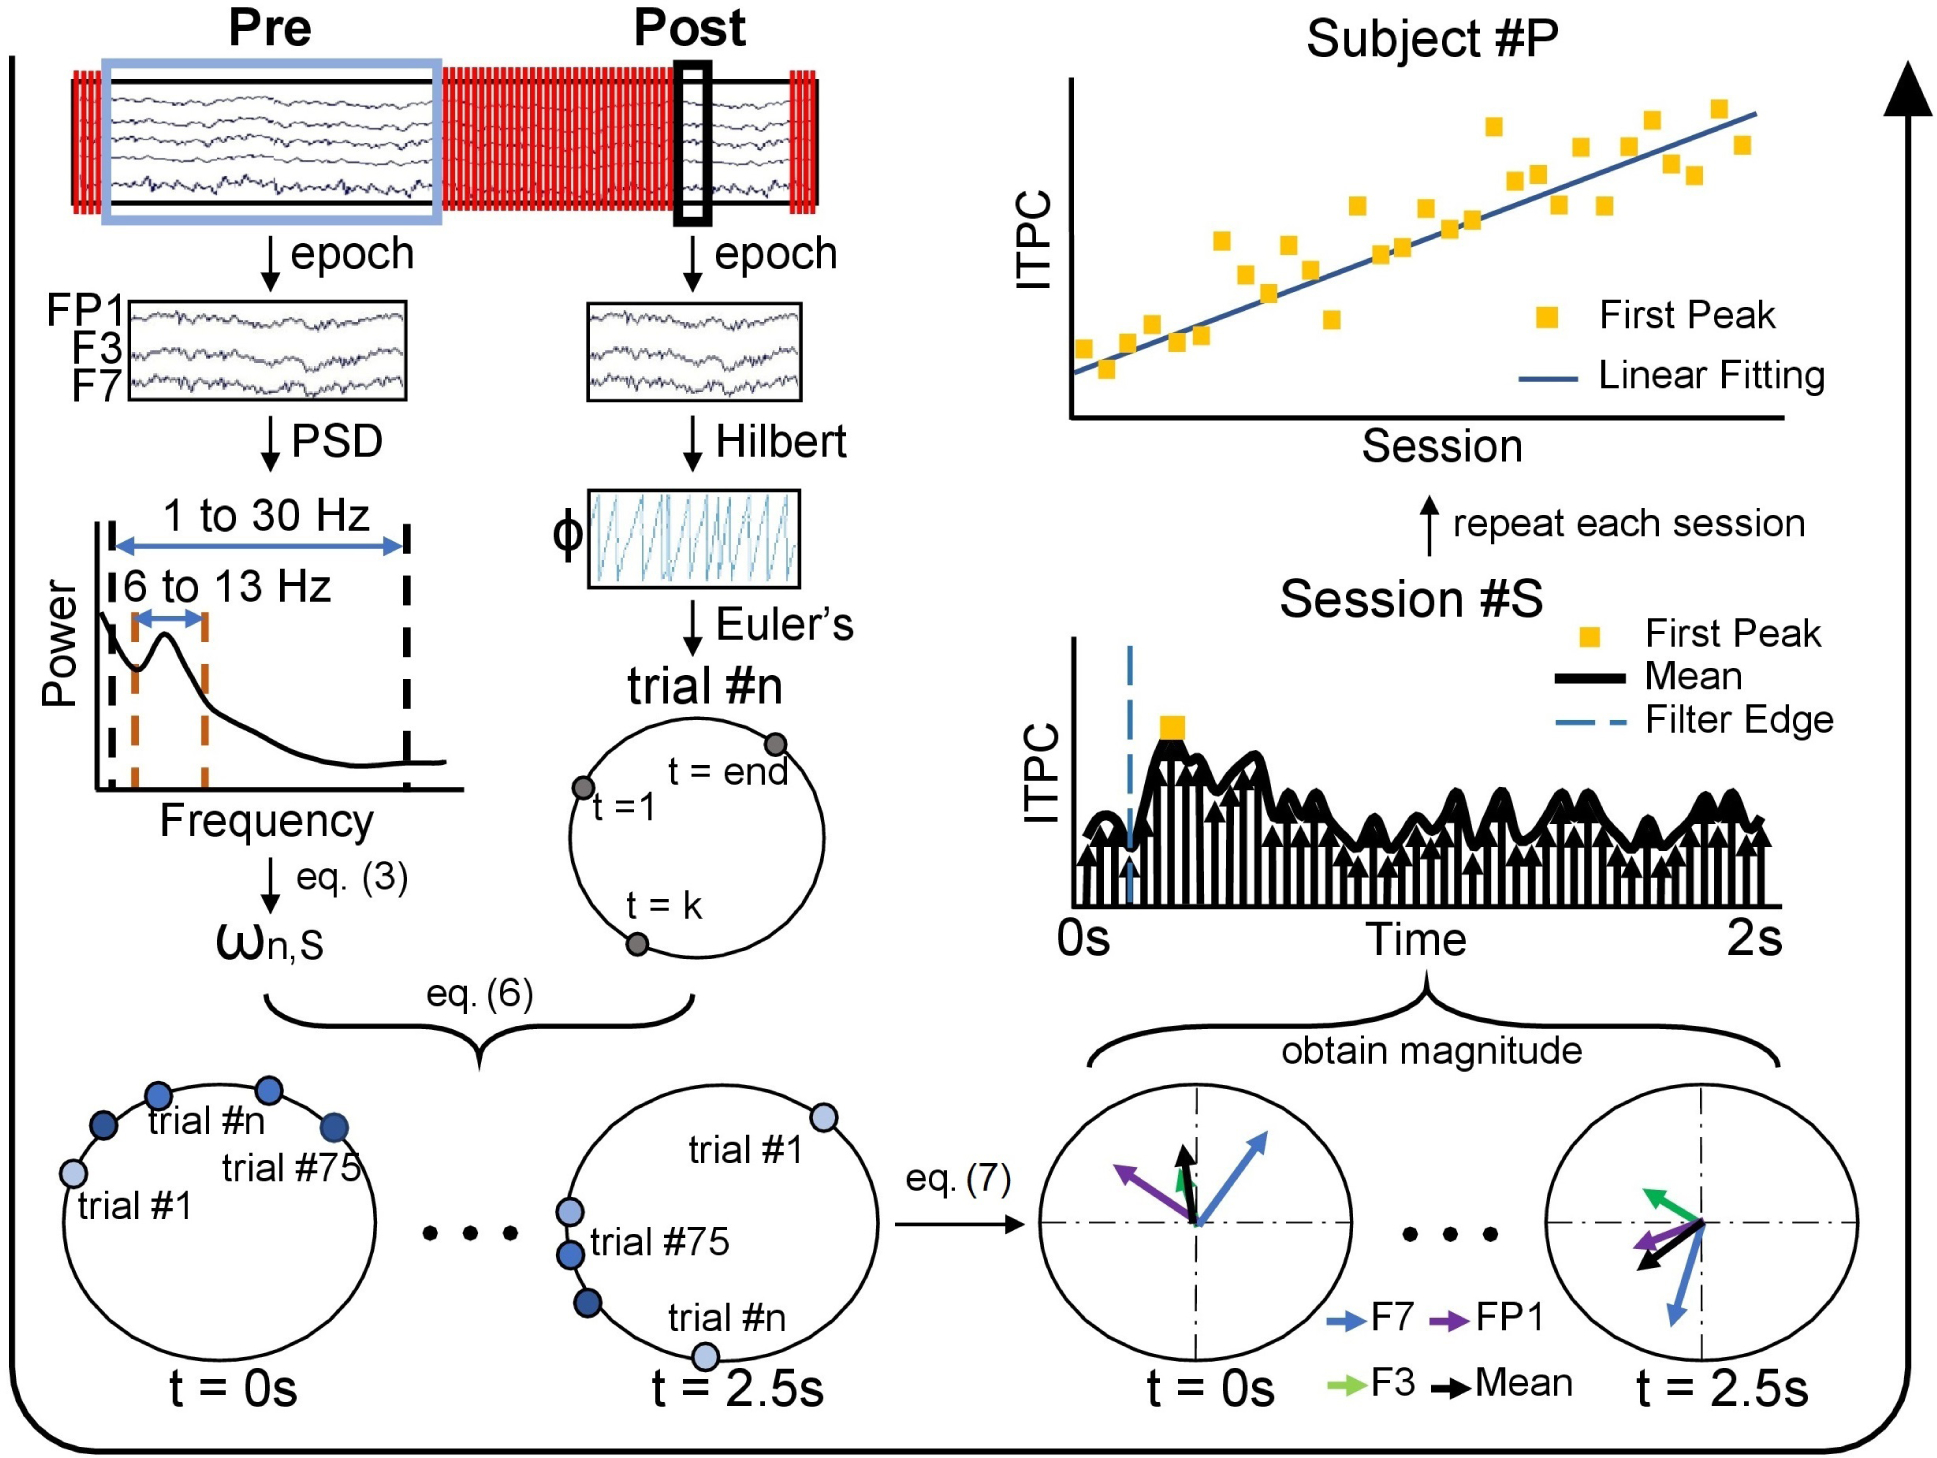
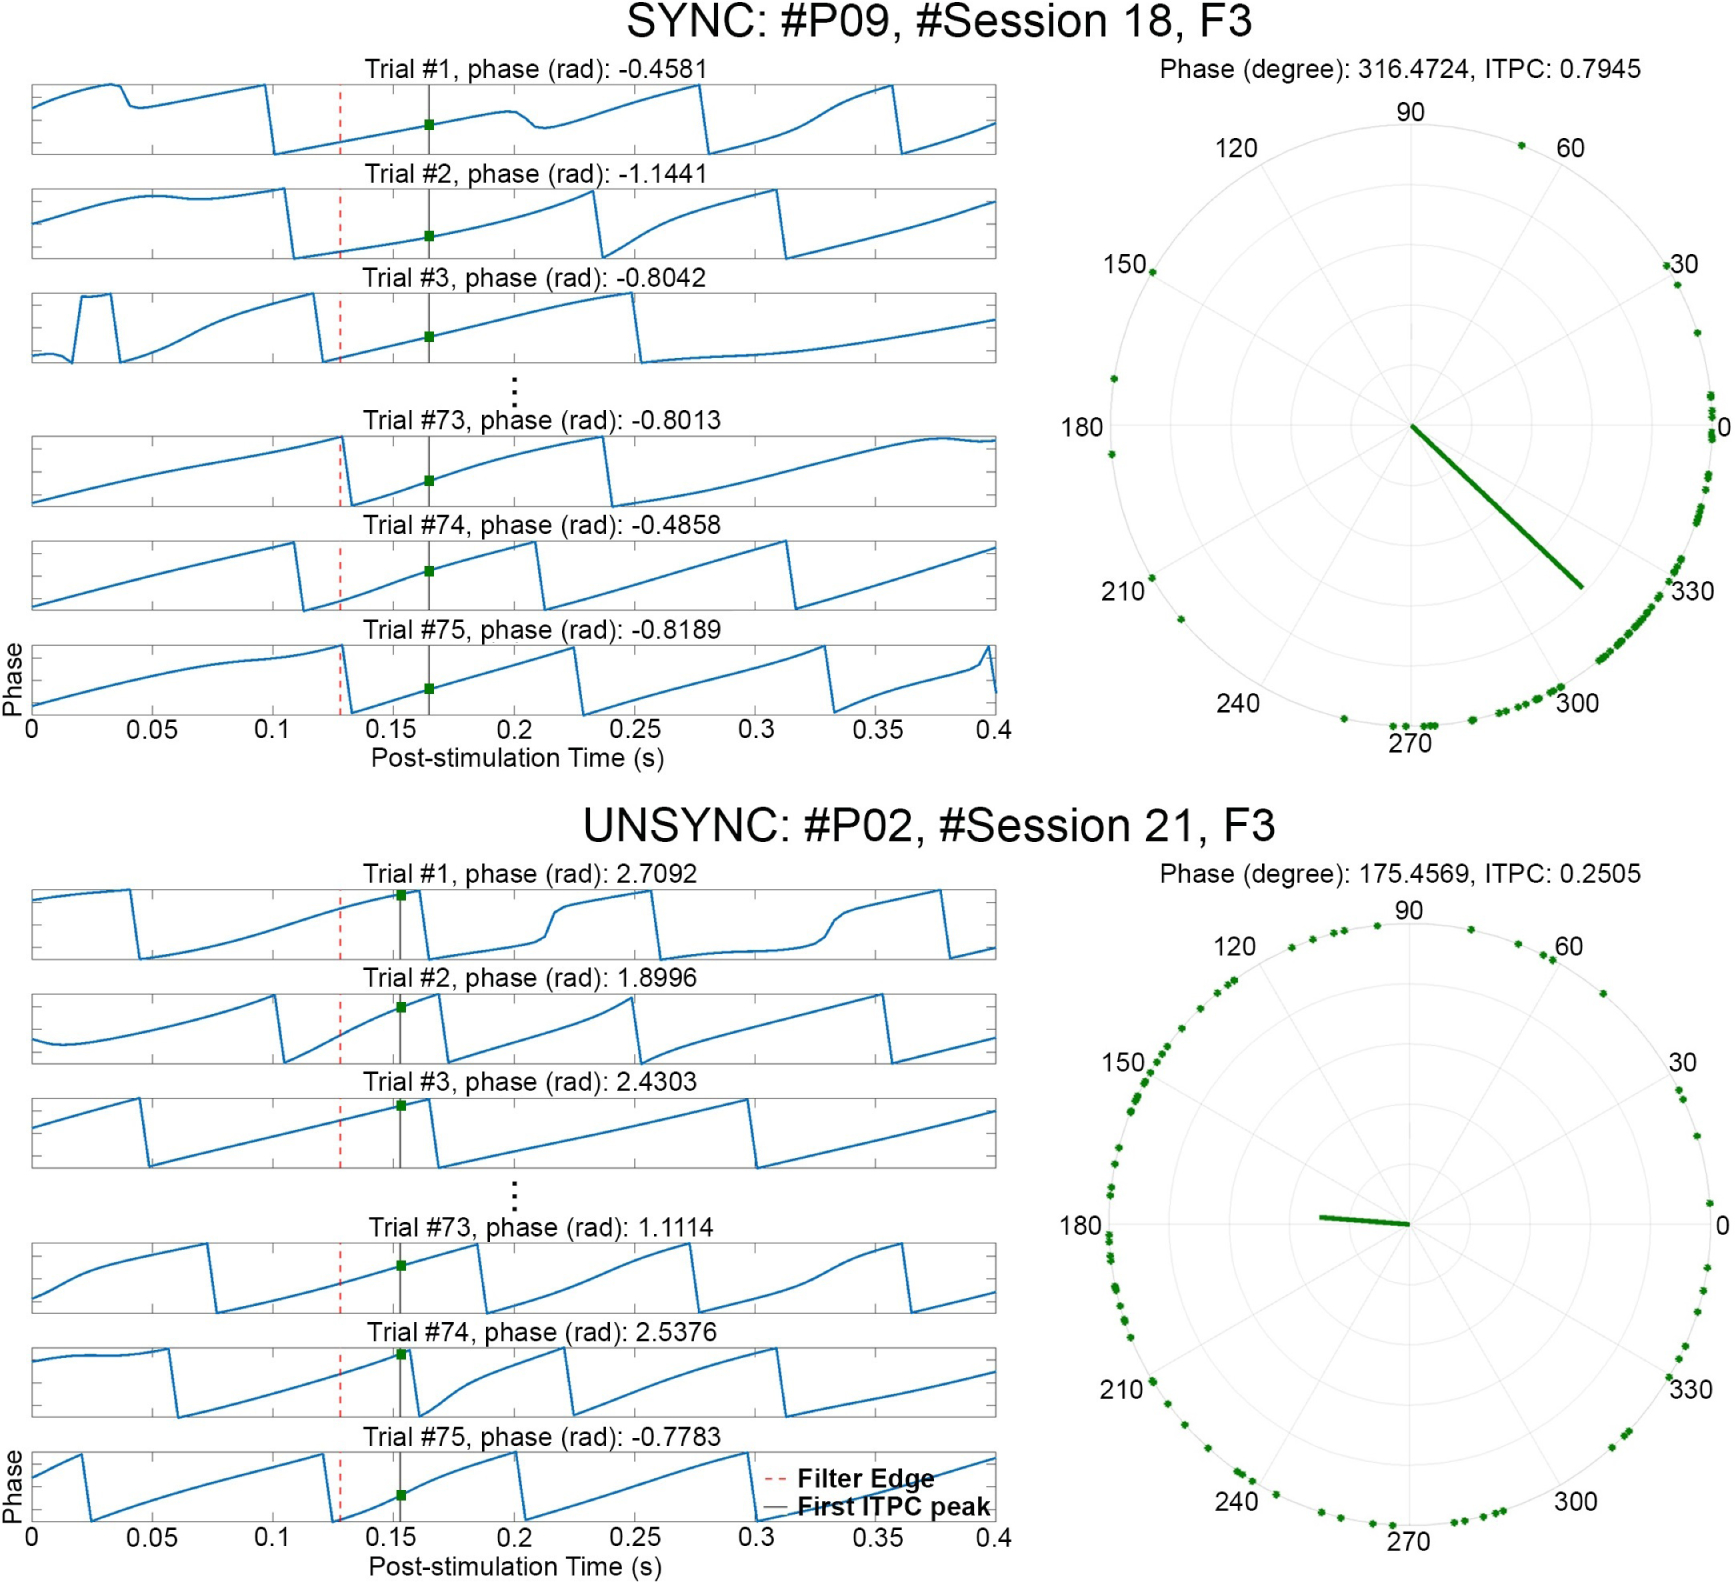
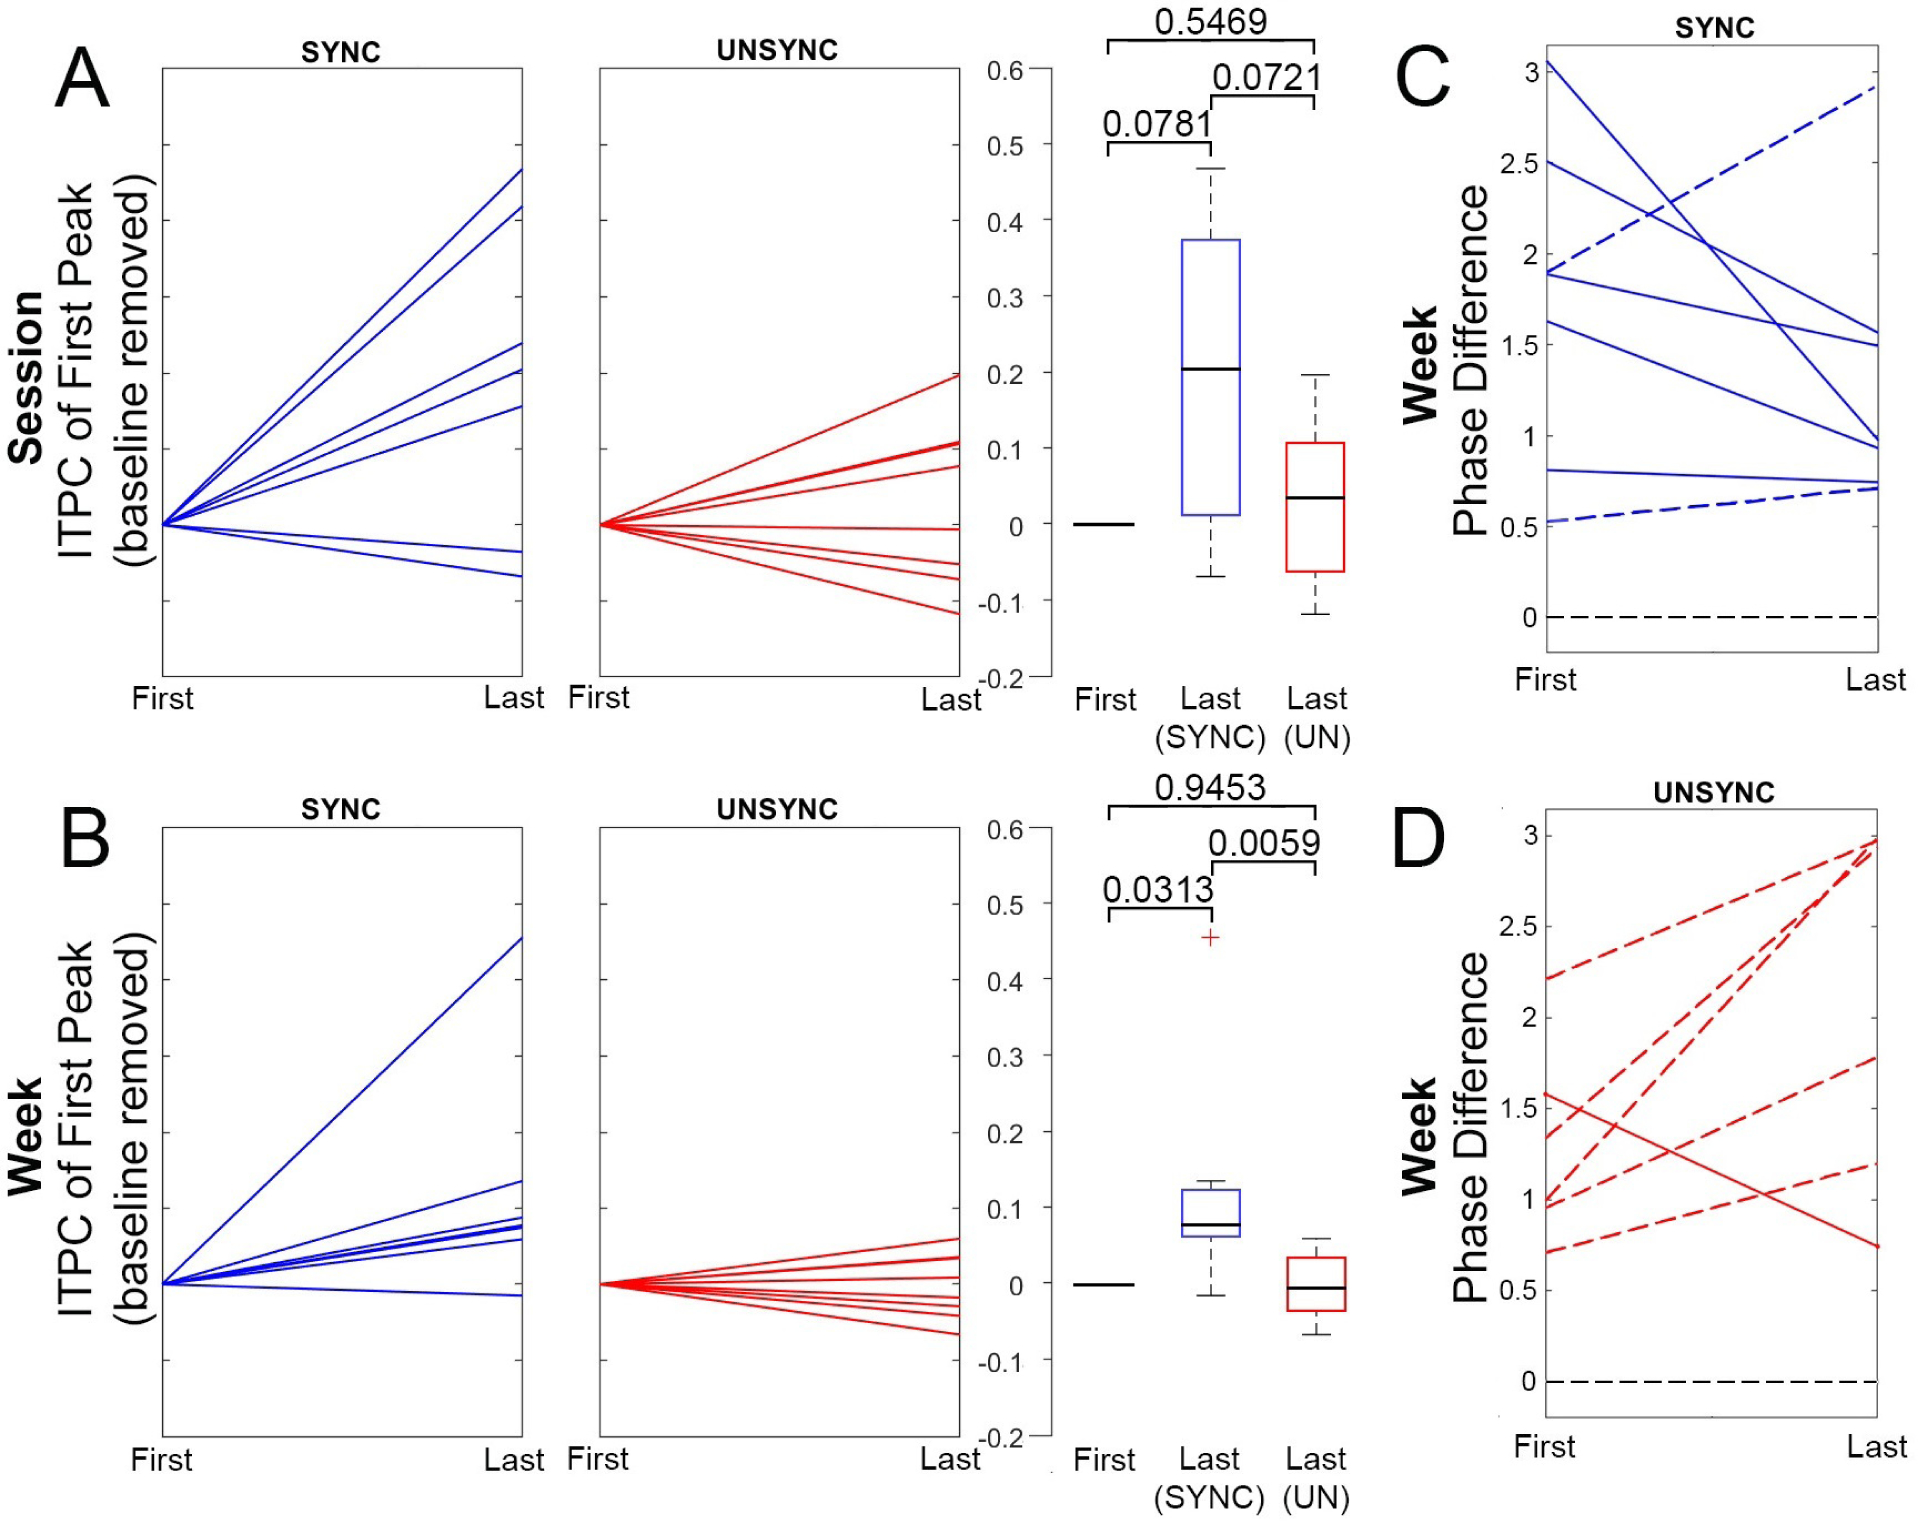
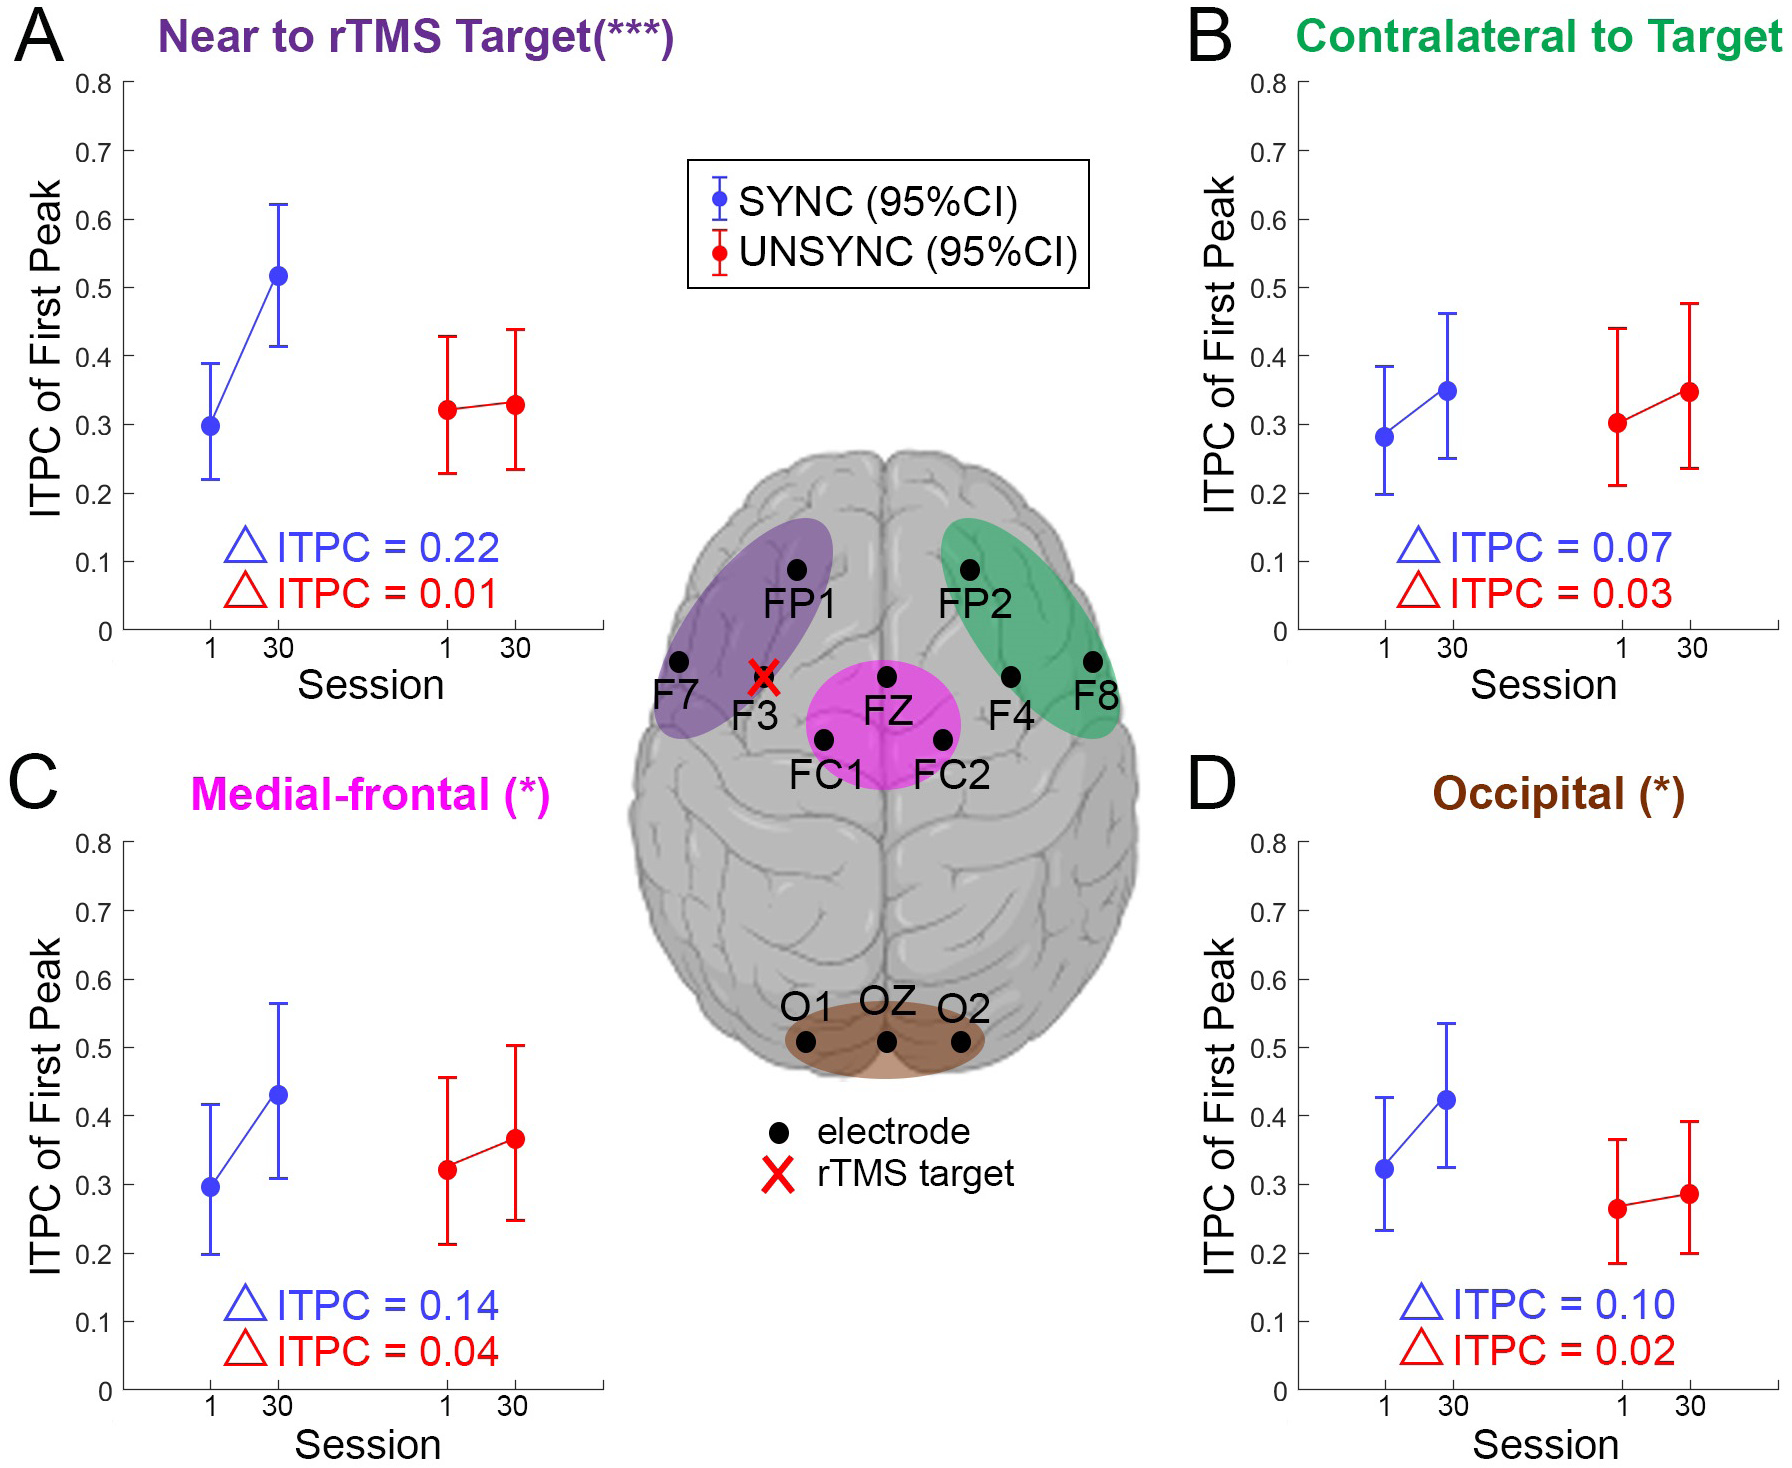
Results: When rTMS is applied over the dorsal lateral prefrontal cortex (DLPFC) and synchronized to the patient's prefrontal quasi-alpha rhythm, patients develop strong phase entrainment over a period of weeks, both over the stimulation site as well as in a subset of areas distal to the stimulation site. In addition, at the end of the course of treatment, this group's entrainment phase shifts to be closer to the phase that optimally engages the distal target, namely the anterior cingulate cortex (ACC). These entrainment effects are not observed in the group that is given rTMS without initial EEG synchronization of each TMS train.

Conclusions: The entrainment effects build over the course of days/weeks, suggesting that these effects engage neuroplastic changes which may have clinical consequences in depression or other diseases.

Keywords: Closed-loop neurostimulation; Electroencephalography (EEG); Inter-trial phase coherence (ITPC); Major depressive disorder (MDD); Repetitive transcranial magnetic stimulation (rTMS).


Figures

Figure 1.
Figure 1.
Logic of the closed-loop stimulation system that synchronizes the onset of rTMS to EEG alpha phase. The system continuously processes EEG in real-time, where the EEG is sampled at 10 kHz. To optimize throughput, data is read from the amplifier in chunks of 20 data points (i.e., samples). Subsequently, a low-pass antialiasing filter is applied with a cut-off at 50 Hz and the signal is downsampled to 500 Hz. For EEG processing, the logic switches between three operation modes, SCAN MODE (blue arrows), TRIGGER MODE (red arrows) and REFRACTORY MODE (grey arrow). Model fitting in SCAN MODE is performed in parallel to reading new data (multi-threading) and every new fitting attempt is always performed on the newest available data. Starting in SCAN MODE, the system fits multiple single-sine function models on to the individual’s prefrontal quasi-alpha signal (αind, 6 to 13 Hz; spatial average of FP1, F7 and F3) in a time window [−300, ~−100] ms relative to the newest EEG sample (see S.2 in supplementary material). The resulting model that achieves the lowest root mean square error (RMSE) on that training signal is used for prediction on a more recent test signal in the time window [−100,0]ms, again relative to the newest EEG sample. If the RMSE on that test signal does not reach below a pre-determined, subject-specific threshold (see S.4 in supplementary material), the logic continues with a new fitting attempt, but now again using data relative to the newest EEG data that arrived in real-time. Otherwise, if and only if the RMSE on that test signal is below this threshold, the single-sine model is used to predict the prefrontal quasi-alpha wave up to 123 ms into the future. The targeted phase, ϕtarg, then depends on the randomized treatment arm for that patient. For SYNC, ϕtarg is the subject specific preferred phase ϕpre that was determined in an initial combined fMRI-EEG-TMS experiment (see S.1 in supplementary material). For UNSYNC, ϕtarg is drawn from a uniform random distribution over the range [0,2π] at every prediction (ϕtarg ~U(0,2π)). Taking into account the group delay of causal filtering and processing time, the logic then schedules the rTMS trigger onset at the predicted future time of ϕtarg and switches into TRIGGER MODE. In TRIGGER MODE, no model fitting is attempted. Instead the logic keeps reading new data samples. Whenever the scheduled trigger time has arrived, a train of 40 TMS pulses is triggered where the inter-pulse-interval is the reciprocal of the subject’s individual alpha frequency (IAF, Δtipi = 1/IAF). Directly after the 40th pulse has been triggered, the logic switches into REFRACTORY MODE, where the system does nothing other than reading in new EEG samples for 2×40×1IAF or twice the amount of time it took to deliver 40 TMS pulses, after which the logic again switches into SCAN MODE.
Figure 2.
Figure 2.
Longitudinal treatment design. Before the pre-treatment scan (scan #1), all subjects were screened to meet both inclusion and exclusion criterion described in Materials and Methods section (see Subjects section for details). Then the first scan was done with the fET system to determine the pre-treatment preferred phase ϕpre, which was then used as the individual target phase ϕtarg for subjects in SYNC group during the entire EEG-rTMS treatment. During the six to seven week treatment period, each subject received a total of 30 rTMS treatment sessions (one treatment each weekday). In each session, there were two five-minute rest periods (before the first and after the last pulse train). Each treatment consisted of 75 rTMS pulse trains/session (3000 pulses/session). In each rTMS pulse train, 40 TMS pulses were delivered at the IAF for each subject. Two datasets were split off from the EEG recordings during the treatment session: Pre was used for estimating the trial weight of each pulse train, Post was used for computing the post-stimulation trial weighted inter-trial phase coherence. After all treatment sessions, another scan (scan #2) was done with the fET system to obtain the post-treatment preferred phase ϕpost.
Figure 3.
Figure 3.
Flowchart of trial-weighted inter-trial phase coherence (ITPC) calculation. Processing flow is indicated by the large black arrow which starts at the upper left and goes counterclockwise to the upper right. First, two datasets were generated, one Pre and one Post with respect to the TMS pulse train. The Pre data was used for the trial weight calculation and the Post segment was used for the post-stimulation phase calculation. For each pulse train, the trial weight, ωn,S, was calculated based on relative alpha power of the Pre segment. The phase of the Post segment was obtained by a Hilbert transform, shown in polar coordinate by applying Euler’s formula. This process was repeated for each pulse train of one session, and the results of each pulse train were combined via Equation (6) resulting in the trial weighted-phases, shown as polar coordinates, from t = 0 s to t = 2.5 s post rTMS pulse train. In the figure, trials with greater weight are shown with darker blue, while a smaller trial weight is shown as lighter blue. Using Equation (7), the trial weighted ITPC was calculated for each electrode in a region (shown here is the target region including electrodes FP1, F3, and F7) and the mean of the ITPC was also calculated across the three electrodes. The magnitude of vectors (mean, black) were plotted in the time window t = [0,2] s and the first peak of ITPC (ITPCmax[1]) was taken to present the post-stimulation ITPC value for that session. Finally, we analyzed how this time series of ITPCmax[1] changes across sessions for each subject #P, as shown in the upper right corner which uses a SYNC subject who has increasing phase entrainment as an example.
Figure 4.
Figure 4.
Estimate of phase entrainment in the quasi-alpha band (6 to 13 Hz) at the target electrode (F3). One session from a SYNC subject (#P09, #Session 18) and one session from an UNSYNC subject (#P02, #Session 21) are presented. For each trial of a session, the phase of the Post stimulation segment was obtained via Hilbert transform after alpha-band filtering, with the phase value shown (blue line) in each subpanel on the left. t = 0 refers to the end of one rTMS pulse train and the red dashed line in each subpanel indicates the filter edge (t = 0.128 s). The black solid line is the corresponding time point where the first post-stimulation ITPC peak (ITPCmax[1]) was detected (one value was calculated per session). The intersection (green dot) of the blue line and black line is the corresponding phase value of ITPCmax[1]. These points, across all trials of a session, are combined via Equation (5) resulting in the phase points shown as the green dots on the polar coordinates (r = 1) on the right. Using Equation (6) and (7), the trial weighted ITPCmax[1] (green bar) is calculated for electrode F3 based on these points. In this example, the value of ITPCmax[1] for this SYNC subject is two times greater (ITPCmax[1] = 0.7945) than this UNSYNC subject (ITPCmax[1] = 0.2505) indicating much greater entrainment on F3.
Figure 5.
Figure 5.
Longitudinal changes in quasi-alpha entrainment for SYNC and UNSYNC groups. (A) Change in quasi-alpha entrainment between the first and last session, as measured by ITPCmax[1]. In each panel, blue represents the SYNC group and red represents the UNSYNC group. Each line is an individual subject (7 SYNC subjects and 8 UNSYNC subjects). Boxplots of data are shown on the right, together with the corresponding p-values of non-parametric tests of group level effects. Boxplots include the minimum, first (lower) quartile, median, third (upper) quartile, and maximum value of ΔITPCmax[1], where the middle black line shows the median, the hinges represent first and third quartile and whiskers span from smallest to largest value in the data but reach out no further than 1.5 times the interquartile range. The data located outside of this range is indicated with a red cross. Panel (B) is similar to (A), except that pre- and post-treatment ITPCmax[1] values are not derived from single sessions (i.e., the first and the last) but instead more robustly from an average across all sessions of one week (i.e., first vs last treatment week). (C) For the SYNC group (blue), this panel shows the difference (Δϕ ∈ [0]) between the preferred phases (ϕpre and ϕpost) and the phases at which ITPC peaked post-rTMS (see Figure 3, center right) at two time points, before and after six weeks of treatment (ϕent,1st presents the first week and ϕent,6th presents the last week). Pre- and post-treatment preferred phase (ϕpre and ϕpost) were obtained from two separate fET sessions acquired before (pre) and after (post) the full treatment course. Each line represents one subject, and seven subjects are included. A solid line indicates that the phase average of the last treatment week is closer to the preferred phase (|ϕent,6thϕpost| < |ϕent,1stϕpre|), while a dashed line indicates that the phase average of the last week is further away from the preferred phase (|ϕent,6thϕpost| > |ϕent,1stϕpre|). The black dashed line at phase difference Δφ = 0 at the bottom represents the point where post-rTMS ITPC peak phase is exactly at the individual’s preferred phase (|ϕent,6thϕpost| = |ϕent,1stϕpre| = 0). Panel (D) is similar to (C), except that the comparison is performed for the UNSYNC group (red) which includes six subjects with complete data.
Figure 6.
Figure 6.
Following the significant effect observed for the interaction between session and group (see Table 4), we here show the effect of treatment session separately for UNSYNC and SYNC groups (i.e., marginal effect) across four different regions of interest (ROIs) based on the GLMM prediction. The central figure defines the ROIs and the electrodes used in the analysis. All ROIs consist of three electrodes. rTMS is applied over the left DLPFC (over electrode F3) for all subjects. (A) The model prediction of changes in ITPCmax[1] between the first and last session for SYNC and UNSYNC groups at the ROI near the rTMS target ROI, (B) contralateral to the target ROI, (C) in the medial-frontal ROI and (D) in the occipital ROI. The interaction-term of session and SYNC/UNSYNC group in the GLMM was highly significant in (A) (***, p < 0.01), significant in (C) and (D) (*, 0.01 < p < 0.05) but not significant in (B).

Similar articles

Cited by

References

    1. Akar SA, Kara S, Agambayev S, and Bilgiç V (2015). Nonlinear analysis of EEGs of patients with major depression during different emotional states. Computers in biology and medicine, 67:49–60. - PubMed
    1. Anderson RJ, Hoy KE, Daskalakis ZJ, and Fitzgerald PB (2016). Repetitive transcranial magnetic stimulation for treatment resistant depression: Re-establishing connections. Clinical Neurophysiology, 127(11):3394–3405. - PubMed
    1. Arns M, Cerquera A, Gutiérrez RM, Hasselman F, and Freund JA (2014). Non-linear EEG analyses predict non-response to rTMS treatment in major depressive disorder. Clinical Neurophysiology, 125(7):1392–1399. - PubMed
    1. Bachmann M, Päeske L, Kalev K, Aarma K, Lehtmets A, Ööpik P, Lass J, and Hinrikus H (2018). Methods for classifying depression in single channel EEG using linear and nonlinear signal analysis. Computer methods and programs in biomedicine, 155:11–17. - PubMed
    1. Barbas H, Ghashghaei H, Rempel-Clower N, and Xiao D (2002). Anatomic basis of functional specialization in prefrontal cortices in primates. Handbook of neuropsychology, 7:1–28.

Publication types