

Misconceptions About the Direction of Bias From Nondifferential Misclassification
- PMID: 35231925
- PMCID: PMC9989338
- DOI: 10.1093/aje/kwac035
Misconceptions About the Direction of Bias From Nondifferential Misclassification
Erratum in
-
CORRECTION TO "MISCONCEPTIONS ABOUT THE DIRECTION OF BIAS FROM NONDIFFERENTIAL MISCLASSIFICATION".Am J Epidemiol. 2022 Nov 19;191(12):2123. doi: 10.1093/aje/kwac129. Am J Epidemiol. 2022. PMID: 36205044 Free PMC article. No abstract available.
Abstract
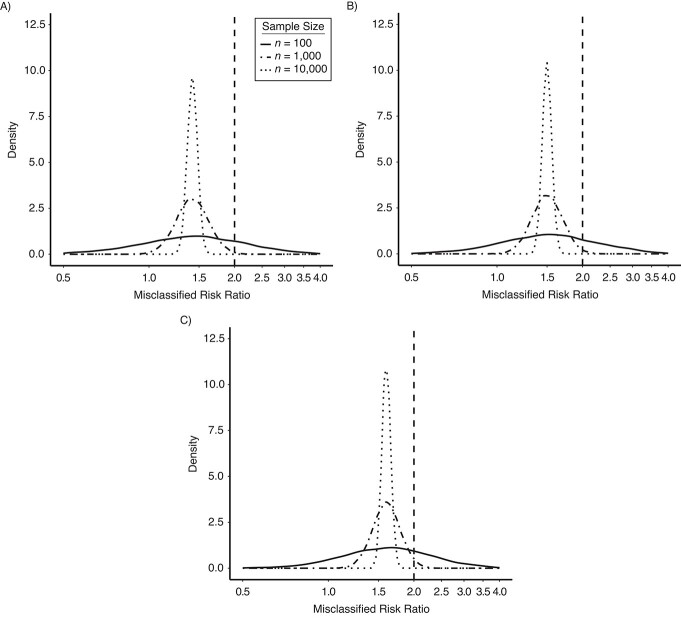
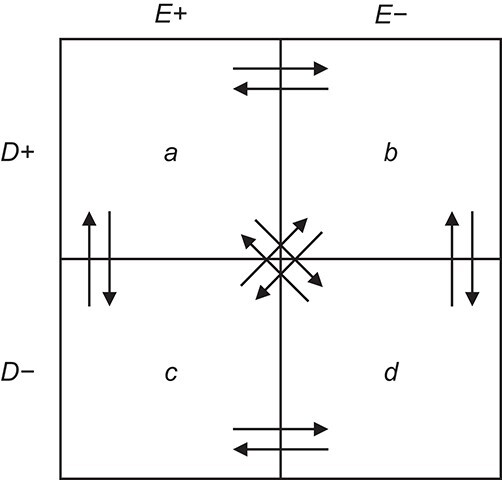
Measurement error is pervasive in epidemiologic research. Epidemiologists often assume that mismeasurement of study variables is nondifferential with respect to other analytical variables and then rely on the heuristic that "nondifferential misclassification will bias estimates towards the null." However, there are many exceptions to the heuristic for which bias towards the null cannot be assumed. In this paper, we compile and characterize 7 exceptions to this rule and encourage analysts to take a more critical and nuanced approach to evaluating and discussing bias from nondifferential mismeasurement.
Keywords: bias (epidemiology); epidemiologic methods; information bias; measurement error; nondifferential misclassification; statistics.
© The Author(s) 2022. Published by Oxford University Press on behalf of the Johns Hopkins Bloomberg School of Public Health. All rights reserved. For permissions, please e-mail: journals.permissions@oup.com.
Figures
Comment in
-
Yland et al. Respond to "Heuristics and Wish Bias".Am J Epidemiol. 2022 Jul 23;191(8):1498-1499. doi: 10.1093/aje/kwac092. Am J Epidemiol. 2022. PMID: 35641149 Free PMC article. No abstract available.
-
Invited Commentary: Is Bias Towards the Null From Nondifferential Misclassification Wishful Thinking?Am J Epidemiol. 2022 Jul 23;191(8):1496-1497. doi: 10.1093/aje/kwac091. Am J Epidemiol. 2022. PMID: 35641192
References
-
- Barron BA. The effects of misclassification on the estimation of relative risk. Biometrics. 1977;33(2):414–418. - PubMed
-
- Copeland KT, Checkoway H, McMichael AJ, et al. Bias due to misclassification in the estimation of relative risk. Am J Epidemiol. 1977;105(5):488–495. - PubMed
-
- Greenland S. The effect of misclassification in the presence of covariates. Am J Epidemiol. 1980;112(4):564–569. - PubMed
-
- Greenland S, Kleinbaum DG. Correcting for misclassification in two-way tables and matched-pair studies. Int J Epidemiol. 1983;12(1):93–97. - PubMed
-
- Carroll RJ, Ruppert D, Stefanski LA, et al. Measurement Error in Nonlinear Models: A Modern Perspective. Boca Raton, FL: Chapman & Hall/CRC Press; 2006.
