. 2022 Mar;12(3):210307.
doi: 10.1098/rsob.210307. Epub 2022 Mar 2.

Helicoverpa armigera miR-2055 regulates lipid metabolism via fatty acid synthase expression

Affiliations

Helicoverpa armigera miR-2055 regulates lipid metabolism via fatty acid synthase expression

Yang Cheng et al. Open Biol. 2022 Mar.

Abstract

Insect hormones and microRNAs regulate lipid metabolism, but the mechanisms are not fully elucidated. Here, we found that cotton bollworm larvae feeding on Arabidopsis thaliana (AT) leaves had a lower triacylglycerol (TAG) level and more delayed development than individuals feeding on artificial diet (AD). Association analysis of small RNA and mRNA revealed that the level of miR-2055, a microRNA related to lipid metabolism, was significantly higher in larvae feeding on AT. Dual-luciferase reporter assays demonstrated miR-2055 binding to 3' UTR of fatty acid synthase (FAS) mRNA to suppress its expression. Elevating the level of miR-2055 in larvae by agomir injection decreased FAS mRNA and protein levels, which resulted in reduction of free fatty acid (FFA) and TAG in fat body. Interestingly, in vitro assays illustrated that juvenile hormone (JH) increased miR-2055 accumulation in a dosage-dependent manner, whereas knockdown of Methoprene tolerant (Met) or Kruppel homologue 1 (Kr-h1) decreased the miR-2055 level. This implied that JH induces the expression of miR-2055 via a Met-Kr-h1 signal. These findings demonstrate that JH and miRNA cooperate to modulate lipid synthesis, which provides new insights into the regulatory mechanisms of metabolism in insects.

Keywords: Helicoverpa armigera; development; juvenile hormone; lipid metabolism; microRNA.


Conflict of interest statement

The authors declare that they have no competing interests.

Figures

Figure 1.
Figure 1.
Changes of lipid metabolism and development in H. armigera fed on different diets. (a) Weight change of H. armigera fed on different diets. The body weight of H. armigera was measured before treatments and at the first, second, fourth and seventh day after being fed on different diets. The weight change represented the difference between the weight before and after treatments (mean ± s.e.m). (b) The fat body of H. armigera was stained with Nile red after fed on different diets at the first, second, fouth and seventh day, and examined by the laser scanning microscope. Scale bar, 20 µm. (ce) Pupation time (c), pupa weight (d) and pupa size (e) of H. armigera fed on different diets. AD, H. armigera fed on artificial diet; AT, H. armigera fed on A. thaliana. ***, p < 0.001, p < 0.05 indicated the significant difference (Student's t-test), and data of pupa weight were shown as mean ± s.e.m.
Figure 2.
Figure 2.
Alteration of microRNA expression profile in H. armigera fed on different diets. (a) Expression analysis of differentially expressed miRNAs in H. armigera fed on different diets. The x-axis indicates the 28 differential expressed miRNAs, and the y-axis indicates the miRNA expression level. The relative miRNA expression level was represented by the average readcount of three duplicates. (b) Venn diagram representation of candidate target genes of DEMs (green circle) and DEGs from transcriptomic data (red circle). Numbers in black type indicate numbers of genes, while numbers in white type indicate numbers of upregulated and downregulated genes.
Figure 3.
Figure 3.
Transcriptomic analysis of DEGs in H. armigera fed on different diets. (a) KEGG functional enrichment analysis of upregulated genes and downregulated genes. The size of the dots represents the gene number, and the colour represents the q-value of the enrichment. Gene ratio is the ratio between the enriched gene number and the total gene number of the corresponding pathway. (b) Hierarchical clustering analysis of differentially expressed lipid metabolism-related genes.
Figure 4.
Figure 4.
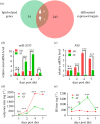
Diets changed expression of lipid-related genes and titres of insect hormones in H. armigera. (a) Venn diagram representation of lipid-related genes (green circle) and differentially expressed target genes of DEMs (red circle). (b,c) Expression analysis of miR-2055 (b) and FAS (c) in H. armigera fed on different diets. HaU6 was set as the internal reference for miRNA, and HaRPS3 was set as the internal reference for the target gene. (d,e) Quantification of ecdysone (d) and JH (e) in H. armigera fed on different diets. ns, p > 0.05; **, p < 0.01; ***, p < 0.001. p < 0.05 indicated the significant difference (Student's t-test). Each experiment was performed in three replicates, and data are shown as mean ± s.e.m.
Figure 5.
Figure 5.
Analysis of expression pattern of miR-2055. (a) Sequence alignment of miR-2055 and the predicted target site in the 3′UTR of FAS. miR-2055, the mature sequence of miR-2055; FAS_WT, the predicted target site in the 3′UTR of FAS; FAS_MT, mutated target site; seed, the seed sequence in the target site. (b) Relative luminescence activity in S2 cells transfected with different vectors. 2055 + WT, cells co-transfected with recombinant pAc5.1/V5-His B overexpressing miR-2055 and recombinant psiCHECK inserted with wild-type sequence of FAS 3′UTR; 2055 + MT, cells co-transfected with recombinant pAc5.1/V5-His B overexpressing miR-2055 and recombinant psiCHECK inserted with site mutated sequence of FAS 3′UTR; CK + WT, cells co-transfected with pAc5.1/V5-His B empty vector and recombinant psiCHECK inserted with wild-type sequence of FAS 3′UTR. Each experiment was performed in four replicates. (c,d) Expression analysis of miR-2055 (c) and FAS (d) in different concentrations of JH. (e) Expression analysis of miR-2055 in cell line transfected with different dsRNAs. Each experiment was performed in three replicates. Data were shown as mean ± s.e.m. n.s., p > 0.05; *, p < 0.05; ***, p < 0.001. p < 0.05 indicates significant difference.
Figure 6.
Figure 6.
Effects of miR-2055 agomir on lipid biosynthesis in H. armigera. Body weight change (a), expression analysis of FAS (b), relative TAG level (c), Nile red stain of lipid droplets (d), immunoblot analysis (e) and abundance of FFAs (f) in H. armigera after agomir injection. Agomir for negative control or miR-2055 was injected into the hemocoel of newly moulted third instar larvae, and fat body was dissected at 4 days post injection. ns, p > 0.05; *, p < 0.05; **, p < 0.01; ***, p < 0.001; scale bar, 20 µm. Polyclonal antibody against FAS (1 : 8000) was used to detect the target protein (upper). GAPDH was set as the internal reference (1 : 5000, bottom). C16 : 1, 9-hexadecenoic acid; C16 : 0, hexadecanoic acid; C18 : 2, 9,12-octadecadienoic acid; C18 : 1, 11-octadecenoic acid; C18 : 0, octadecanoic acid. Experiments of RT-qPCR and TAG assay were performed in three replicates (mean ± SEM), while the experiment of FFA determination was performed in six replicates. p < 0.05 indicated the significant difference.

Similar articles

Cited by

References

    1. Heier C, Kuhnlein RP. 2018. Triacylglycerol metabolism in Drosophila melanogaster. Genetics 210, 1163-1184. (10.1534/genetics.118.301583) - DOI - PMC - PubMed
    1. Gronke S, Mildner A, Fellert S, Tennagels N, Petry S, Muller G, Jackle H, Kuhnlein RP. 2005. Brummer lipase is an evolutionary conserved fat storage regulator in Drosophila. Cell Metab. 1, 323-330. (10.1016/j.cmet.2005.04.003) - DOI - PubMed
    1. Bi J, Xiang Y, Chen H, Liu Z, Gronke S, Kuhnlein RP, Huang X. 2012. Opposite and redundant roles of the two Drosophila perilipins in lipid mobilization. J. Cell Sci. 125, 3568-3577. (10.1242/jcs.101329) - DOI - PubMed
    1. Beller M, Bulankina AV, Hsiao HH, Urlaub H, Jackle H, Kuhnlein RP. 2010. PERILIPIN-dependent control of lipid droplet structure and fat storage in Drosophila. Cell Metab. 12, 521-532. (10.1016/j.cmet.2010.10.001) - DOI - PubMed
    1. Choi S, Lim DS, Chung J. 2015. Feeding and fasting signals converge on the LKB1-SIK3 pathway to regulate lipid metabolism in Drosophila. PLoS Genet. 11, e1005263. (10.1371/journal.pgen.1005263) - DOI - PMC - PubMed

Publication types