. 2022 Mar 1;23(1):66.
doi: 10.1186/s13059-022-02635-9.

Insight into the ecology of vaginal bacteria through integrative analyses of metagenomic and metatranscriptomic data

Affiliations

Insight into the ecology of vaginal bacteria through integrative analyses of metagenomic and metatranscriptomic data

Michael T France et al. Genome Biol. .

Abstract

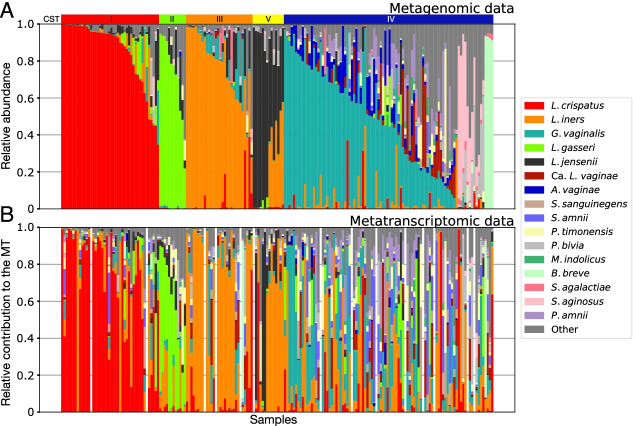
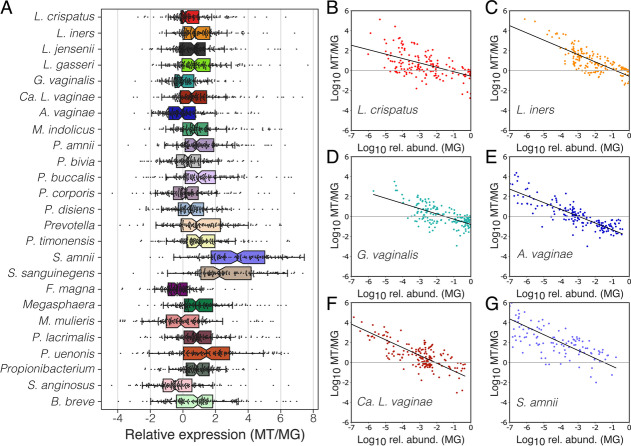
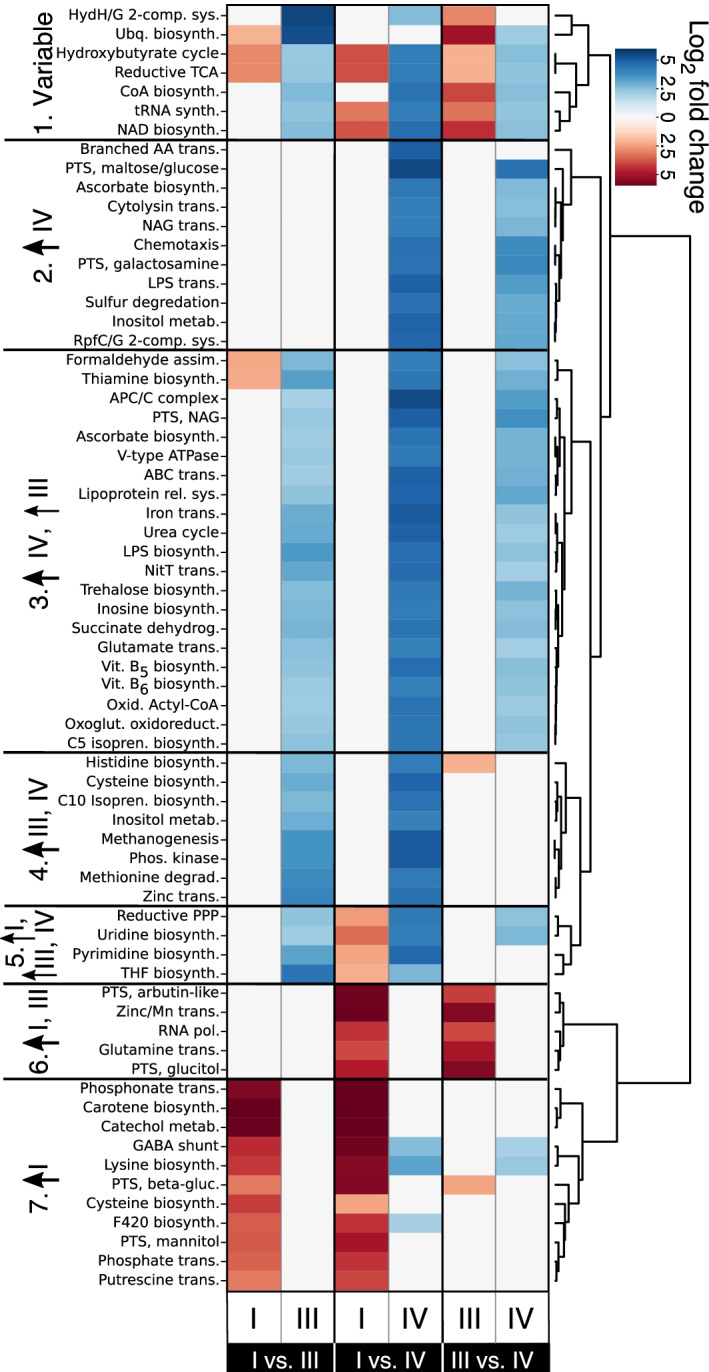
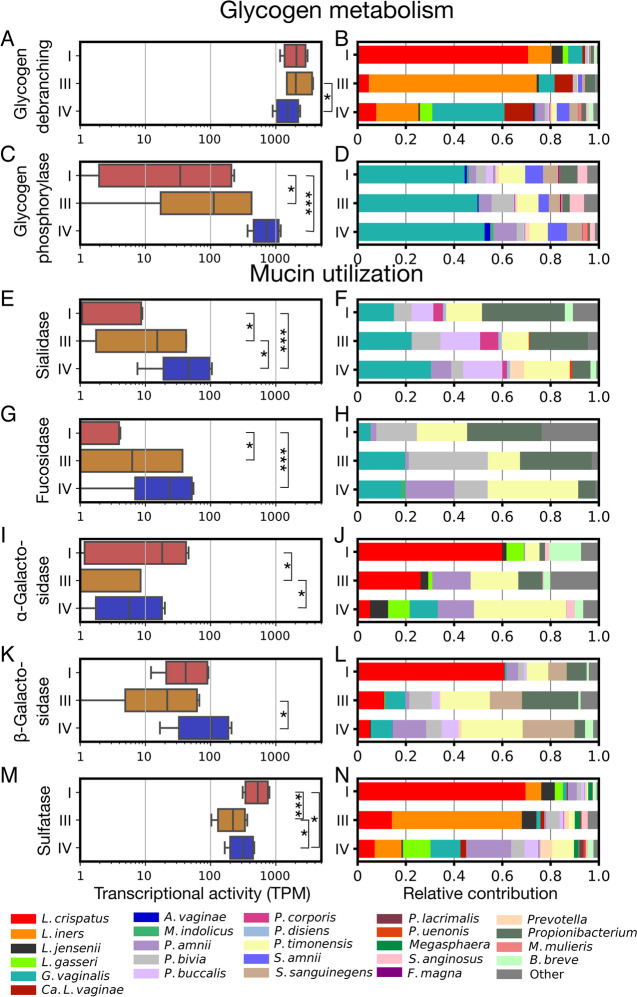
Background: Vaginal bacterial communities dominated by Lactobacillus species are associated with a reduced risk of various adverse health outcomes. However, somewhat unexpectedly, many healthy women have microbiota that are not dominated by lactobacilli. To determine the factors that drive vaginal community composition we characterized the genetic composition and transcriptional activities of vaginal microbiota in healthy women.

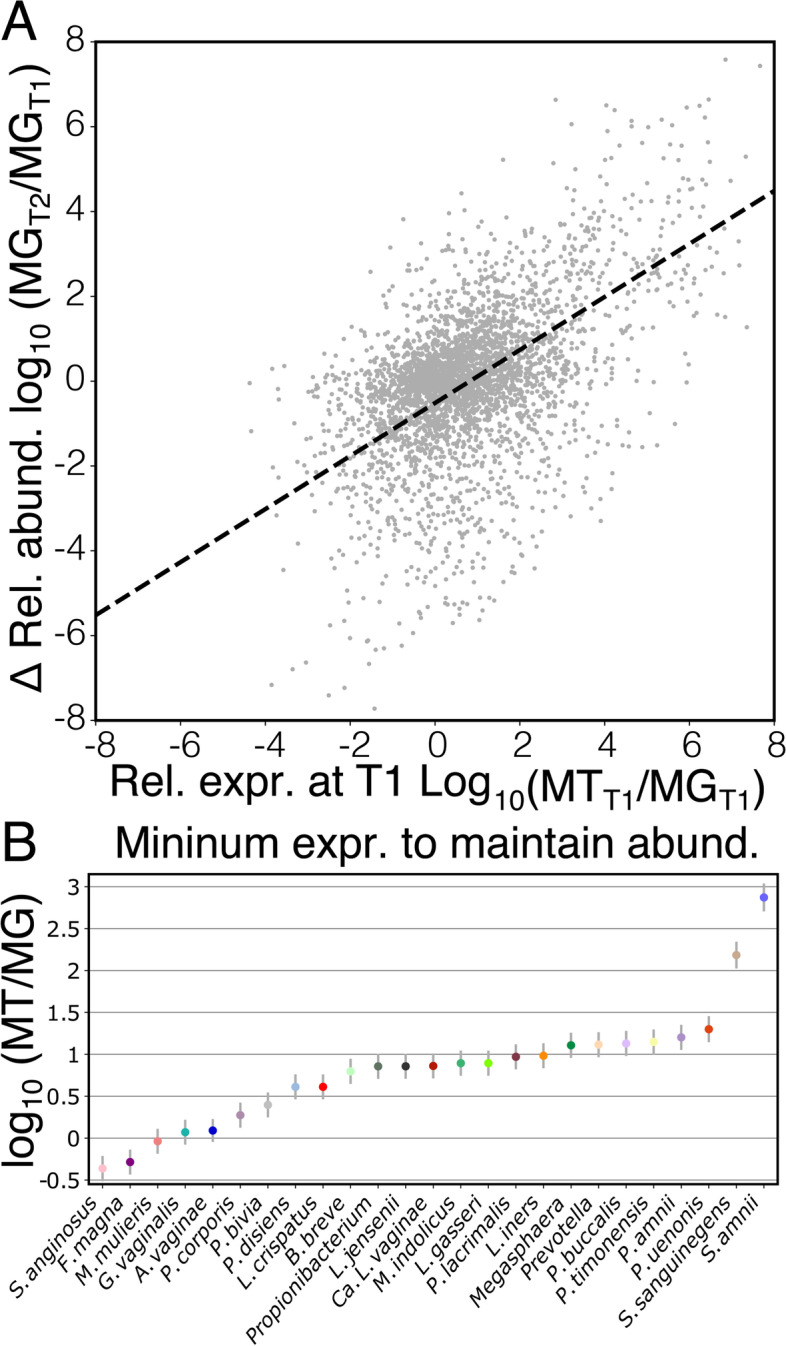
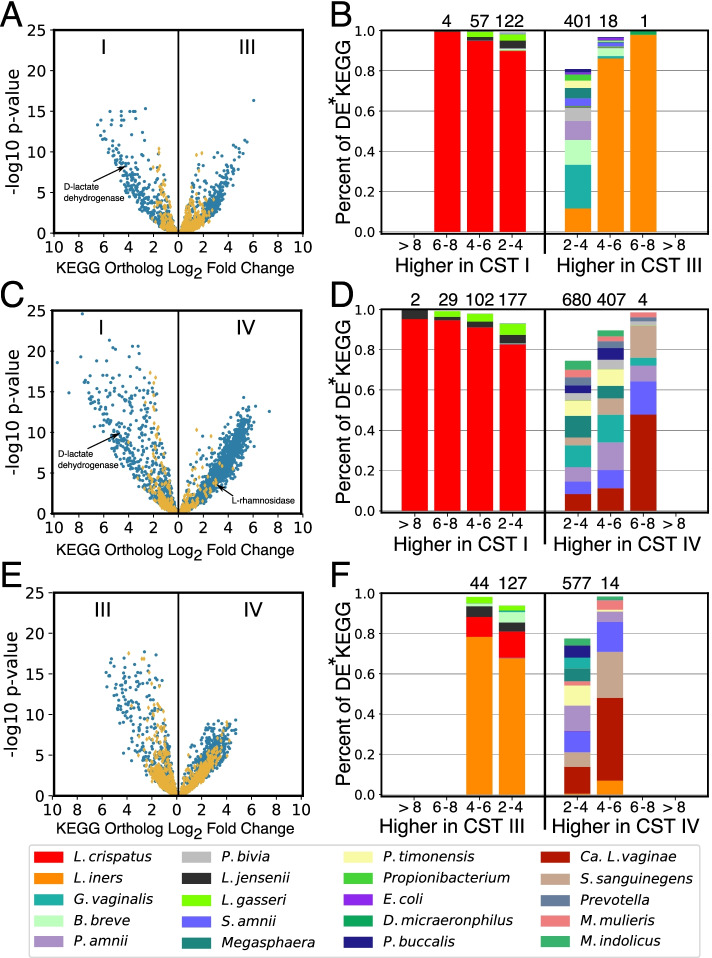
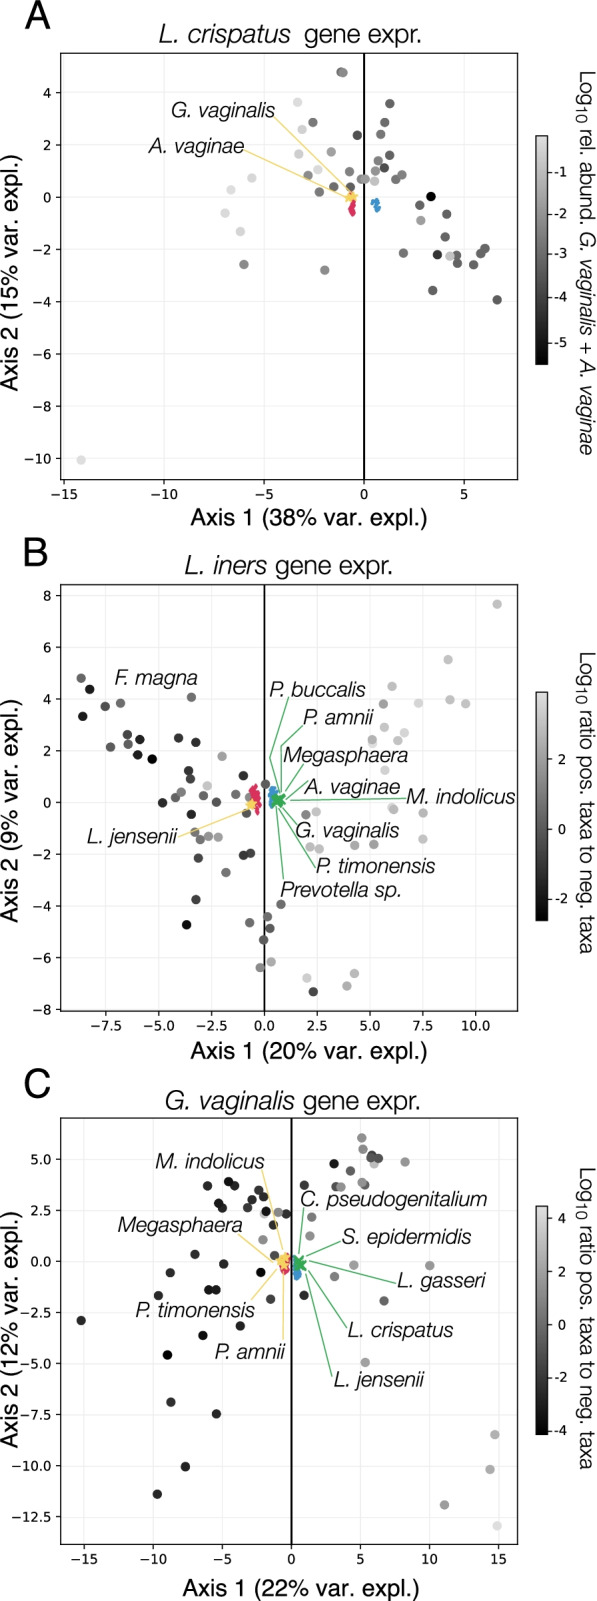
Results: We demonstrate that the abundance of a species is not always indicative of its transcriptional activity and that impending changes in community composition can be predicted from metatranscriptomic data. Functional comparisons highlight differences in the metabolic activities of these communities, notably in their degradation of host produced mucin but not glycogen. Degradation of mucin by communities not dominated by Lactobacillus may play a role in their association with adverse health outcomes. Finally, we show that the transcriptional activities of L. crispatus, L. iners, and Gardnerella vaginalis vary with the taxonomic composition of the communities in which they reside. Notably, L. iners and G. vaginalis both demonstrate lower expression of their cholesterol-dependent cytolysins when co-resident with Lactobacillus spp. and higher expression when co-resident with other facultative and obligate anaerobes. The pathogenic potential of these species may depend on the communities in which they reside and thus could be modulated by interventional strategies.

Conclusions: Our results provide insight to the functional ecology of the vaginal microbiota, demonstrate the diagnostic potential of metatranscriptomic data, and reveal strategies for the management of these ecosystems.

Keywords: Host-microbe interactions; Metagenome; Metatranscriptome; Microbial ecology; Vaginal microbiome.


Conflict of interest statement

J.R. is a cofounder of LUCA Biologics, a biotechnology company focusing on translating microbiome research into live biotherapeutic drugs for women’s health. The other authors declare that they have no competing interests.

Figures

Fig. 1
Fig. 1
Taxonomic composition of the vaginal microbiota of 39 women at up to five timepoints as assessed by shotgun metagenomics (n=194, A). Relative contribution of each species to the metatranscriptome of the corresponding samples (n=180, B). Both estimates were derived using VIRGO mapping results and were corrected for gene length. Samples were sorted in the same order in the two datasets. Gaps indicate the fourteen samples for which no corresponding metatranscriptomic data were available. Communities were assigned to CSTs based on their taxonomic composition using VALENCIA [9] according to the following scheme: CST I–L. crispatus dominated, CST II–L. gasseri dominated, CST III–L. iners dominated, and CST V–L. jensenii dominated) and CST IV. Separate plots that display the longitudinal data series for each individual subject can be found in Supplementary File 1
Fig. 2
Fig. 2
The contribution of a species to the metatranscriptome does not always match its relative abundance. Relative gene expression in the 25 most abundant species in vaginal communities was calculated by dividing a species contribution to the metatranscriptome by its relative abundance in the metagenome (A). Relationship between a species’ relative expression and its relative abundance in a community (BG, Supplementary File 2: Supplementary Fig. 1)
Fig. 3
Fig. 3
A taxon’s relative gene expression is predictive of its change in relative abundance. Log10 fold change in the relative abundance of a species from one timepoint (T1) to the next (T2) as a function of its relative expression at T1 (A). Species-specific intercepts from this model represent the minimum relative expression required for a species to maintain its relative abundance from T1 to T2 (B)
Fig. 4
Fig. 4
Functional differences in the transcriptional activity of CST and associated taxonomic drivers. Volcano plots displaying log2 fold change differences in the expression of KEGG orthologs between communities assigned to different community state types (A, C, and E). Points in blue represent KEGG orthologs which were identified as differentially expressed and differentially abundant. Points in yellow represent KEGG orthologs that were found to be differentially expressed but not differentially abundant. In B, D, and F, the taxa responsible for the expression of these KEGG orthologs are displayed. For each fold change category, the relative contribution of each taxon is displayed, averaged across all of the KEGG orthologs in that category. Numbers above the bars indicate the number of differentially expressed KEGG orthologs in the category. *DE, differentially expressed
Fig. 5
Fig. 5
CST associated differences in the expression of KEGG modules. Differentially expressed KEGG orthologs were mapped to KEGG modules (represent metabolic functions). The heatmap displays the average log2 fold change values for KEGG modules that demonstrated at least a fourfold difference in one of three comparisons (CST I versus CST III; CST I versus CST IV, or CST III versus CST IV). Two columns are plotted for each of the three comparisons, with each representing KEGG modules whose orthologs demonstrated higher expression in the specified CST. Some KEGG modules included KEGG orthologs that had higher expression in each of the compared CSTs. Hierarchical clustering was performed on the fold change values using Euclidean distance and Ward linkage to separate the modules into seven categories
Fig. 6
Fig. 6
Expression of mucin but not glycogen degradation-related genes varied by CST. Differences in the expression of key functions related to the metabolism of glycogen and mucin, two abundant host-derived resources in the vagina. Plots on the left (A, C, E, G, I, K, and M) display the combined transcription of the specified enzymes in log10 transformed transcripts per million (TPM). For each enzyme class, a linear mixed model was used to test for significant differences in its gene expression between CST, with subject included as a random factor. Brackets represent significant post hoc comparisons derived from these models. Plots on the right (B, D, F, H, J, L, and N) display the average relative contribution of various taxa to the transcription of these genes by members of each CST. Longitudinal representations of the expression levels of each enzyme class, for each subject, can be found in Supplementary File 2: Supplementary Fig. 2. *p<0.05; **p<0.01; ***p<0.001
Fig. 7
Fig. 7
Community composition modulates species’ gene expression. Principal component biplots of the VOGs and taxa were identified as correlated by sparse canonical correlation analysis (sCCA). The analysis was conducted on the transcriptional activity of the three most prevalent species: L. crispatus (A), L. iners (B), and G. vaginalis (C). The large circular points in each plot represent the samples. In A, these points are colored according to the combined log10 relative abundance the two negatively contributing taxa (A. vaginae and G. vaginalis). In B and C, these points are colored according to the ratio of the combined relative abundances of taxa that contribute either positively or negatively to the correlation. Factor loadings of the genes (positive, blue; negative, magenta) and taxa (positive, green; negative, gold) are included in the plot. For legibility, the labels for the taxa loadings, but not the VOG loadings are displayed

References

    1. Cho I, Blaser MJ. The human microbiome: at the interface of health and disease. Nat Rev Genet. 2012;13(4):260–270. - PMC - PubMed
    1. Human Microbiome Project C Structure, function and diversity of the healthy human microbiome. Nature. 2012;486(7402):207–214. - PMC - PubMed
    1. Pflughoeft KJ, Versalovic J. Human microbiome in health and disease. Annual Review of Pathology: Mechanisms of Disease: Annual Reviews. 2012. pp. 99–122. - PubMed
    1. Miller EA, Beasley DE, Dunn RR, Archie EA. Lactobacilli dominance and vaginal pH: why is the human vaginal microbiome unique? Front Microbiol. 2016;7:1936. - PMC - PubMed
    1. Ma B, Forney LJ, Ravel J. Vaginal microbiome: rethinking health and disease. Annual review of microbiology. 2012. pp. 371–389. - PMC - PubMed

Publication types

LinkOut - more resources