

Principles of Tracer Kinetic Analysis in Oncology, Part I: Principles and Overview of Methodology
- PMID: 35232879
- PMCID: PMC8978199
- DOI: 10.2967/jnumed.121.263518
Principles of Tracer Kinetic Analysis in Oncology, Part I: Principles and Overview of Methodology
Abstract
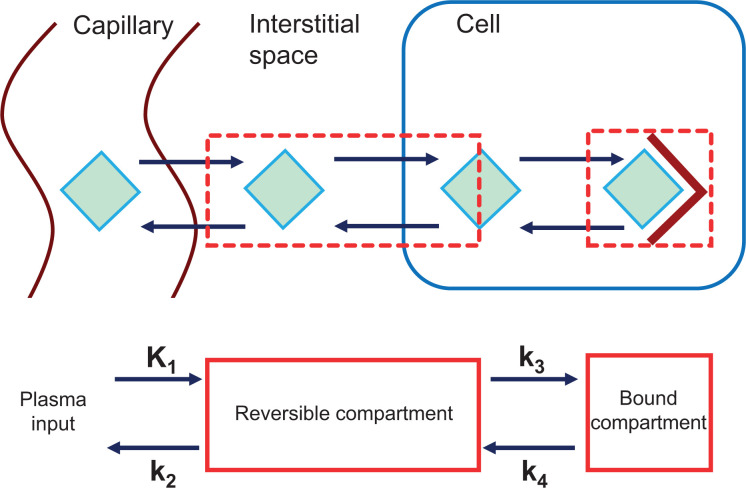
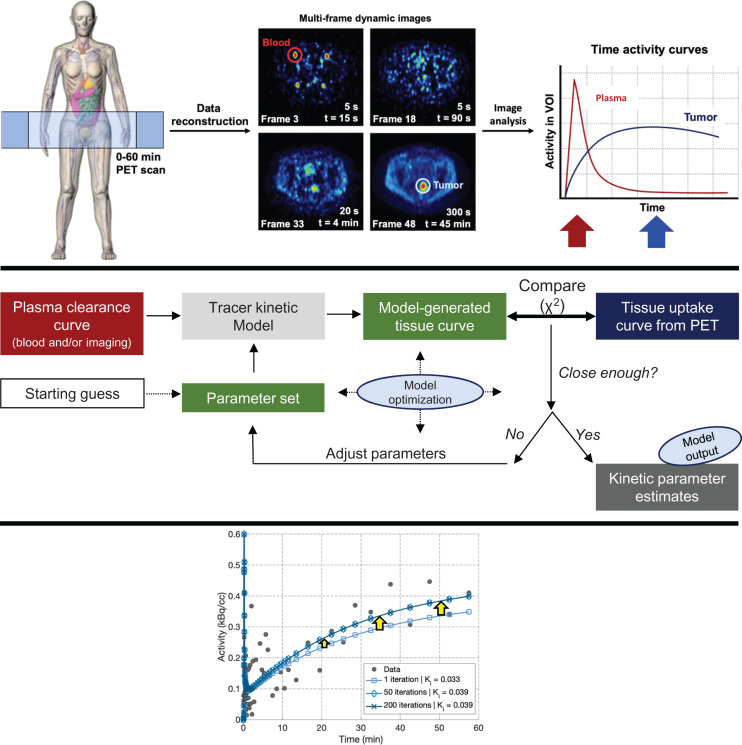
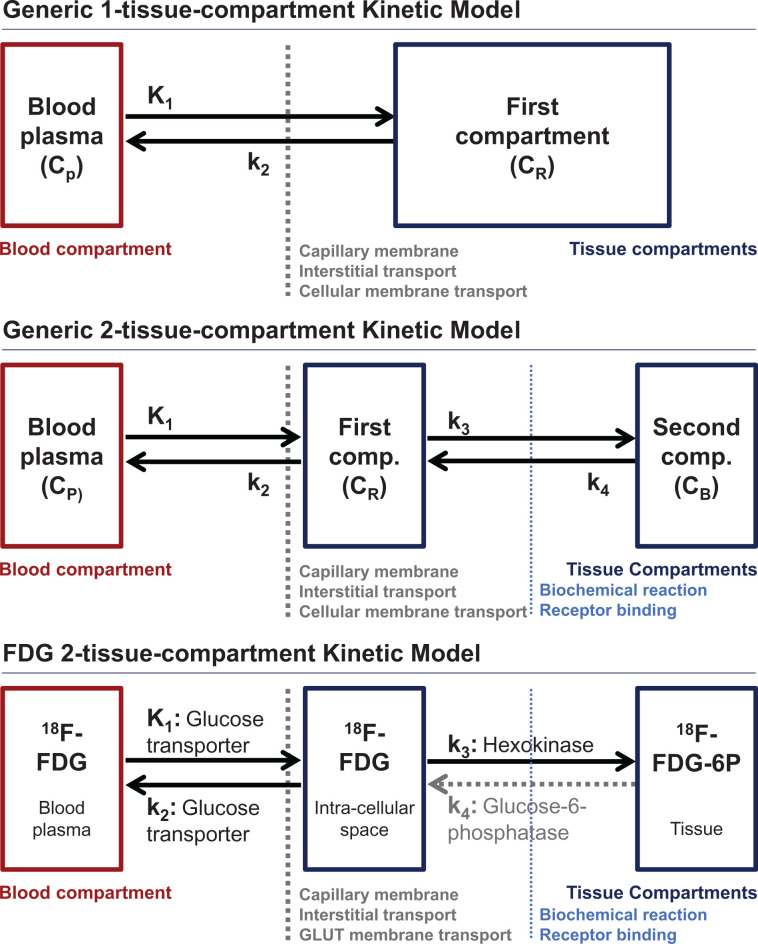
Learning Objectives: On successful completion of this activity, participants should be able to describe (1) describe principles of PET tracer kinetic analysis for oncologic applications; (2) list methods used for PET kinetic analysis for oncology; and (3) discuss application of kinetic modeling for cancer-specific diagnostic needs.Financial Disclosure: This work was supported by KL2 TR001879, R01 CA211337, R01 CA113941, R33 CA225310, Komen SAC130060, R50 CA211270, and K01 DA040023. Dr. Pantel is a consultant or advisor for Progenics and Blue Earth Diagnostics and is a meeting participant or lecturer for Blue Earth Diagnostics. Dr. Mankoff is on the scientific advisory boards of GE Healthcare, Philips Healthcare, Reflexion, and ImaginAb and is the owner of Trevarx; his wife is the chief executive officer of Trevarx. The authors of this article have indicated no other relevant relationships that could be perceived as a real or apparent conflict of interest.CME Credit: SNMMI is accredited by the Accreditation Council for Continuing Medical Education (ACCME) to sponsor continuing education for physicians. SNMMI designates each JNM continuing education article for a maximum of 2.0 AMA PRA Category 1 Credits. Physicians should claim only credit commensurate with the extent of their participation in the activity. For CE credit, SAM, and other credit types, participants can access this activity through the SNMMI website (http://www.snmmilearningcenter.org) through March 2025PET enables noninvasive imaging of regional in vivo cancer biology. By engineering a radiotracer to target specific biologic processes of relevance to cancer (e.g., cancer metabolism, blood flow, proliferation, and tumor receptor expression or ligand binding), PET can detect cancer spread, characterize the cancer phenotype, and assess its response to treatment. For example, imaging of glucose metabolism using the radiolabeled glucose analog 18F-FDG has widespread applications to all 3 of these tasks and plays an important role in cancer care. However, the current clinical practice of imaging at a single time point remote from tracer injection (i.e., static imaging) does not use all the information that PET cancer imaging can provide, especially to address questions beyond cancer detection. Reliance on tracer measures obtained only from static imaging may also lead to misleading results. In this 2-part continuing education paper, we describe the principles of tracer kinetic analysis for oncologic PET (part 1), followed by examples of specific implementations of kinetic analysis for cancer PET imaging that highlight the added benefits over static imaging (part 2). This review is designed to introduce nuclear medicine clinicians to basic concepts of kinetic analysis in oncologic imaging, with a goal of illustrating how kinetic analysis can augment our understanding of in vivo cancer biology, improve our approach to clinical decision making, and guide the interpretation of quantitative measures derived from static images.
Keywords: PET/CT; dynamic imaging; kinetic analysis.
© 2022 by the Society of Nuclear Medicine and Molecular Imaging.
Figures
References
-
- Mankoff DA, Eary JF, Link JM, et al. Tumor-specific positron emission tomography imaging in patients: [18F] fluorodeoxyglucose and beyond. Clin Cancer Res. 2007;13:3460–3469. - PubMed
-
- Lammertsma AA. Forward to the past: the case for quantitative PET imaging. J Nucl Med. 2017;58:1019–1024. - PubMed
-
- Carson RE. Tracer kinetic modeling in PET. In: Bailey DL, Townsend DW, Valk PE, Maisey MN, eds. Positron Emission Tomography. Springer; 2005:127–159.
Publication types
MeSH terms
Grants and funding
LinkOut - more resources
Full Text Sources
Research Materials