. 2022 Mar 1;13(1):1097.
doi: 10.1038/s41467-022-28748-0.

Tree functional traits, forest biomass, and tree species diversity interact with site properties to drive forest soil carbon

Affiliations

Tree functional traits, forest biomass, and tree species diversity interact with site properties to drive forest soil carbon

Laurent Augusto et al. Nat Commun. .

Abstract

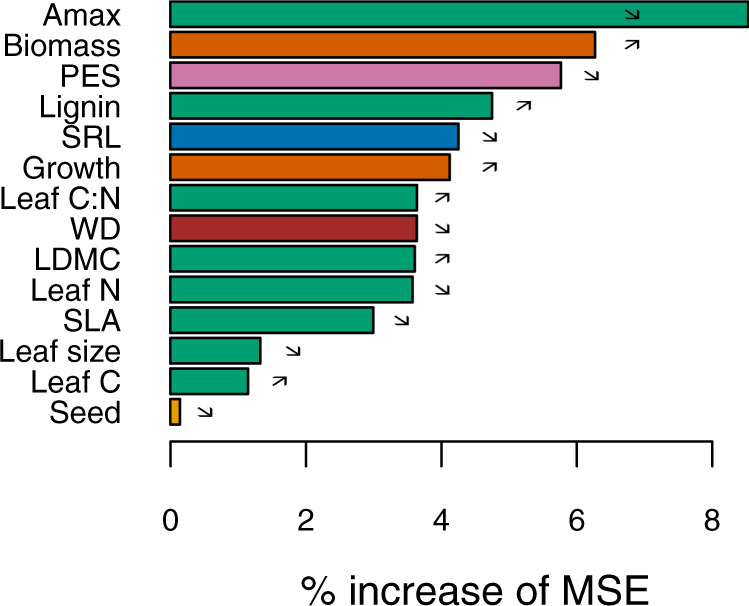
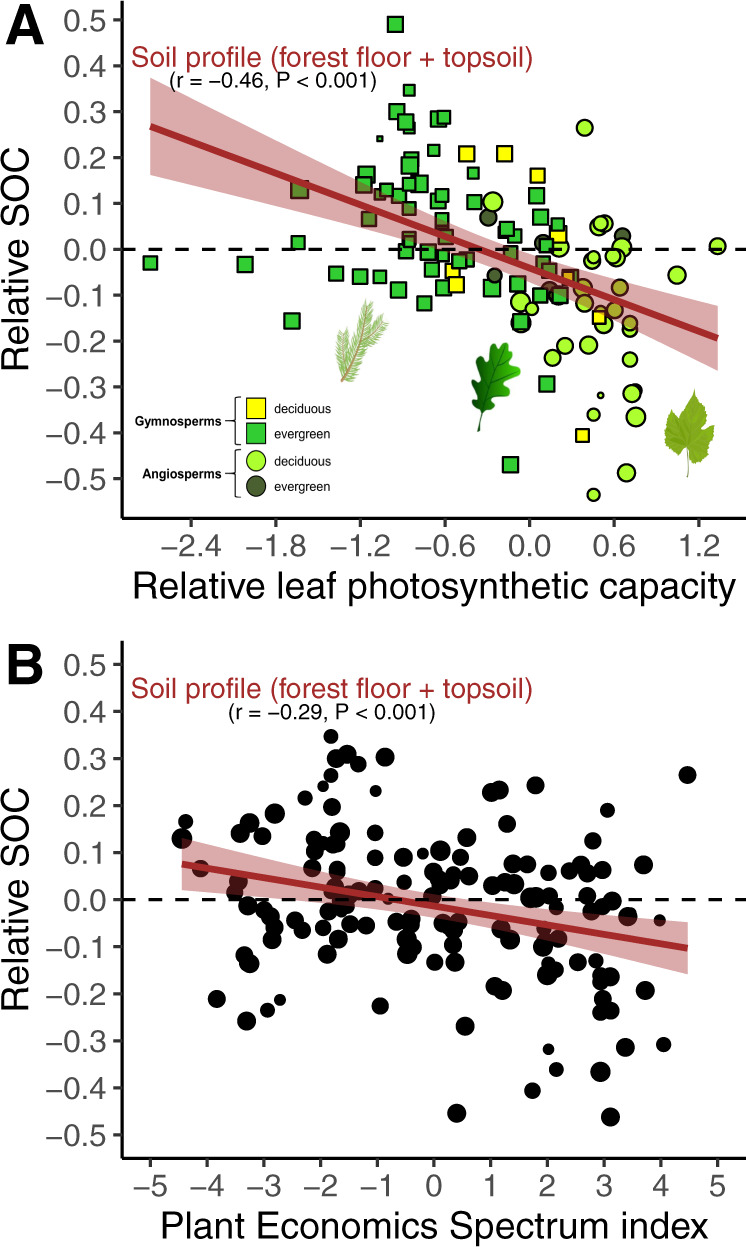
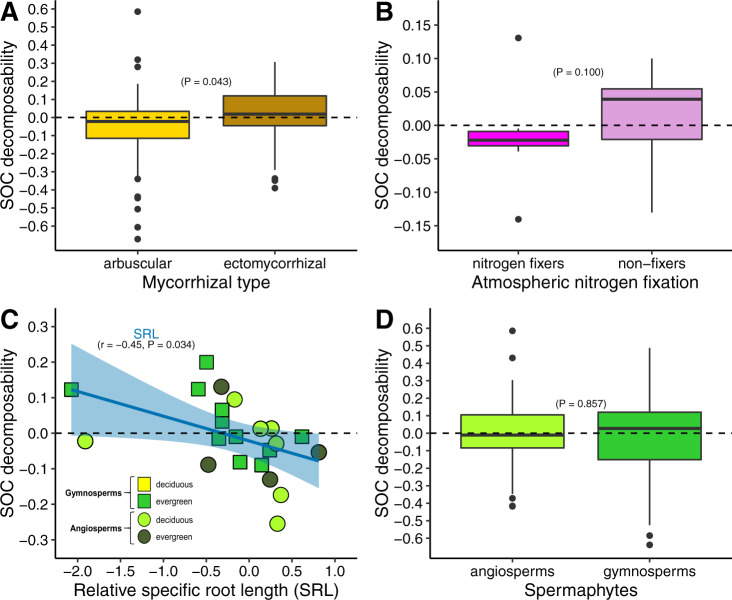
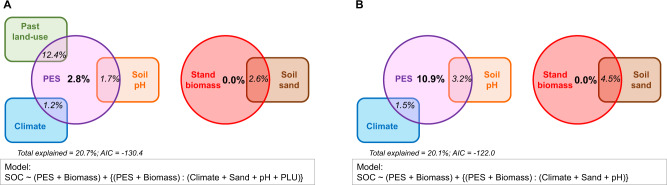
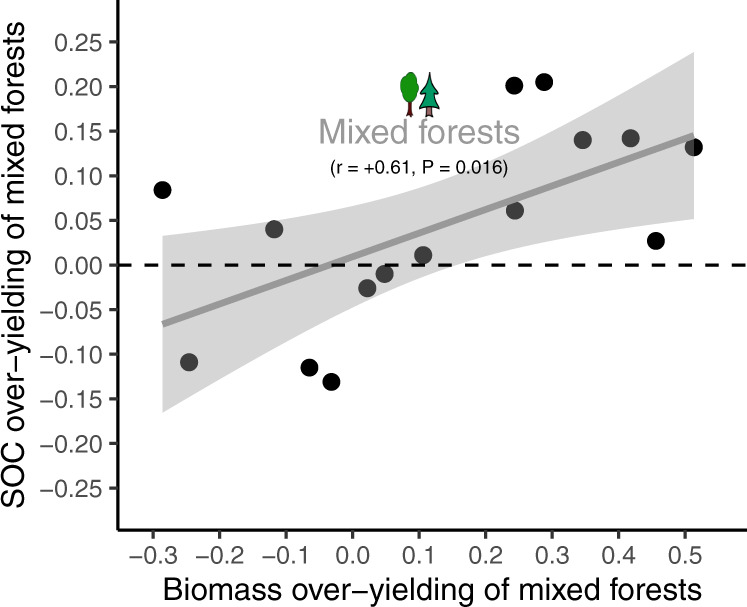
Forests constitute important ecosystems in the global carbon cycle. However, how trees and environmental conditions interact to determine the amount of organic carbon stored in forest soils is a hotly debated subject. In particular, how tree species influence soil organic carbon (SOC) remains unclear. Based on a global compilation of data, we show that functional traits of trees and forest standing biomass explain half of the local variability in forest SOC. The effects of functional traits on SOC depended on the climatic and soil conditions with the strongest effect observed under boreal climate and on acidic, poor, coarse-textured soils. Mixing tree species in forests also favours the storage of SOC, provided that a biomass over-yielding occurs in mixed forests. We propose that the forest carbon sink can be optimised by (i) increasing standing biomass, (ii) increasing forest species richness, and (iii) choosing forest composition based on tree functional traits according to the local conditions.


Conflict of interest statement

The authors declare no competing interests.

Figures

Fig. 1
Fig. 1. Main variables explaining the SOC pools at the local scale.
The SOC pool was modelled using relative values, normalised to site conditions. The predictors were: (i) leaf traits, in green: maximum photosynthetic capacity (Amax), C content, N content, C:N ratio, lignin content, leaf dry matter content (LDMC), leaf size and specific leaf area (SLA); (ii) other plant traits [seed mass (in yellow), wood density (WD; in brown), specific root length (SRL; in blue)]; (iii) the index score of the Plant Economics Spectrum (PES; in violet); and (iv) stand biomass dynamics, in dark orange (standing biomass; tree species growth). The influence of the variables was assessed using the percentage of increase of MSE from the Random Forest approach (see “Methods”). Arrows indicate positive (↗) or negative (↘) effects of the predictors on SOC. Source data are provided as a Source Data files.
Fig. 2
Fig. 2. Global influence of plant functional traits on SOC pool.
Relationship between photosynthetic capacity of tree species (Amax) and SOC pool (A); relationship between the index score of the Plant Economics Spectrum (PES) and SOC pool (B). Values are normalised and the symbol size is proportional to data reliability (see “Methods”), which was taken into account as a weighting factor in the regression. A linear regression was fitted (level of confidence of the error band = 0.95). Source data are provided as a Source Data files.
Fig. 3
Fig. 3. SOC decomposability as a function of plant functional types and specific root length.
The values show the SOC decomposability, which is the opposite of SOC stability. Values are normalised (see “Methods”). Number of values: n = 49 & 52 (arbuscular versus ectomycorrhizal), n = 8 & 14 (fixers versus non-fixers), n = 28 & 31 (angiosperms versus gymnosperms). A, B, D: boxplots represent the median, the first and third quartiles, and 1.5× the inter-quartile range; significant differences tested with pairwise t test or Wilcoxon test (two-sided), depending on data structure. C a linear regression was fitted (level of confidence of the error band = 0.95). Source data are provided as a Source Data files.
Fig. 4
Fig. 4. Modulation of the imprint of tree species on SOC by site properties.
The Euler diagrams present the relative importance of factors (and some of their interactions) in explaining the SOC pool. The model used an integrative index of the Plant Economics Spectrum (PES) as predictor (see Methods), which enabled to include a large dataset of sites worldwide but at the expense of the level of variance explained (see Supplementary Table S2 for results with original values from a smaller set of sites). The model was run with (A), or without (B), the past land-use information (see Methods). PLU = past land-use (classed as “agriculture” or “forest”; see Supplementary Fig. S11).
Fig. 5
Fig. 5. Increase in SOC sequestration by forest production overyielding induced by tree species mixtures.
Values are indices of over-yielding due to tree species mixtures. Negative, zero, or positive values indicate that mixed forests performed worse, equally, or better on average than their respective mono-specific counterparts (i.e., the tree species that compose the mixture). All mixed forests are angiosperm-gymnosperm mixtures, excepted two cases (one angiosperm-angiosperm, one gymnosperm-gymnosperm, but of different tree species). The SOC pool considered is the whole soil profile (forest floor + topsoil). A linear regression was fitted (level of confidence of the error band = 0.95). Source data are provided as a Source Data files.

References

    1. Jackson RB, et al. The ecology of soil carbon: pools, vulnerabilities, and biotic and abiotic controls. Annu. Rev. Ecol. Evol. Syst. 2017;48:419–445.
    1. Pan YD, et al. A large and persistent carbon sink in the world’s forests. Science. 2011;333:988–993. - PubMed
    1. Mayer M, et al. Tamm Review: Influence of forest management activities on soil organic carbon stocks: A knowledge synthesis. Ecol. Manag. 2020;466:118127.
    1. Nabuurs G-J, et al. First signs of carbon sink saturation in European forest biomass. Nat. Clim. Chang. 2013;3:792–796.
    1. Lal R. Forest soils and carbon sequestration. Ecol. Manag. 2005;220:242–258.

Publication types