

Genomic survey of edible cockle (Cerastoderma edule) in the Northeast Atlantic: A baseline for sustainable management of its wild resources
- PMID: 35233247
- PMCID: PMC8867702
- DOI: 10.1111/eva.13340
Genomic survey of edible cockle (Cerastoderma edule) in the Northeast Atlantic: A baseline for sustainable management of its wild resources
Abstract
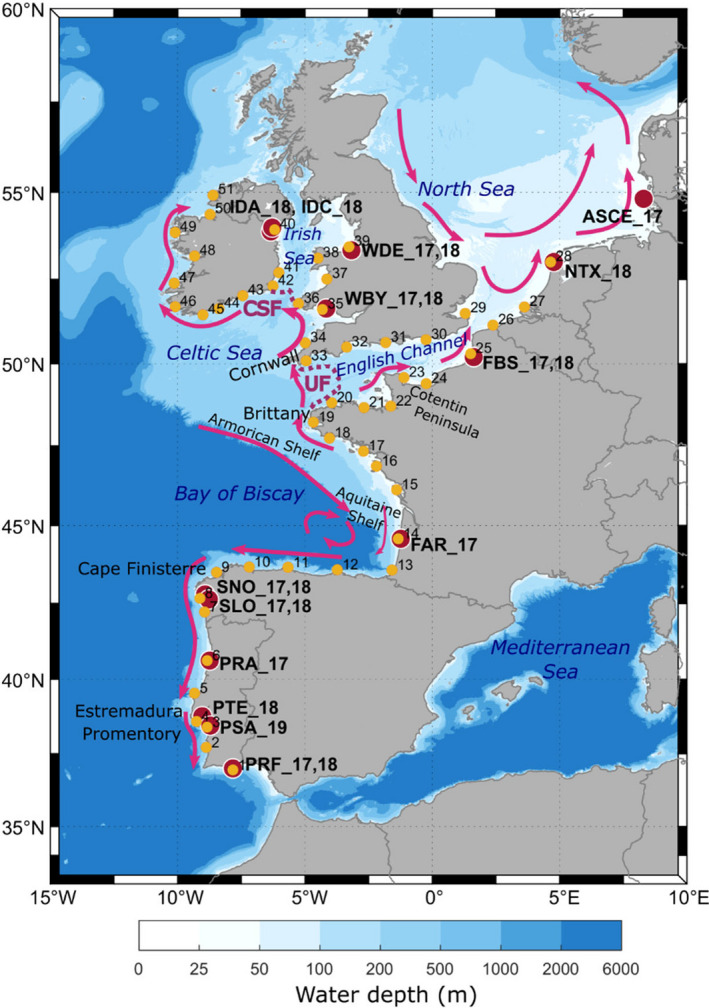
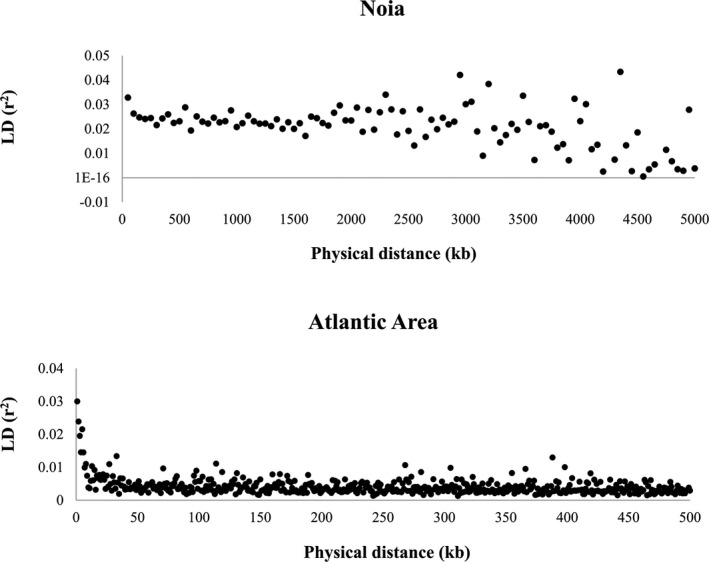
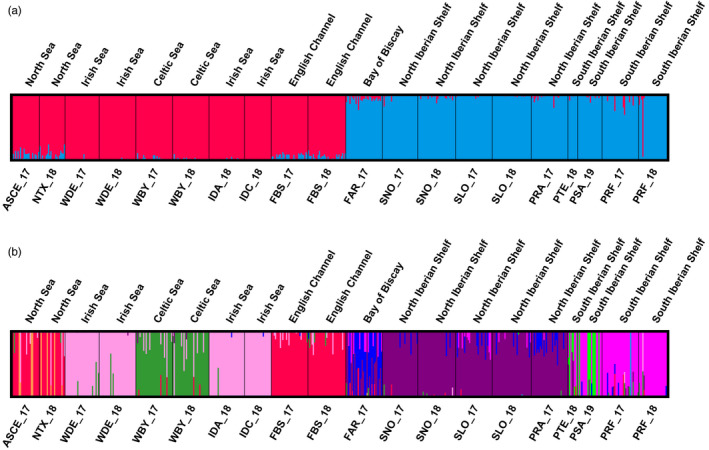
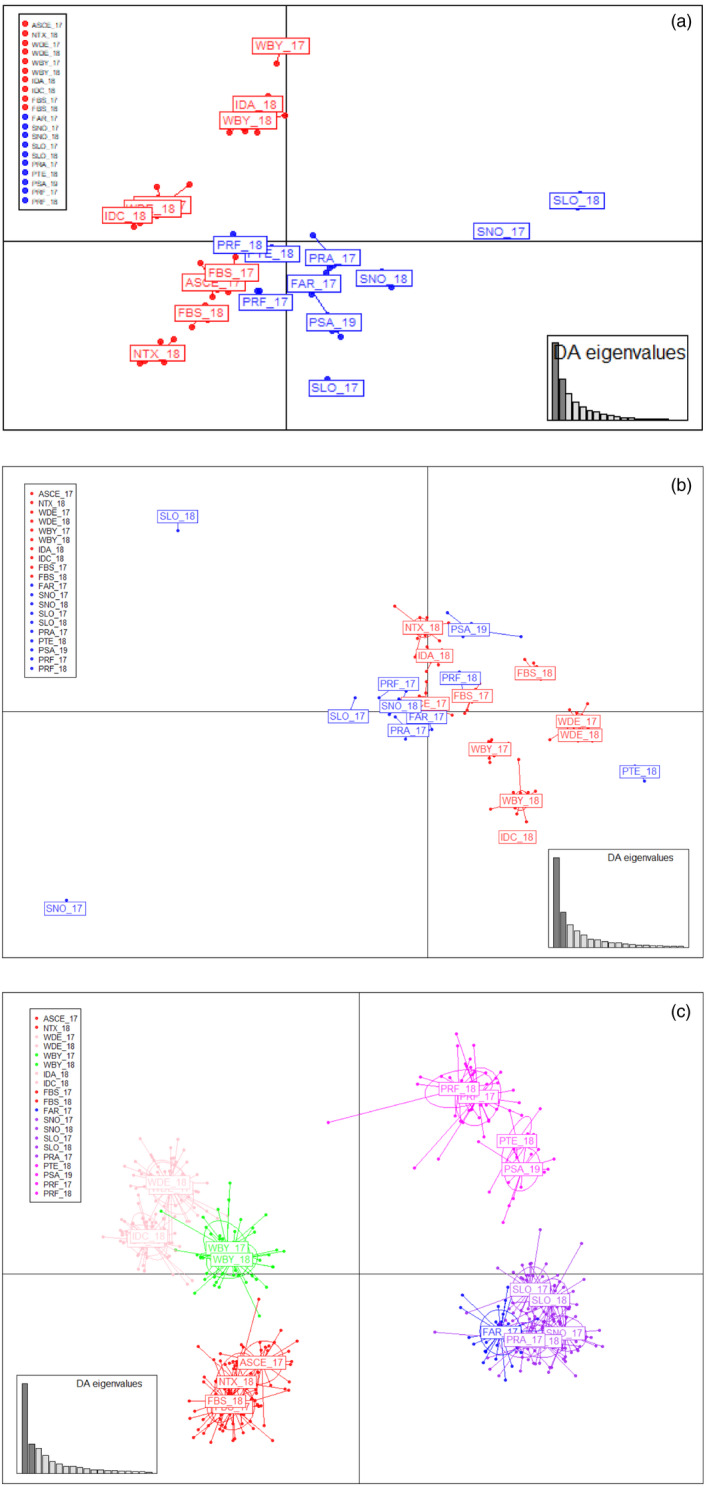
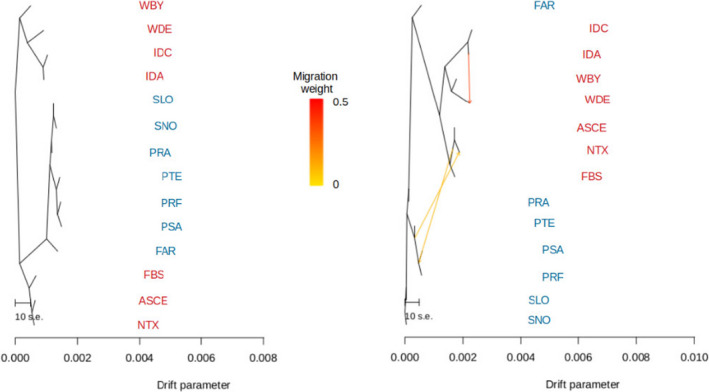
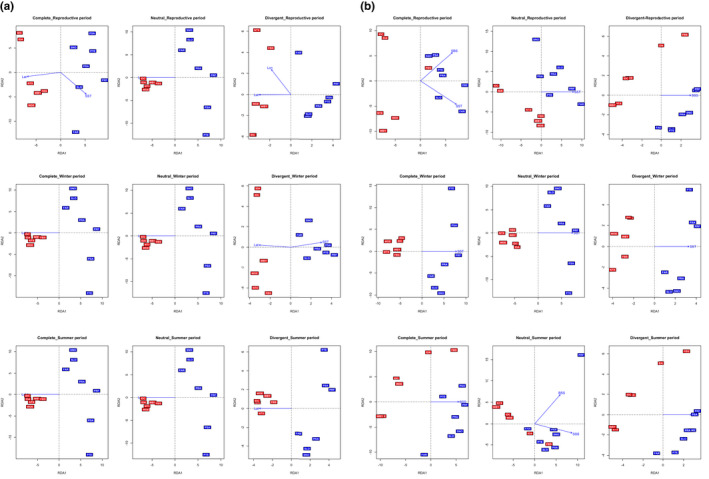
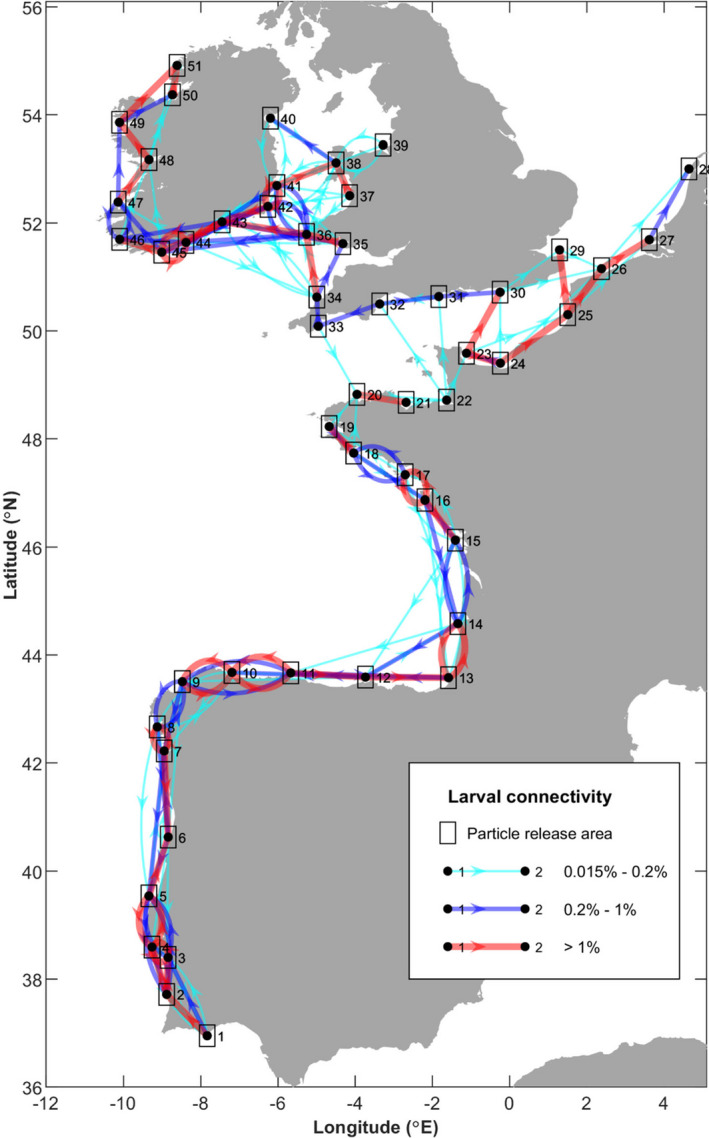
Knowledge on correlations between environmental factors and genome divergence between populations of marine species is crucial for sustainable management of fisheries and wild populations. The edible cockle (Cerastoderma edule) is a marine bivalve distributed along the Northeast Atlantic coast of Europe and is an important resource from both commercial and ecological perspectives. We performed a population genomics screening using 2b-RAD genotyping on 9309 SNPs localized in the cockle's genome on a sample of 536 specimens pertaining to 14 beds in the Northeast Atlantic Ocean to analyse the genetic structure with regard to environmental variables. Larval dispersal modelling considering species behaviour and interannual/interseasonal variation in ocean conditions was carried out as an essential background to which compare genetic information. Cockle populations in the Northeast Atlantic displayed low but significant geographical differentiation between populations (F ST = 0.0240; p < 0.001), albeit not across generations. We identified 742 and 36 outlier SNPs related to divergent and balancing selection in all the geographical scenarios inspected, and sea temperature and salinity were the main environmental correlates suggested. Highly significant linkage disequilibrium was detected at specific genomic regions against the very low values observed across the whole genome. Two main genetic groups were identified, northwards and southwards of French Brittany. Larval dispersal modelling suggested a barrier for larval dispersal linked to the Ushant front that could explain these two genetic clusters. Further genetic subdivision was observed using outlier loci and considering larval advection. The northern group was divided into the Irish/Celtic Seas and the English Channel/North Sea, while the southern group was divided into three subgroups. This information represents the baseline for the management of cockles, designing conservation strategies, founding broodstock for depleted beds and producing suitable seed for aquaculture production.
Keywords: 2b‐RAD; adaptive variation; fisheries management; genetic structure; larval dispersal modelling.
© 2021 The Authors. Evolutionary Applications published by John Wiley & Sons Ltd.
Conflict of interest statement
Authors have no conflict of interest to declare.
Figures
References
-
- Abaunza, P. , Murta, A. G. , Campbell, N. , Cimmaruta, R. , Comesana, A. S. , Dahle, G. G. , Santamaría, M. T. , Gordo, L. S. , Iversen, S. A. , MacKenzie, K. , Magoulas, A. , Mattiucci, S. , Molloy, J. , Nascetti, G. , Pinto, A. L. , Quinta, R. , Ramos, P. , Sanjuan, A. , Santos, A. T. , … Zimmermann, C. (2008). Stock identity of horse mackerel (Trachurus trachurus) in the Northeast Atlantic and Mediterranean Sea: Integrating the results from different stock identification approaches. Fisheries Research, 89, 196–209. 10.1016/j.fishres.2007.09.022 - DOI
-
- Beaumont, A. R. , Day, T. R. , & Gade, G. (1980). Genetic variation at the octopine dehydrogenase locus in the adductor muscle of Cerastoderma edule (L.) and six other bivalve species. Marine Biology Letters, 1, 137–148.
-
- Beaumont, M. A. , & Nichols, R. A. (1996). Evaluating loci for the use in the genetic analysis of population structure. Proceedings of the Royal Society, Series B: Biological Sciences, 263, 1619–1626.
-
- Bernatchez, L. , Wellenreuther, M. , Araneda, C. , Ashton, D. T. , Barth, J. M. I. , Beacham, T. D. , Maes, G. E. , Martinsohn, J. T. , Miller, K. M. , Naish, K. A. , Ovenden, J. R. , Primmer, C. R. , Suk, H. Y. , Therkildsen, N. O. , & Withler, R. E. (2017). Harnessing the power of genomics to secure the future of seafood. Trends in Ecology & Evolution, 32, 665–680. 10.1016/j.tree.2017.06.010 - DOI - PubMed
Associated data
LinkOut - more resources
Full Text Sources
