[Preprint]. 2022 Feb 24:rs.3.rs-1375091.
doi: 10.21203/rs.3.rs-1375091/v1.

Characterization and antiviral susceptibility of SARS-CoV-2 Omicron/BA.2

Affiliations

Characterization and antiviral susceptibility of SARS-CoV-2 Omicron/BA.2

Yoshihiro Kawaoka et al. Res Sq. .

Update in

  • Characterization and antiviral susceptibility of SARS-CoV-2 Omicron BA.2.
    Uraki R, Kiso M, Iida S, Imai M, Takashita E, Kuroda M, Halfmann PJ, Loeber S, Maemura T, Yamayoshi S, Fujisaki S, Wang Z, Ito M, Ujie M, Iwatsuki-Horimoto K, Furusawa Y, Wright R, Chong Z, Ozono S, Yasuhara A, Ueki H, Sakai-Tagawa Y, Li R, Liu Y, Larson D, Koga M, Tsutsumi T, Adachi E, Saito M, Yamamoto S, Hagihara M, Mitamura K, Sato T, Hojo M, Hattori SI, Maeda K, Valdez R; IASO study team; Okuda M, Murakami J, Duong C, Godbole S, Douek DC, Maeda K, Watanabe S, Gordon A, Ohmagari N, Yotsuyanagi H, Diamond MS, Hasegawa H, Mitsuya H, Suzuki T, Kawaoka Y. Uraki R, et al. Nature. 2022 Jul;607(7917):119-127. doi: 10.1038/s41586-022-04856-1. Epub 2022 May 16. Nature. 2022. PMID: 35576972 Free PMC article.

Abstract

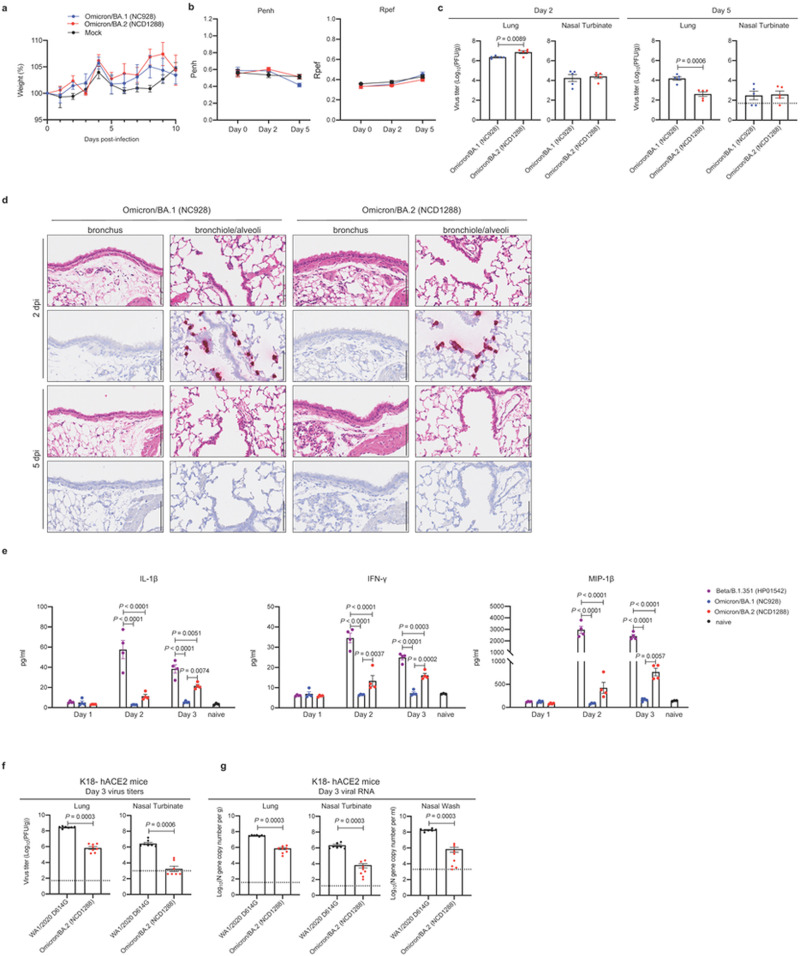
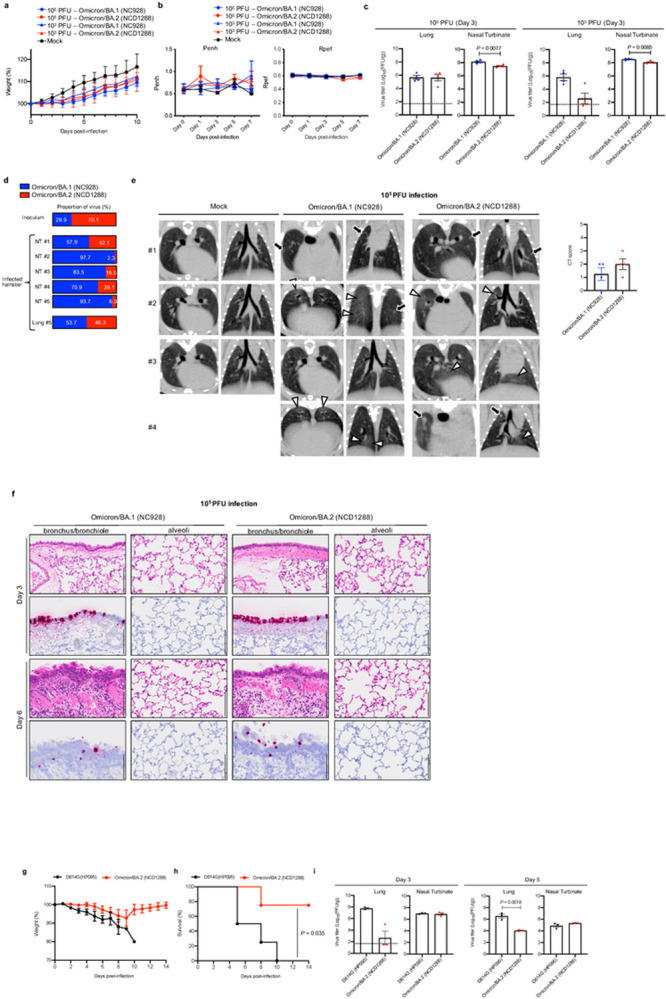
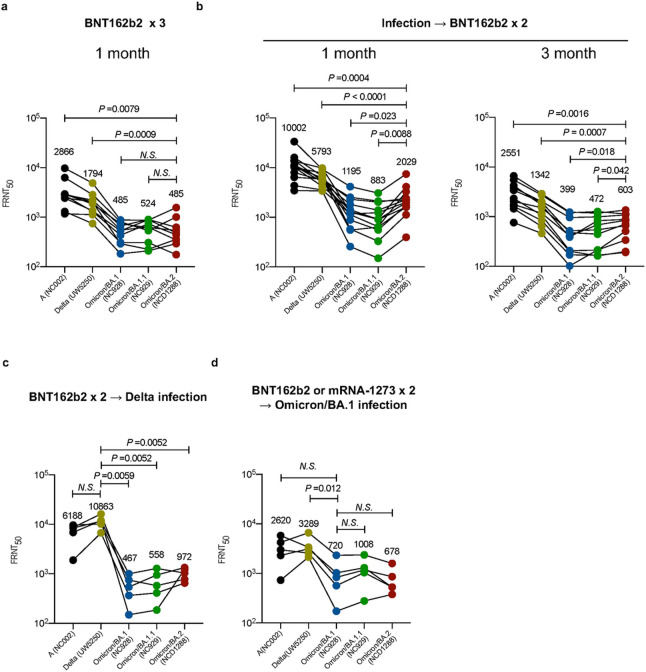
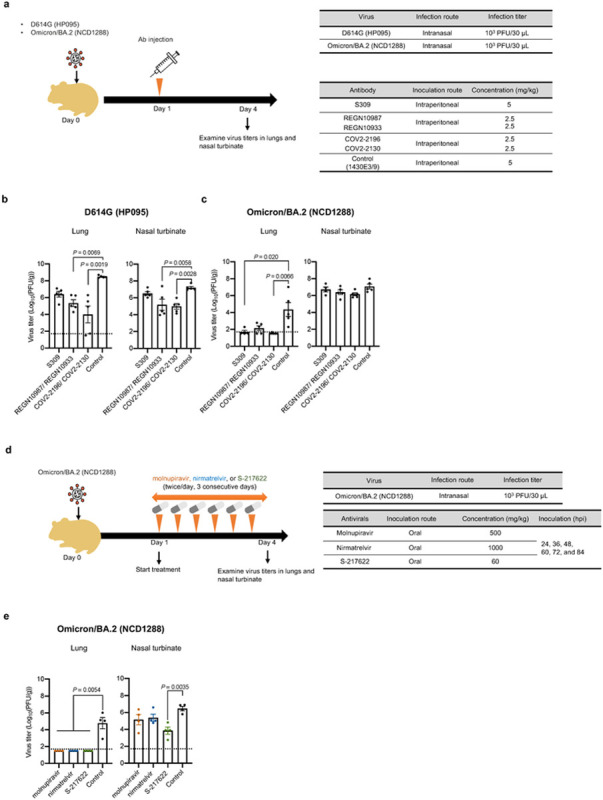
The recent emergence of SARS-CoV-2 Omicron variants possessing large numbers of mutations has raised concerns of decreased effectiveness of current vaccines, therapeutic monoclonal antibodies, and antiviral drugs for COVID-19 against these variants1,2. While the original Omicron lineage, BA.1, has become dominant in many countries, BA.2 has been detected in at least 67 countries and has become dominant in the Philippines, India, and Denmark. Here, we evaluated the replicative ability and pathogenicity of an authentic infectious BA.2 isolate in immunocompetent and human ACE2 (hACE2)-expressing mice and hamsters. In contrast to recent data with chimeric, recombinant SARS-CoV-2 strains expressing the spike proteins of BA.1 and BA.2 on an ancestral WK-521 backbone3, we observed similar infectivity and pathogenicity in mice and hamsters between BA.2 and BA.1, and less pathogenicity compared to early SARS-CoV-2 strains. We also observed a marked and significant reduction in the neutralizing activity of plasma from COVID-19 convalescent individuals and vaccine recipients against BA.2 compared to ancestral and Delta variant strains. In addition, we found that some therapeutic monoclonal antibodies (REGN10987/REGN10933, COV2-2196/COV2-2130, and S309) and antiviral drugs (molnupiravir, nirmatrelvir, and S-217622) can restrict viral infection in the respiratory organs of hamsters infected with BA.2. These findings suggest that the replication and pathogenicity of BA.2 is comparable to that of BA.1 in rodents and that several therapeutic monoclonal antibodies and antiviral compounds are effective against Omicron/BA.2 variants.


Figures

Figure 1
Figure 1. Omicron/BA.2 and Omicron/BA.1 show similar infectivity and pathogenicity in mice.
a–c, BALB/c mice were intranasally inoculated with 105 PFU in 50 μL of Omicron/BA.1 (NC928), Omicron/BA.2 (NCD1288), or PBS (mock). a, Body weight changes in BALB/c mice after viral infection. Body weights of virus-infected (n =5) and mock-infected mice (n =5) were monitored daily for 10 days. Data are presented as the mean percentages of the starting weight (± s.e.m.). b, Pulmonary function analyses in infected mice (n =5). Penh and Rpef were measured by using whole-body plethysmography. Mean ± s.e.m. c, Virus replication in infected BALB/c mice. Mice (n =5) were euthanized at 2 and 5 dpi for virus titration. Virus titers in the nasal turbinates and lungs were determined by plaque assay. Vertical bars show the mean ± s.e.m. Points indicate data from individual mice. The lower limit of detection is indicated by the horizontal dashed line. Data were analyzed by using the Mann-Whitney test. d, Histopathological examination of the lungs of infected mice. Three mice per group were infected with 105 PFU of Omicron/BA.1 (NC928) or Omicron/BA.2 (NCD1288) and sacrificed at 2 or 5 dpi for histopathological examinations. Representative images of the bronchi and bronchioles/alveoli of mice infected with BA.1 or BA.2 are shown. Upper panels, hematoxylin and eosin (H&E) staining. Lower panels, in situ hybridization targeting the nucleocapsid gene of SARS-CoV-2. Scale bars, 100 μm. e, Pro-inflammatory cytokine/chemokine responses in the lungs of infected mice. BALB/c mice were intranasally inoculated with 105 PFU of Beta/B.1.351 (HP01542), BA.1 (NC928), or BA.2 (NCD1288) (infected mice, n = 4; naïve mice, n =3) at 1, 2, and 3 dpi. Vertical bars show the mean ± s.e.m. Points indicate data from individual mice. Data were analyzed by a two-way ANOVA with Tukey’s multiple comparisons test. f, g K18-hACE2 mice were intranasally inoculated with 103 PFU in 50 μL of WA1/2020 D614G or BA.2 (NCD1288). Viral titers (f) and RNA levels (g) were measured at 3 dpi (n = 7–8 per group, 2 experiments). Virus titers in the nasal turbinates and lungs were determined by plaque assay. Mean ± s.e.m. Points indicate data from individual mice. The lower limit of detection is indicated by the horizontal dashed line. Data were analyzed by Mann-Whitney test.
Figure 2
Figure 2. Omicron/BA.2 and Omicron/BA.1 show similar infectivity and pathogenicity in hamsters.
a–c, Syrian hamsters were intranasally inoculated with 105 or 103 PFU in 30 μL of Omicron/BA.1 (NC928), Omicron/BA.2 (NCD1288), or PBS (mock). a, Body weights of virus-infected (n=4) and mock-infected hamsters (n =3) were monitored daily for 10 days. Data are presented as the mean percentages of the starting weight (± s.e.m.). b, Pulmonary function analyses in infected hamsters. Penh and Rpef were measured by using whole-body plethysmography. Mean ± s.e.m. (BA.1- or BA.2-infected hamsters, n = 4; mock-infected hamsters, n =3). c, Virus replication in infected Syrian hamsters. Hamsters (n =4) were euthanized at 3 dpi for virus titration. Virus titers in the nasal turbinate and lungs were determined by plaque assay. Vertical bars show the mean ± s.e.m. Points indicate data from individual hamsters. The lower limit of detection is indicated by the horizontal dashed line. Data were analyzed by Mann-Whitney test (titers in the lungs of hamsters infected with 103 PFU) or unpaired student’s t-test (titers in the lungs of hamsters infected with 105 PFU and in the nasal turbinate of hamsters infected with 105 or 103 PFU). d, Co-infection with Omicron/BA.1 and Omicron/BA.2. BA.1 (NC928) and BA.2 (NCD1288) were mixed at an equal ratio on the basis of their infectious titers, and the virus mixture (total 2 × 10³ PFU) was inoculated into hamsters. Nasal turbinates and lungs were collected from the infected animals at 4 dpi and analyzed using next generation sequencing (NGS). Shown are the relative proportions of BA.1 and BA.2 in the infected animals. e, Representative micro-CT axial and coronal images of the lungs of mock-infected hamsters (n = 3), and four hamsters per group infected with 105 PFU of Omicron/BA.1 or 105 PFU of Omicron/BA.2 at 7 dpi. Lung abnormalities included minimal, patchy, ill-defined, peri-bronchial ground glass opacity (white arrowheads), and few, small, focal rounded/nodular regions (black arrows), consistent with minimal pneumonia. Coronal CT images were reformatted to optimize lesion visualization. CT severity scores for uninfected hamsters (n = 3) or those inoculated with 105 PFU of BA.1 (n = 4) or 105 PFU of BA.2 (n = 4) were analyzed by using the unpaired student’s t-test. Vertical bars show the mean ± s.e.m. Points indicate data from individual hamsters. f, Histopathological examination of the lungs of infected Syrian hamsters. Four hamsters per group were infected with 105 PFU of Omicron/BA.1 (NC928) or Omicron/BA.2 (NCD1288) and sacrificed at 3 or 6 dpi for histopathological examinations. Representative images of the bronchi/bronchioles and alveoli of hamsters infected with BA.1 or BA.2 are shown. Upper panels, hematoxylin and eosin (H&E) staining. Lower panels, in situ hybridization targeting the nucleocapsid gene of SARS-CoV-2. Scale bars, 100 μm. g-i, hACE2-expressing Syrian hamsters were intranasally inoculated with 103 PFU in 30 μL of D614G (HP095) or Omicron/BA.2 (NCD1288) g, h, Body weights (g) and survival (h) were monitored daily for 14 days. The values for body weights are presented as the mean percentages of the starting weight ± s.e.m. Survival data were analyzed by Log-rank (Mantel-Cox) test. i, Three hamsters per group were euthanized at 3 or 5 dpi for virus titration. Virus titers in the nasal turbinates and lungs were determined by use plaque assay. Vertical bars show the mean ± s.e.m. Points indicate data from individual hamsters. The lower limit of detection is indicated by the horizontal dashed line. Data were analyzed by Mann-Whitney test (titers in the lungs at 3 dpi) or unpaired student’s t-test (titers in the lungs at 3 dpi, and those in the nasal turbinates at 3 and 5 dpi). P values of < 0.05 were considered statistically significant.
Figure 3
Figure 3. Antibody responses to the SARS-CoV-2 Omicron/BA.2 variant.
a, Neutralizing antibody titers of human plasma obtained from individuals immunized with a third dose of the BNT162b2 vaccine. Samples were collected 1 month after the third immunization. b, Neutralizing antibody titers of human plasma obtained from individuals immunized with two doses of the BNT162b2 vaccine after prior infection. Samples were collected 1 or 3 months after the second immunization. c, Neutralizing antibody titers of human plasma obtained from individuals who were infected with the Delta variant after two doses of the BNT162b2 vaccine. Samples were collected 10–95 days after symptom onset. d, Neutralizing antibody titers of human plasma obtained from individuals who were infected with the Omicron variant after two doses of the BNT162b2 or mRNA-1273 vaccine. Samples were collected 9–16 days after symptom onset. P-values were calculated by one-way ANOVA with a Dunnett’s multiple comparisons test. Each dot represents data from one individual. Geometric mean titers (GMTs) are shown.
Figure 4
Figure 4. Therapeutic effects of monoclonal antibodies and antiviral compounds against SARS-CoV-2 Omicron variants.
a, Diagram of the experimental workflow for assessing the therapeutic effects of monoclonal antibodies. b, Syrian hamsters were intranasally inoculated with 103 PFU of Omicron/BA.2 (NCD1288) or D614G (HP095). One day after infection, hamsters were intraperitoneally injected with a single dose of the REGN10987/REGN10933 or COV2-2196/COV2-2130 combination (2.5 mg/kg each), or S309 as monotherapy (5 mg/kg). A human monoclonal antibody (1430E3/9) against the hemagglutinin of influenza B virus was injected as a control. Four to five hamsters per group were euthanized at 4 dpi for virus titration. c Diagram of the experimental workflow for assessing the therapeutic effects of antiviral compounds. d Syrian hamsters were intranasally inoculated with 103 PFU of Omicron/BA.2 (NCD1288). One day after infection, hamsters were treated with: 500 mg/kg molnupiravir, 1000 mg/kg nirmatrelvir, or 60 mg/kg S-217622 orally twice daily for 3 days. Methylcellulose served as a control for oral treatment. Four hamsters per group were euthanized at 4 dpi for virus titration. Virus titers in the nasal turbinates and lungs were determined by plaque assay. Vertical bars show the mean ± s.e.m. Points indicate data from individual hamsters. The lower limit of detection is indicated by the horizontal dashed line. To compare the lung and nasal turbinate titers of the Omicron/BA.2 (NCD1288)- and D614G (HP095)-infected hamster groups, we used a Kruskal-Wallis test with Dunn’s multiple comparisons test and a one-way ANOVA with Dunnett’s multiple comparisons test, respectively. P values of < 0.05 were considered statistically significant.

References

    1. Callaway E. & Ledford H. How bad is Omicron? What scientists know so far. Nature 600, 197–199, doi:10.1038/d41586-021-03614-z (2021). - DOI - PubMed
    1. Flemming A. Omicron, the great escape artist. Nat Rev Immunol 22, 75, doi:10.1038/s41577-022-00676-6 (2022). - DOI - PMC - PubMed
    1. Yamasoba D. et al. Virological characteristics of SARS-CoV-2 BA.2 variant. bioRxiv, doi:10.1101/2022.02.14.480335 (2022). - DOI
    1. Lyngse F. et al. Transmission of SARS-CoV-2 Omicron VOC subvariants BA.1 and BA.2: Evidence from Danish Households. medRxiv, doi:10.1101/2022.01.28.22270044 (2022). - DOI
    1. Elliott P. et al. Post-peak dynamics of a national Omicron SARS-CoV-2 epidemic during January 2022. doi:10.1101/2022.02.03.22270365 (2022). - DOI - PMC - PubMed

Publication types

LinkOut - more resources