[Preprint]. 2023 Mar 20:2021.04.29.441889.
doi: 10.1101/2021.04.29.441889.

Type I interferon responsive microglia shape cortical development and behavior

Affiliations

Type I interferon responsive microglia shape cortical development and behavior

Caroline C Escoubas et al. bioRxiv. .

Update in

  • Type-I-interferon-responsive microglia shape cortical development and behavior.
    Escoubas CC, Dorman LC, Nguyen PT, Lagares-Linares C, Nakajo H, Anderson SR, Barron JJ, Wade SD, Cuevas B, Vainchtein ID, Silva NJ, Guajardo R, Xiao Y, Lidsky PV, Wang EY, Rivera BM, Taloma SE, Kim DK, Kaminskaya E, Nakao-Inoue H, Schwer B, Arnold TD, Molofsky AB, Condello C, Andino R, Nowakowski TJ, Molofsky AV. Escoubas CC, et al. Cell. 2024 Apr 11;187(8):1936-1954.e24. doi: 10.1016/j.cell.2024.02.020. Epub 2024 Mar 14. Cell. 2024. PMID: 38490196 Free PMC article.

Abstract

Microglia are brain resident phagocytes that can engulf synaptic components and extracellular matrix as well as whole neurons. However, whether there are unique molecular mechanisms that regulate these distinct phagocytic states is unknown. Here we define a molecularly distinct microglial subset whose function is to engulf neurons in the developing brain. We transcriptomically identified a cluster of Type I interferon (IFN-I) responsive microglia that expanded 20-fold in the postnatal day 5 somatosensory cortex after partial whisker deprivation, a stressor that accelerates neural circuit remodeling. In situ, IFN-I responsive microglia were highly phagocytic and actively engulfed whole neurons. Conditional deletion of IFN-I signaling (Ifnar1fl/fl) in microglia but not neurons resulted in dysmorphic microglia with stalled phagocytosis and an accumulation of neurons with double strand DNA breaks, a marker of cell stress. Conversely, exogenous IFN-I was sufficient to drive neuronal engulfment by microglia and restrict the accumulation of damaged neurons. IFN-I deficient mice had excess excitatory neurons in the developing somatosensory cortex as well as tactile hypersensitivity to whisker stimulation. These data define a molecular mechanism through which microglia engulf neurons during a critical window of brain development. More broadly, they reveal key homeostatic roles of a canonical antiviral signaling pathway in brain development.


Conflict of interest statement

Declaration of interests: The authors declare no competing interests.

Figures
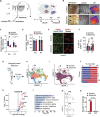
FIGURE 1:
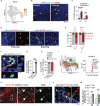
FIGURE 1:. A type I interferon-responsive microglial subset expands 20-fold during cortical remapping.
(A) Schematic of barrel cortex connectivity and experimental timeline (B) Representative images of control and whisker lesioned whisker pad (left), en face imaging of L4 somatosensory cortex and cortex topographical heat map derived from VGLUT2 intensity data (right). (scale bar = 100μm) (C) Quantification of barrel distinctness based on VGLUT2 intensity in barrels vs. septa in control and deprived hemispheres. Box and whisker plots show range (whiskers), median, and first and third quartiles (box). (2–4 barrel/septa pairs per condition per mouse; P5: n=3 mice, P7: n=4 mice, One-way ANOVA with Sidak post-hoc test, p=0.0380/0.1223) (D) VGLUT2 intensity averaged over the entire barrel field in the deprived and spared hemispheres. Error bars show mean±SD. (P5: n=3 mice, P7: n=4) (E) Representative images of 5BBP1+ foci in layer 5 of the barrel cortex. Inset of the right with 53BP1+ foci containing neurons circled in dotted white line. (scale bar = 20μm and scale bar inset = 10μm) (F) Quantification of 53BP1 foci+ neurons in layers4/5 of the barrel cortex in control vs. deprived hemispheres. Dots per mouse, line connect both hemispheres from same mouse. (n=5mice, one-way ANOVA with Sidak post-hoc test, p=0.5728/0.0055) (G) Schematic of MACS-isolation of microglia for single cell sequencing (H) UMAP plot showing independent clustering of 12,000 CD11b+ cells, pooling P5 and P7 timepoints from control and whisker deprived cortices, including microglia (Clusters 0–8) and macrophages (Cluster 9). Dotted lines highlight clusters for further analysis. Clusters 0/5 and 6/7 were the results of merging nearest neighbor clusters 0 with 5 as well as 6 with 7 due to low numbers of uniquely expressed genes, as shown in Fig. S2E. (I) Clusters colored by condition (control vs. whisker deprived) (J) Quantification of cluster composition by condition. X-axis represents percent of cells in each cluster from the control (blue) or deprived (red) hemispheres, normalized for total number of cells per sample. (Chi-square test with Bonferroni correction, *pAdj<0.01, **pAdj<10−25) (K) Volcano plot of genes differentially expressed in cluster 8 relative to all other clusters (L) GO terms upregulated in Cluster 8 (Metascape) (M) UMAP plots showing cells separated by age (P5 vs. P7) with cluster 8 highlighted in green (N) Plot of cluster 8 abundance at each time point in control vs. deprived conditions (Chi-square test with Bonferroni correction, ****pAdj<10−10) See also Fig. S2, Supplementary Tables 2–3
Figure 2:
Figure 2:. Interferon-responsive microglia are conserved across pathologies.
(A) Expression of 38 ‘Cluster 8’ marker genes (eigengene) across a set of published microglia sequencing data (from bulk sorted CD11b+ cells. Dots represent individual genes, highlighting Ifitm3 (red) and Mx1 (orange). Y-axis represents the log fold change relative to its own control. See Table S4 for details of each sample set and experimental condition. (B) Our microglial P5/P7 dataset was re-clustered to create a reference PCA and UMAP to which external datasets (brown triangles) were aligned. Red circle=Interferon-reponsive microglia (cluster 8), grey circle=homeostatic microglia. Representative examples shown are of a Sars-CoV2 dataset (see Table S5 for details). (C) Bar plot showing enrichment of Cluster 8-like cells in various microglial single-cell sequencing datasets from different disease states and ages relative to each study’s control. See Table S5 for all dataset descriptions and references ,– (D) Representative image and 3D reconstruction of an IFITM3+ microglia engulfing a SARS-CoV-2 infected cell (scale bar = 10μm) (E) Correlation of SARS-CoV-2 Spike protein with microglial IFITM3 mean fluorescence intensity per image. Each color represents an individual mouse. (n = 3 mice at 6 days post infection, r Spearman correlation coefficient = 0.86, p<0.0001) (F) Percent phagocytic microglia in cortices of mock-infected vs. SARS-CoV-2 infected mice at 6DPI, binned by IFITM3 expression per cell (see Methods for details). Dots per image. Kruskal-Wallis test, p<0.0001, n = 2 mice per group.
Figure 3:
Figure 3:. IFN-I responsive microglia engulf neurons during cortical development.
(A) UMAP feature plot showing normalized expression of cluster 8 marker gene Ifitm3 (B) Representative image of IFITM3+ Cx3cr1GFP+ microglia (arrowheads) in control or whisker deprived barrel cortex at P5 (scale bar = 50μm) (C) Percent IFITM3+ microglia from layers 4/5. Lines connect control and deprived hemispheres from the same mouse (n=5 mice, 2-way RM ANOVA with Sidak post-hoc test, p=<0.0001/0.0048) (D) Representative image of ‘projecting’ and ‘engulfing’ IFITM3+ microglia in P5 deprived cortex (scale = 20 μm (left), 5 μm (right)) (E) Quantification of microglial morphological subtypes described in Fig. 3D (n = 4 mice, 2-way RM ANOVA with Sidak post-hoc test, L4: p=0.0173/0.0086/0.0003 and L5: p=0.0005/0.9999/0.0005) (F) Confocal image and orthogonal views of an IFITM3+ microglia containing multiple phagocytic cups (i, ii show nuclei-containing phagocytic cups that are distinct from the microglia nucleus) (scale bar = 5μm) (G) Percent of IFITM3− and IFITM3+ microglia containing phagocytic cups (n = 3 mice, Welch’s t-test, p=0.0001) (H) Percent of microglia containing 1, 2 or 3 DAPI+ phagocytic compartments (inclusions), among microglia with at least one DAPI+ phagocytic compartment (n = 4 mice, 2-way RM ANOVA with Sidak post-hoc test, p=0.0029/0.0057/0.9772) (I) RNA velocity analysis showing predicted future cell state, colored by cluster (scVelo) (Supplemental table 6) (J) Volcano plot of differentially expressed genes in Cluster 3 (K) Representative image of IBA1+ microglia engulfing RorbCre;TdT+ neurons in barrel cortex. Inset: layer 5. Arrowheads: RorbcreTdT+ and CD68+ phagolysosomes (scale bar =50 μm) (L) Representative image of a tdTomato+ (Mx1-Cre;Rosa26-LSL-TdT) IBA1+ microglial phagocytic cup around a Grin1+ nucleus (inset, arrow) (scale bar =10μm) (M) Quantification of percent tdTomato+ or negative microglia forming phagocytic cups around Grin1+ nuclei in layers 4/5. (n=3 mice at P5 and 5 mice at P7, 2-way RM ANOVA with Sidak post-hoc test, p=0.0099/0.0029)
Figure 4:
Figure 4:. IFN-I signaling promotes microglial phagocytosis and restricts accumulation of DNA-damaged neurons.
(A) Diagram of experimental design comparing control (Ifnar1+/+) vs. IFN-I insensitive (Ifnar1−/−) mice. (B) IFITM3+ microglia in deprived hemispheres L4/5 barrel cortex from Ifnar1+/+ and Ifnar1−/−. Dots per mouse (Welch’s t-test, p=0.0313, n=3 per group) (C) Representative image of microglia from Ifnar1+/+ and Ifnar1−/− mice. Yellow: microglia nucleus, green: phagocytic compartment (scale bar = 15μm) (D) Phagocytic compartments per microglia in L4/5 barrel cortex from Ifnar1+/+ and Ifnar1−/−mice. Dots per mouse. Welch’s t-test, p=0.0228, n=3 mice per group. (E) Largest phagosome diameter per microglia in μm in L4/5 barrel cortex from Ifnar1+/+ and Ifnar1−/− mice. Horizontal dotted line shows mean microglial nucleus size. Welch’s t-test, p=0.0011, n=57–76 microglia from 3 mice per group (F) Representative images of a non-bubble microglia containing a phagosome and a bubble microglia with an enlarged phagosome. Yellow arrowhead: microglia nucleus, white dashed line: phagosome diameter (scale bar = 10μm) (G) Percent bubble morphology microglia in L4/5 barrel cortex from Ifnar1+/+ and Ifnar1−/− mice. Dots per mouse. Welch’s t-test, p=0.0332, n=3 mice per group (H) Developmental time-course of bubble morphology microglia in L4/5 barrel cortex from Ifnar1+/+ and Ifnar1−/− mice. n= 2–3 mice per time point (I) 53BP1+ neurons in barrel cortices of Ifnar1+/+ and Ifnar1−/− mice. Yellow dotted lines outline nuclei with 53BP1+ foci, square inset highlights 53BP1 staining. (scale bar = 10μm). (J) Percent of all cells in layers 4/5 containing foci in Ifnar1+/+ and Ifnar1−/− mice at P5 (n= 5–6 mice, Welch’s t-test, p=0.0008). (K) Percent of all cells in layers 4/5 containing foci in Ifnar1+/+ and Ifnar1−/− mice at P15 (n= 2 mice, Welch’s t-test, p=0.7446).
Figure 5:
Figure 5:. IFN-I signals directly to microglia to promote neuronal engulfment and restrict accumulation of dsDNA break neurons.
(A) Schematic of Type I interferon receptor. (B) Representative confocal image of Ifnar1 transcript co-stained with IBA1 or Aldh1l1GFP at P5 in the somatosensory cortex (scale bar = 50μm) (C) Quantification of the number of punctae in nuclei of microglia (IBA1+), astrocytes (Aldh1l1GFP+) and endothelial cells (based on elongated morphology) (D) Representative confocal image of IBA1+ microglia in L4/5 barrel cortex from Cx3cr1CRE:Ifnar1flox/flox showing bubble phenotype with enlarged DAPI+ containing phagosome, Yellow: microglia nucleus, green: phagocytic compartment. (scale bar = 50μm) (E) Percent bubble morphology microglia in L4/5 barrel cortex from Cx3cr1CRE:Ifnar1flox/flox mice. Dots per mouse. (n=5mice, Welch’s t-test, p=0.002) (F) Percent bubble morphology microglia in L4/5 barrel cortex from Syn1CRE:Ifnar1flox/flox mice. Dots per mouse (n=3mice, Welch’s t-test, p=0.1742) (G) Percent of all cells in layers 4/5 containing foci in Cx3cr1CRE:Ifnar1flox/flox mice at P5 (n=5mice, Welch’s t-test, p=0.0466) (H) Percent of all cells in layers 4/5 containing foci in Syn1CRE:Ifnar1flox/flox mice at P5 (n=3mice, Welch’s t-test, p=0.8939)
Figure 6:
Figure 6:. IFN-I is sufficient to promote neuronal engulfment by microglia.
(A) Diagram of experimental design. 10ng of IFNβ injected at P4. Analysis is performed at P5. Blue square: region analyzed. (B) Representative images of PBS vs. IFNβ injected mice motor cortex at the injection site. (scale bar = 50μm) (C) IFITM3+ microglia in cortex in PBS vs. IFNβ injected mice. Dots per mouse. Welch’s t-test, p<0.0001, n= 5–6 per group (D) Representative images of microglia in PBS vs. IFNβ injected mice with 3D rendering. IFIMT3+ microglia shows both a ‘projecting phagosome’ and a ‘soma phagosome’ (yellow arrow = microglia nucleus, white arrow = DAPI+ containing phagocytic cup, scale bar = 5μm) (E) Quantification of microglial morphology subtypes (ramified, w/ phagocytic cup or engulfing with either projecting or soma phagosome) from PBS vs. IFNβ injected mice. Dots per mouse. (n=5–6 per group, 2-way RM ANOVA with Sidak post-hoc test) (F) Phagocytic compartments per microglia (IFITM3− vs. IFITM3+) in PBS vs. IFNβ injected mice. Dots per mouse. Welch’s t-test, p=0.0027, n=5 per group. (G) Bubble morphology microglia in PBS vs. IFNβ injected mice. Dots per mouse (Welch’s t-test, p=0.5759, n=4–6 mice per group) (H) Representative images of 53BP1+ foci containing neurons in PBS vs. IFNβ injected mice motor cortex at the injection site. White dashed line shows inset. Yellow dashed lines outline nuclei with 53BP1+ foci (scale bar = 50μm in low magnification image and scale bar = 10μm in inset) (I) Percent of all cells containing 53BP1+ foci in PBS vs. IFNβ injected mice motor cortex at the injection site. Welch’s t-test, p=0.0088, n=6–7 per group. (J) Diagram showing parameters for zebrafish poly(I:C) injection and live imaging experiment (K) Individual frames (0–50min) from live imaging of green microglia (Tg(mpeg:EGFP-CAAX)) and red neurons (Tg(NBT:dsRed)) in the zebrafish optic tectum after intraventricular injection of PBS or poly(I:C). PBS: the white arrowhead shows a single neuron that is contacted by a microglial process but not engulfed. poly(I:C): the white arrowhead shows a neuron that is contacted, engulfed, and trafficked towards the microglial soma (scale bar = 10μm) (L) Quantification showing the percent of microglia engulfing at least one dsRed+ cell during the hour-long video. Dot per fish. (n= 4 PBS, 6 poly(I:C), Welch’s t-test, p=0.161) (M) Percent of microglial processes with each of three morphologies (n = 4 PBS, 6 poly(I:C), 2-way ANOVA with Sidak post-hoc test, p=0.1504/0.0056/0.0029)
Figure 7:
Figure 7:. IFN-I responsive microglia prevent tactile hypersensitivity.
(A) Representative images of CTIP2 in the somatosensory cortex in P15 Ifnar1+/+ and Ifnar1−/− mice. White dashed lines highlight the cortical layers (scale bar = 100μm) (B) Representative images of SATB2 in the somatosensory cortex in P15 Ifnar1+/+ and Ifnar1−/− mice. (scale bar = 100μm) (C) Representative images of Parvalbumin in the somatosensory cortex in P15 Ifnar1+/+ and Ifnar1−/− mice. (scale bar = 100μm) (D) Representative images of Somatostatin in the somatosensory cortex in P15 Ifnar1+/+ and Ifnar1−/− mice. (scale bar = 100μm) (E) Relative CTIP2+ neuron density across cortical layers at P15 Ifnar1+/+ and Ifnar1−/− mice. Data are represented as mean±sem. Dots=mice. Welch’s t-test, p=0.0443, n=6 mice per group. (F) SATB2+ neuronal density across cortical layers in P15 Ifnar1+/+ and Ifnar1−/− mice. Data are mean±sem. Dots = mice. Welch’s t-test, p=0.1638, n=5–6 mice per group. (G) Parvalbumin+ neuronal density across cortical layers in P15 Ifnar1+/+ and Ifnar1−/− mice. Data are mean±sem. Dots = mice. Welch’s t-test, p=0.0197, n=6 mice per group. (H) Somatostatin+ neuronal density across cortical layers in P15 Ifnar1+/+ and Ifnar1−/− mice. Data are mean±sem. Dots = mice. Welch’s t-test, p=0.3038, n=5–6 mice per group. (I) Schematic of whisker nuisance assay. (J) Whisker nuisance score in P15 Ifnar1+/+ and Ifnar1−/− mice. Data are mean±sem. Dots = mice. Welch’s t-test, p=0.0009, n=5–7 mice per group, 3 independent experiments. (K) Whisker nuisance score in P15 littermate control (Ifnar1flox/flox) vs. Cx3cr1CRE:Ifnar1flox/flox mice. Data are mean±sem. Dots = mice. Welch’s t-test, p=0.0002, n=10–14 mice per group, 4 independent experiments. (L) Whisker nuisance score in P15 littermate control (Ifnar1flox/flox) vs. Syn1CRE:Ifnar1flox/flox mice. Data are mean±sem. Dots = mice. Welch’s t-test, p=0.4993, n=3 mice per group.

References

    1. Forrest M. P., Parnell E. & Penzes P. Dendritic structural plasticity and neuropsychiatric disease. Nat. Rev. Neurosci. 19, 215–234 (2018). - PMC - PubMed
    1. Bitzenhofer S. H., Pöpplau J. A., Chini M., Marquardt A. & Hanganu-Opatz I. L. A transient developmental increase in prefrontal activity alters network maturation and causes cognitive dysfunction in adult mice. Neuron 109, 1350–1364.e6 (2021). - PMC - PubMed
    1. Medendorp W. E. et al. Selective postnatal excitation of neocortical pyramidal neurons results in distinctive behavioral and circuit deficits in adulthood. iScience 24, 102157 (2021). - PMC - PubMed
    1. Arguello P. A. & Gogos J. A. Genetic and cognitive windows into circuit mechanisms of psychiatric disease. Trends Neurosci. 35, 3–13 (2012). - PubMed
    1. Vainchtein I. D. & Molofsky A. V. Astrocytes and Microglia: In Sickness and in Health. Trends Neurosci. 43, 144–154 (2020). - PMC - PubMed

Publication types