. 2022 Aug;37(Suppl 2):248-258.
doi: 10.1007/s12028-022-01449-8. Epub 2022 Mar 2.

Outcome Prediction of Postanoxic Coma: A Comparison of Automated Electroencephalography Analysis Methods

Affiliations

Outcome Prediction of Postanoxic Coma: A Comparison of Automated Electroencephalography Analysis Methods

Stanley D T Pham et al. Neurocrit Care. 2022 Aug.

Abstract

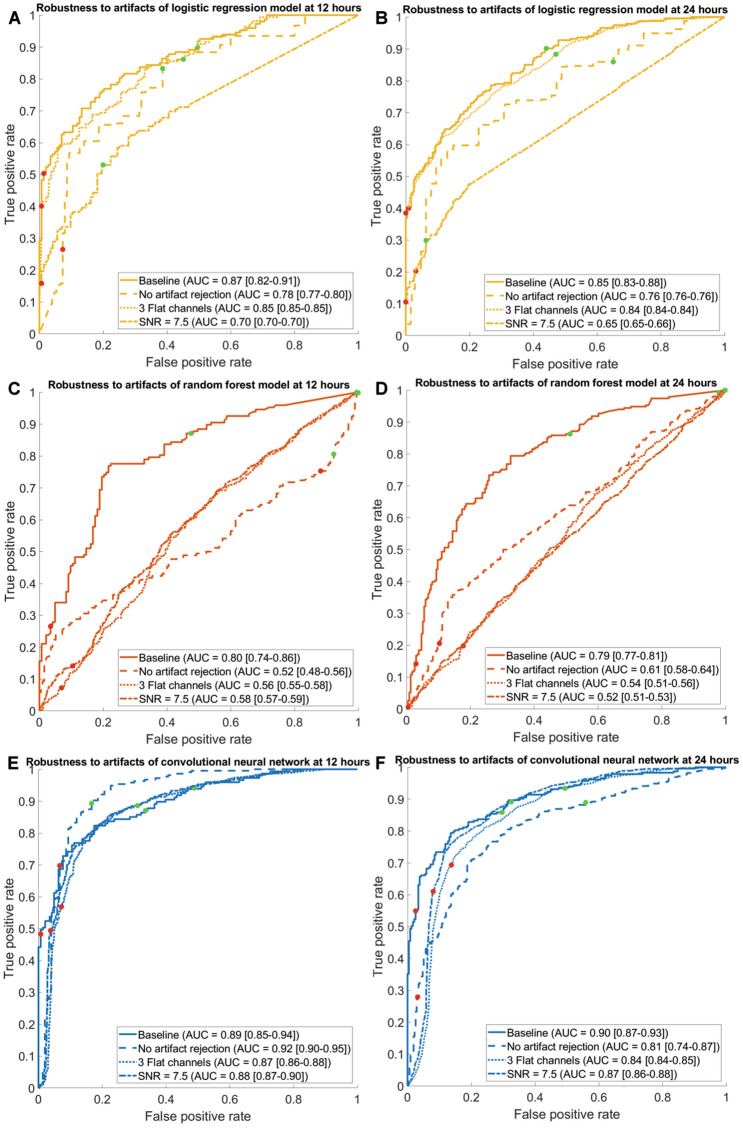
Background: To compare three computer-assisted quantitative electroencephalography (EEG) prediction models for the outcome prediction of comatose patients after cardiac arrest regarding predictive performance and robustness to artifacts.

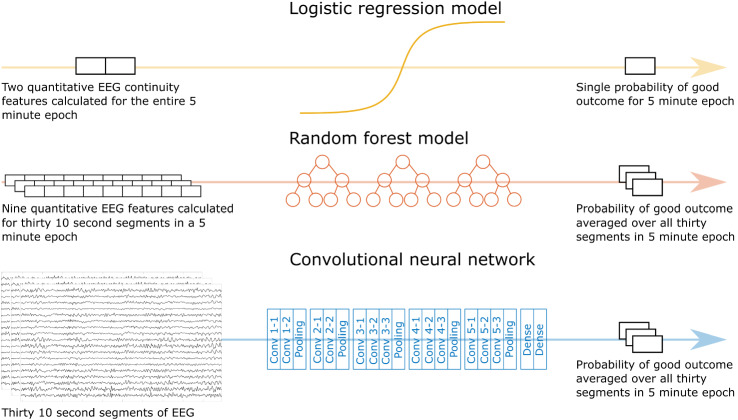
Methods: A total of 871 continuous EEGs recorded up to 3 days after cardiac arrest in intensive care units of five teaching hospitals in the Netherlands were retrospectively analyzed. Outcome at 6 months was dichotomized as "good" (Cerebral Performance Category 1-2) or "poor" (Cerebral Performance Category 3-5). Three prediction models were implemented: a logistic regression model using two quantitative features, a random forest model with nine features, and a deep learning model based on a convolutional neural network. Data from two centers were used for training and fivefold cross-validation (n = 663), and data from three other centers were used for external validation (n = 208). Model output was the probability of good outcome. Predictive performances were evaluated by using receiver operating characteristic analysis and the calculation of predictive values. Robustness to artifacts was evaluated by using an artifact rejection algorithm, manually added noise, and randomly flattened channels in the EEG.

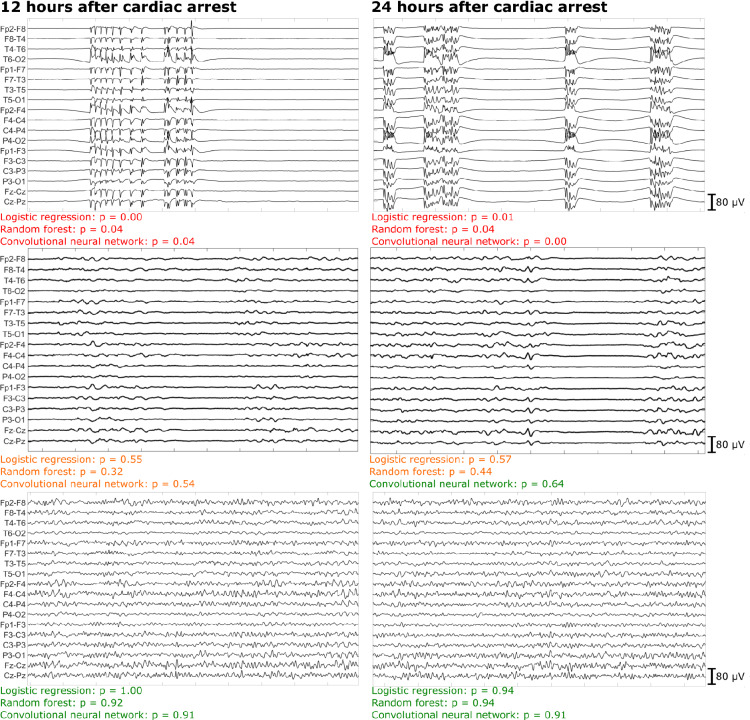
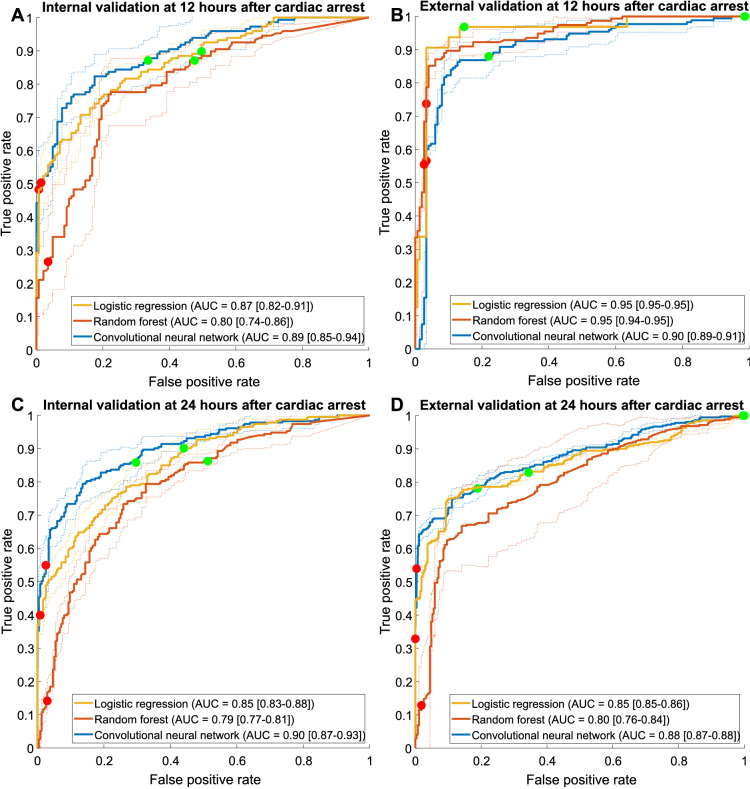
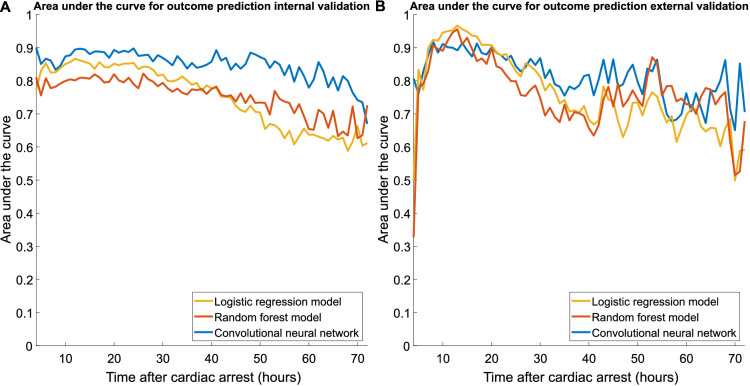
Results: The deep learning network showed the best overall predictive performance. On the external test set, poor outcome could be predicted by the deep learning network at 24 h with a sensitivity of 54% (95% confidence interval [CI] 44-64%) at a false positive rate (FPR) of 0% (95% CI 0-2%), significantly higher than the logistic regression (sensitivity 33%, FPR 0%) and random forest models (sensitivity 13%, FPR, 0%) (p < 0.05). Good outcome at 12 h could be predicted by the deep learning network with a sensitivity of 78% (95% CI 52-100%) at a FPR of 12% (95% CI 0-24%) and by the logistic regression model with a sensitivity of 83% (95% CI 83-83%) at a FPR of 3% (95% CI 3-3%), both significantly higher than the random forest model (sensitivity 1%, FPR 0%) (p < 0.05). The results of the deep learning network were the least affected by the presence of artifacts, added white noise, and flat EEG channels.

Conclusions: A deep learning model outperformed logistic regression and random forest models for reliable, robust, EEG-based outcome prediction of comatose patients after cardiac arrest.

Keywords: Brain hypoxia; Cardiac arrest; Deep neural networks; Electroencephalography; Machine learning; Prognosis.


Conflict of interest statement

Dr. van Putten is co-founder of Clinical Science Systems, a supplier of electroencephalogram systems for Medisch Spectrum Twente. Dr. Blans received funding from Philips (ultrasound seminar). The remaining authors have disclosed that they do not have any conflicts of interest.

Figures

Fig. 1
Fig. 1
An overview of the automatic electroencephalogram (EEG) prediction models used in this study. The inputs of the respective models are shown on the left side and the outputs are shown on the right. The logistic regression model used two quantitative features as input and outputted the probability of good outcome by using a regression model with constants optimized during training. The random forest model used nine quantitative features for 30 10-s EEG segments as inputs and operated by using an ensemble of random independent decision trees to generate a probability of good outcome for all 30 segments. The convolutional neural network used raw 10-s segments of EEG as the input and performed feature extraction and classification by using convolutional filters. The output of the neural network was the probability of good outcome for all 30 segments
Fig. 2
Fig. 2
Examples of 10-s electroencephalogram (EEG) segments of three different patients at 12 and 24 h after cardiac arrest. The probability of good outcome predicted by the logistic regression model, random forest model, and convolutional neural network are shown below each panel. The colors denote the prediction of good (green), uncertain (orange), or poor (red) outcome of all models. Top: EEG segments of a patient with synchronous patterns at suppressed background, with very low probabilities of good outcome. This patient, indeed, had a poor neurologic outcome (Cerebral Performance Category [CPC] = 5). Middle: EEG segments of a patient with a discontinuous background pattern. At 12 h after cardiac arrest, all three models predicted an uncertain outcome. At 24 h after cardiac arrest, the logistic regression and random forest model still predicted an uncertain outcome, wheras the convolutional neural network correctly predicted a good outcome. This patient had a good neurologic outcome (CPC = 2). Bottom: EEG segments of a patient with early return to a continuous background pattern, with high probabilities of good outcome. This patient had a good neurologic outcome (CPC = 1)
Fig. 3
Fig. 3
Average receiver operating characteristic (ROC) curves of the logistic regression model (yellow), random forest model (red), and convolutional neural network (blue). For the internal validation, ROC curves with corresponding 95% confidence interval (CI) are shown for all models at 12 (a) and 24 (c) hours after cardiac arrest. For the external test, ROC curves with corresponding 95% CIs are shown for all models at 12 (b) and 24 (d) hours after cardiac arrest. The solid red and green circles indicate the chosen thresholds in the training set for the prediction of poor and good outcomes, respectively. AUC = area under the curve
Fig. 4
Fig. 4
Area under the curve for the outcome prediction over a 4–72 h time period after cardiac arrest on the internal validation set (a) and the external test set (b)
Fig. 5
Fig. 5
Average receiver operating characteristic (ROC) curves for the logistic regression model at 12 h (a) and 24 h (b) after cardiac arrest, the random forest model at 12 h (c) and 24 h (d) after cardiac arrest, and convolutional neural network at 12 h (e) and 24 h (f) after cardiac arrest. For every model, the ROC curves are shown for a baseline electroencephalogram (EEG) (solid line), EEGs without artifact rejection (dashed line), EEGs with flat channels (dotted line), and EEGs with additional Gaussian white noise (dash-dotted line). The convolutional neural network showed the best robustness to artifacts. AUC = area under the curve

References

    1. Zandbergen EGJ, De Haan RJ, Stoutenbeek CP, et al. Systematic review of early prediction of poor outcome in anoxic−ischaemic coma. Lancet. 1998;352(9143):1808–1812. doi: 10.1016/S0140-6736(98)04076-8. - DOI - PubMed
    1. Carter BG, Butt W. Review of the use of somatosensory evoked potentials in the prediction of outcome after severe brain injury. Crit Care Med. 2001;29(1):178–186. doi: 10.1097/00003246-200101000-00036. - DOI - PubMed
    1. Cloostermans MC, Van Meulen FB, Eertman CJ, et al. Continuous electroencephalography monitoring for early prediction of neurological outcome in postanoxic patients after cardiac arrest: a prospective cohort study. Crit Care Med. 2012;40(10):2867–2875. doi: 10.1097/CCM.0b013e31825b94f0. - DOI - PubMed
    1. Glimmerveen AB, Ruijter BJ, Keijzer HM, et al. Association between somatosensory evoked potentials and EEG in comatose patients after cardiac arrest. Clin Neurophysiol. 2019;130(11):2026–2031. doi: 10.1016/j.clinph.2019.08.022. - DOI - PubMed
    1. Hofmeijer J, van Putten MJAM. EEG in postanoxic coma: prognostic and diagnostic value. Clin Neurophysiol. 2016;127(4):2047–2055. doi: 10.1016/j.clinph.2016.02.002. - DOI - PubMed