. 2022 Mar;36(3):283-300.
doi: 10.1007/s40263-021-00895-w. Epub 2022 Mar 1.

Population Pharmacokinetic-B Cell Modeling for Ofatumumab in Patients with Relapsing Multiple Sclerosis

Affiliations

Population Pharmacokinetic-B Cell Modeling for Ofatumumab in Patients with Relapsing Multiple Sclerosis

Huixin Yu et al. CNS Drugs. 2022 Mar.

Abstract

Background: Ofatumumab, a fully human anti-CD20 monoclonal antibody indicated for the treatment of relapsing forms of multiple sclerosis (RMS), binds to a unique conformational epitope, thereby depleting B cells very efficiently and allowing subcutaneous administration at lower doses.

Objectives: The aims were to characterize the relationship between ofatumumab concentration and B cell levels, including the effect of covariates such as body weight, age, or baseline B cell count, and use simulations to confirm the chosen therapeutic dose.

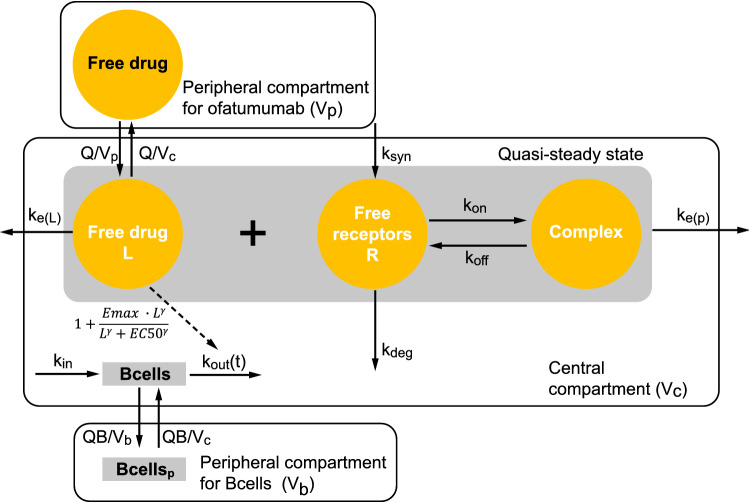
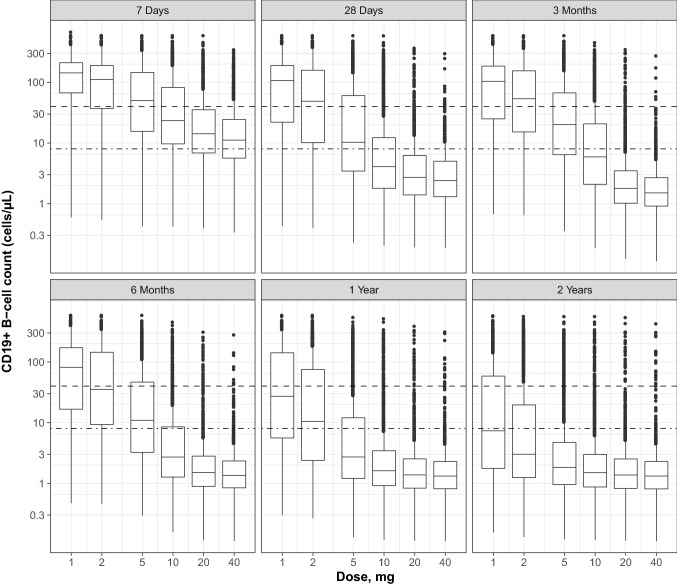
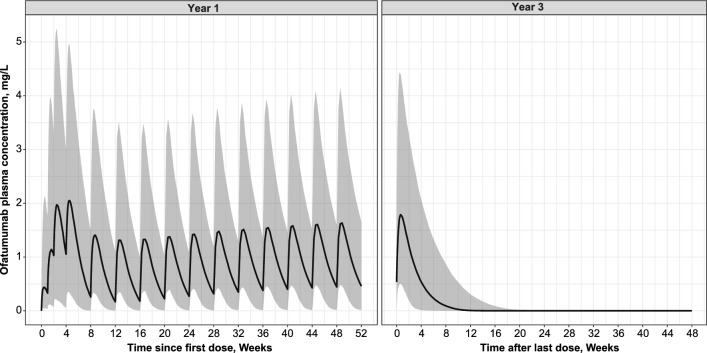
Methods: Graphical and regression analyses previously performed based on data from a dose-range finding study provided the B cell depletion target used in the present work. All available adult phase 2/3 data for ofatumumab in RMS patients were pooled to develop a population pharmacokinetics (PK)-B cell count model, using nonlinear mixed-effects modeling. The population PK-B cell model was used to simulate B cell depletion and repletion times and the effect of covariates on PK and B cell metrics, as well as the dose response across a range of subcutaneous ofatumumab monthly doses.

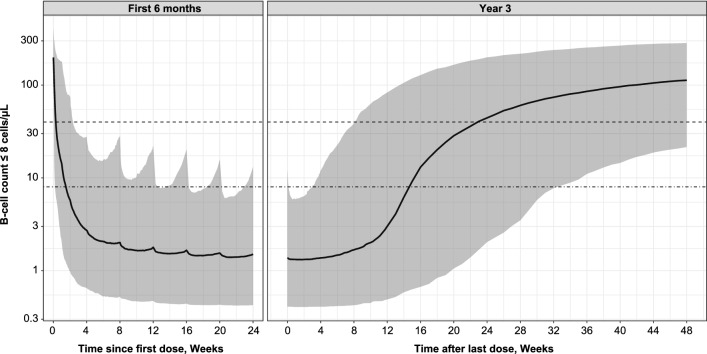
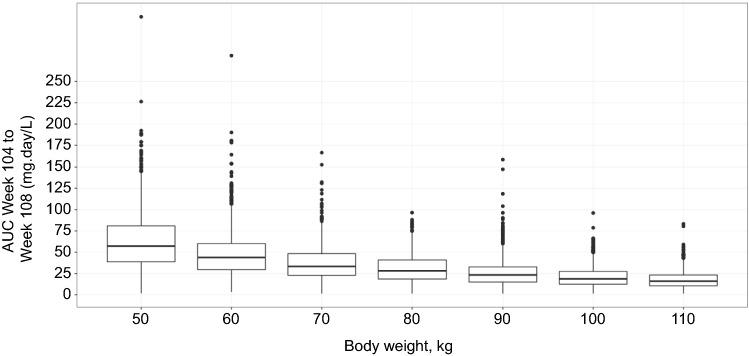
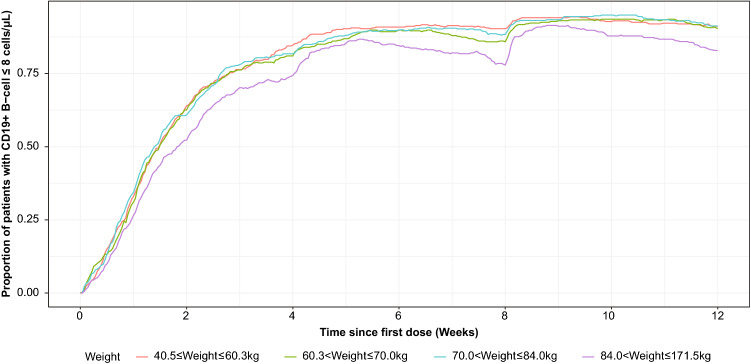
Results: The final PK-B cell model was developed using data from 1486 patients. The predetermined B cell target was best achieved and sustained with the 20-mg dose regimen, with median B cell count reaching 8 cells/µL in 11 days and negligible repletion between doses. Only weight had a significant effect on PK, which did not translate into any clinically relevant effect on B cell levels.

Conclusion: The PK-B cell modeling confirms the dose chosen for the licensed ofatumumab regimen and demonstrates no requirement for dose adjustment based on adult patient characteristics.


Conflict of interest statement

Per Soelberg Sørensen has served on scientific advisory boards for Genmab (a co-developer of ofatumumab) and GlaxoSmithKline; has served on steering committees or independent data monitoring boards in clinical trials sponsored by Genmab, GlaxoSmithKline, Merck, Novartis, and TEVA; has also served on scientific advisory boards or has received speaker honoraria for Biogen, and Celgene/BMS; has received funding of travel for these activities; and has served as editor-in-chief of the European Journal of Neurology. Go to Neurology.org/N for full disclosures. Huixin Yu, Gordon Graham, Olivier J. David, Joseph M. Kahn, Marina Savelieva, Etienne Pigeolet, Ayan Das Gupta, Ratnakar Pingili, Roman Willi, Krishnan Ramanathan, Bernd C. Kieseier, Dieter A. Häring, and Morten Bagger are all employees of Novartis.

Figures

Fig. 1
Fig. 1
Modeling steps and results. LLN lower limit of normal, PK pharmacokinetics, q4w every 4 weeks, RMS relapsing multiple sclerosis, TMDD target-mediated drug disposition
Fig. 2
Fig. 2
Cumulative volume of new Gd+ T1 lesions at week 24 by CD19+ B cell count and the number of Gd+ T1 lesions at screening. Gd+ gadolinium-enhancing, SE standard error
Fig. 3
Fig. 3
Schematic structure of the final model. EC50 concentration producing 50% of maximum drug effect, Emax maximum drug effect, kdeg receptor degradation rate constant, ke(L) elimination rate constant for ligand, ke(P) elimination rate constant for complex, kin B cell input rate, koff dissociation rate constant, kon binding rate, kout B cell elimination rate constant, ksyn synthesis rate constant, L ligand, Q intercompartmental flow, QB flow between B cell compartments, Vb peripheral volume of distribution of B cells, Vc central volume of distribution, Vp peripheral volume of distribution of ofatumumab
Fig. 4
Fig. 4
Relationship between ofatumumab doses and B cell depletion at 7 days, 28 days, 3 months, 6 months, 1 year, and 2 years. Box and whisker plots of simulated B cell counts (middle line = median; box = 25th and 75th quartiles [IQR]; lower/upper lines = 1.5 × IQR; points = outliers); simulations performed for the various dosage regimens administered SC with the prefilled syringe with the standard phase 3 schedule (i.e., three loading doses given weekly followed by monthly doses) and for the patient population included in the five studies. The dashed line indicates the B cell counts at lower limit of normal level (40 cells/µL); the dash-dotted line indicates the B cell target (8 cells/µL). IRQ interquartile range, SC subcutaneously
Fig. 5
Fig. 5
Simulated ofatumumab plasma concentration–time profiles. Over 1 year (Left panel); after last dose at 2 years (Right panel). Simulated median and 90% prediction interval; simulations performed for the phase 3 dosage regimen administered SC with the prefilled syringe (i.e., three loading 20-mg doses given weekly followed by monthly 20-mg doses) and for the patient population included in the five studies
Fig. 6
Fig. 6
Simulated B cell count. B cell depletion over the first 24 weeks of treatment (Left panel); B cell repletion after treatment stops after 2 years (Right panel). Simulated median B cell count and 90% prediction interval; simulations performed for the phase 3 dosage regimen administered SC with the prefilled syringe (i.e., three loading 20-mg doses given weekly followed by monthly 20-mg doses) and for the patient population included in the five studies. The dashed line indicates the B cell counts at lower limit of normal level (40 cells/µL); the dash-dotted line indicates the B cell target (8 cells/µL). SC subcutaneously
Fig. 7
Fig. 7
Simulated steady state AUC week 104 to week 108 by weight. Box and whisker plots of AUCs calculated from individual patient simulated PK profiles (middle line = median; box = 25th and 75th quartiles [IQR]; lower/upper lines = 1.5 × IQR; points = outliers); PK profiles are for subcutaneous route with prefilled syringe and using phase 3 dosage regimen (i.e., three loading 20-mg doses given weekly followed by monthly 20-mg doses). AUC area under the curve, IRQ interquartile range, PK pharmacokinetic
Fig. 8
Fig. 8
Proportion of CD19+ B cell depletion over time by patient weight quartile. Simulation is for subcutaneous route with prefilled syringe and using phase 3 dosage regimen (i.e., three loading 20-mg doses given weekly followed by monthly 20-mg doses)

Similar articles

Cited by

References

    1. Milo R. Therapies for multiple sclerosis targeting B cells. Croat Med J. 2019;60(2):87–98. doi: 10.3325/cmj.2019.60.87. - DOI - PMC - PubMed
    1. Häusser-Kinzel S, Weber MS. The role of B cells and antibodies in multiple sclerosis, neuromyelitis optica, and related disorders. Front Immunol. 2019;10:201. doi: 10.3389/fimmu.2019.00201. - DOI - PMC - PubMed
    1. Li R, Patterson KR, Bar-Or A. Reassessing B cell contributions in multiple sclerosis. Nat Immunol. 2018;19(7):696–707. doi: 10.1038/s41590-018-0135-x. - DOI - PubMed
    1. Wanleenuwat P, Iwanowski P. Role of B cells and antibodies in multiple sclerosis. Mult Scler Relat Disord. 2019;36:101416. doi: 10.1016/j.msard.2019.101416. - DOI - PubMed
    1. Sabatino JJ, Jr, Zamvil SS, Hauser SL. B-cell therapies in multiple sclerosis. Cold Spring Harb Perspect Med. 2019;9(2):a032037. doi: 10.1101/cshperspect.a032037. - DOI - PMC - PubMed

Publication types