. 2022 Dec;100(8):937-945.
doi: 10.1111/aos.15126. Epub 2022 Mar 1.

Deep learning identify retinal nerve fibre and choroid layers as markers of age-related macular degeneration in the classification of macular spectral-domain optical coherence tomography volumes

Affiliations

Deep learning identify retinal nerve fibre and choroid layers as markers of age-related macular degeneration in the classification of macular spectral-domain optical coherence tomography volumes

Arnt-Ole Tvenning et al. Acta Ophthalmol. 2022 Dec.

Abstract

Purpose: Deep learning models excel in classifying medical image data but give little insight into the areas identified as pathology. Visualization of a deep learning model’s point of interest (POI) may reveal unexpected areas associated with diseases such as age-related macular degeneration (AMD). In this study, a deep learning model coined OptiNet was trained to identify AMD in spectral-domain optical coherence tomography (SD-OCT) macular scans and the anatomical distribution of POIs was studied.

Methods: The deep learning model OptiNet was trained and validated on two data sets. Data set no. 1 consisted of 269 AMD cases and 115 controls with one scan per person. Data set no. 2 consisted of 337 scans from 40 AMD cases (62 eyes) and 46 from both eyes of 23 controls. POIs were visualized by calculating feature dependencies across the layer hierarchy in the deep learning architecture.

Results: The retinal nerve fibre and choroid layers were identified as POIs in 82 and 70% of cases classified as AMD by OptiNet respectively. Retinal pigment epithelium (98%) and drusen (97%) were the areas applied most frequently. OptiNet obtained area under the receiver operator curves of ≥99.7%.

Conclusion: POIs applied by the deep learning model OptiNet indicates alterations in the SD-OCT imaging regions that correspond to the retinal nerve fibre and choroid layers. If this finding represents a tissue change in macular tissue with AMD remains to be investigated, and future studies should investigate the role of the neuroretina and choroid in AMD development.

Keywords: age-related macular degeneration; convolutional neural network; deep learning; explainable artificial intelligence; spectral-domain optical coherence tomography; visualization.


Figures

Fig. 1
Fig. 1
Simplified illustration of the 3D deep learning model OptiNet. The spectral‐domain optical coherence tomography (SD‐OCT) scan seen to the left is the input to the deep learning model OptiNet. OptiNet learns to extract specific features in the SD‐OCT scan through convolutional and pooling layers during feature learning. The blue boxes represent filtered versions of the SD‐OCT scan. The faded blue boxes deeper into the image represent all the filtered versions of the SD‐OCT scan created from the learned filters of each convolutional layer. The compact set of features coming out of the feature learning section is flattened out and given to a final neural network performing the classification. The classification section of the deep learning model can be viewed as clusters of neurons where all neurons in one layer are connected to all neurons in the next. The network's final output is put through a sigmoid function that makes the output a probability between 0 and 1.
Fig. 2
Fig. 2
Visualization of points of interest in three cases with age‐related macular degeneration. The figure shows how the deep learning model, OptiNet, displayed results to the retina specialist on three cases with age‐related macular degeneration. Three images are given for each case, displaying the regular spectral‐domain optical coherence tomography scan, points of interest and a localization heat map in a row. Convolutional neural network fixations show the points of interest (red dots) that were important for the classification. A high value on the colour bar, displayed in red, implies high interest from the model.
Fig. 3
Fig. 3
The high‐resolution visualization of points of interest in a patient with age‐related macular degeneration. (A) The standard presentation of points of interest (red dots). (B‐C) Increasing magnification of the spectral‐domain optical coherence tomography scan shows the high‐resolution points of interest in specific retinal layers and structures.
Fig. 4
Fig. 4
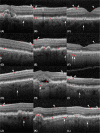
Visualization of points of interest in the retinal nerve fibre and choroid layers in spectral‐domain optical coherence tomography scans of age‐related macular degeneration. The figure shows points of interest (red dots) that the deep learning model OptiNet identified as markers of age‐related macular degeneration (AMD) during classification. The images (A)–(L) represent AMD cases from the validation partition that consisted of spectral‐domain optical coherence tomography scans that the deep learning model had not seen during training. Angled arrowheads show points of interest in the retinal nerve fibre layer, and vertical arrows show points of interest in the choroid layer.
Fig. 5
Fig. 5
ROC curves computed from the models of OptiNet trained on the A2A and NORPED data sets. (A) ROC curves calculated for all 10 models of OptiNet trained on the A2A data set. (B) ROC curves calculated for all 10 models of OptiNet trained on the NORPED data set. Each model has a randomly generated name, which is shown in the lower‐right corner of both figures. The mean ROC curve is identified as the solid line in the graph. Abbreviations: A2A = Age‐Related Eye Disease 2 Ancillary SD‐OCT study, NORPED = Norwegian Pigment Epithelial Detachment Study, ROC = receiver operating characteristic.
Fig. 6
Fig. 6
Visualization of points of interest in a control case. The points of interest (red dots) are mainly located in the layer of the retinal pigment epithelium and photoreceptors. The locations appear to overlap with the points of interest of age‐related macular degeneration because the deep learning model was trained to identify the disease, and convolutional neural network fixations are therefore limited to their visualization. The output probability in the deep learning model for control cases is <0.5.

References

    1. Apostolopoulos S, Ciller C, De Zanet SI, Wolf S & Sznitman R (2016): RetiNet: Automatic AMD identification in OCT volumetric data. arXiv preprint: arXiv:1610.03628.
    1. Bany M & Yeasin M (2021): Eigen‐CAM: visual explanations for deep convolutional neural networks. SN Comput Sci 2: 47.
    1. Budenz DL, Anderson DR, Varma R et al. (2007): Determinants of normal retinal nerve fiber layer thickness measured by Stratus OCT. Ophthalmology 114: 1046–1052. - PMC - PubMed
    1. Chen TC, Cense B, Pierce MC et al. (2005): Spectral domain optical coherence tomography: ultra‐high speed, ultra‐high resolution ophthalmic imaging. Arch Ophthalmol 123: 1715–1720. - PubMed
    1. Cho J, Lee K, Shin E, Choy G & Do S (2015): How much data is needed to train a medical image deep learning system to achieve necessary high accuracy?. arXiv preprint: arXiv:1511.06348.