

Pharmacological hypogonadism impairs molecular transducers of exercise-induced muscle growth in humans
- PMID: 35233984
- PMCID: PMC8977972
- DOI: 10.1002/jcsm.12843
Pharmacological hypogonadism impairs molecular transducers of exercise-induced muscle growth in humans
Abstract
Background: The relative role of skeletal muscle mechano-transduction in comparison with systemic hormones, such as testosterone (T), in regulating hypertrophic responses to exercise is contentious. We investigated the mechanistic effects of chemical endogenous T depletion adjuvant to 6 weeks of resistance exercise training (RET) on muscle mass, function, myogenic regulatory factors, and muscle anabolic signalling in younger men.
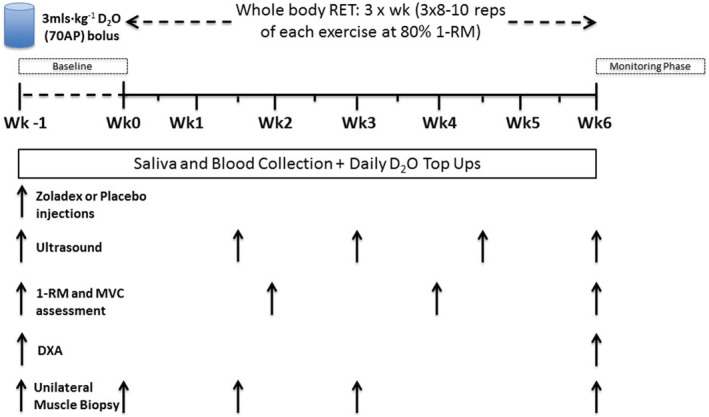
Methods: Non-hypogonadal men (n = 16; 18-30 years) were randomized in a double-blinded fashion to receive placebo (P, saline n = 8) or the GnRH analogue, Goserelin [Zoladex (Z), 3.6 mg, n = 8], injections, before 6 weeks of supervised whole-body RET. Participants underwent dual-energy X-ray absorptiometry (DXA), ultrasound of m. vastus lateralis (VL), and VL biopsies for assessment of cumulative muscle protein synthesis (MPS), myogenic gene expression, and anabolic signalling pathway responses.
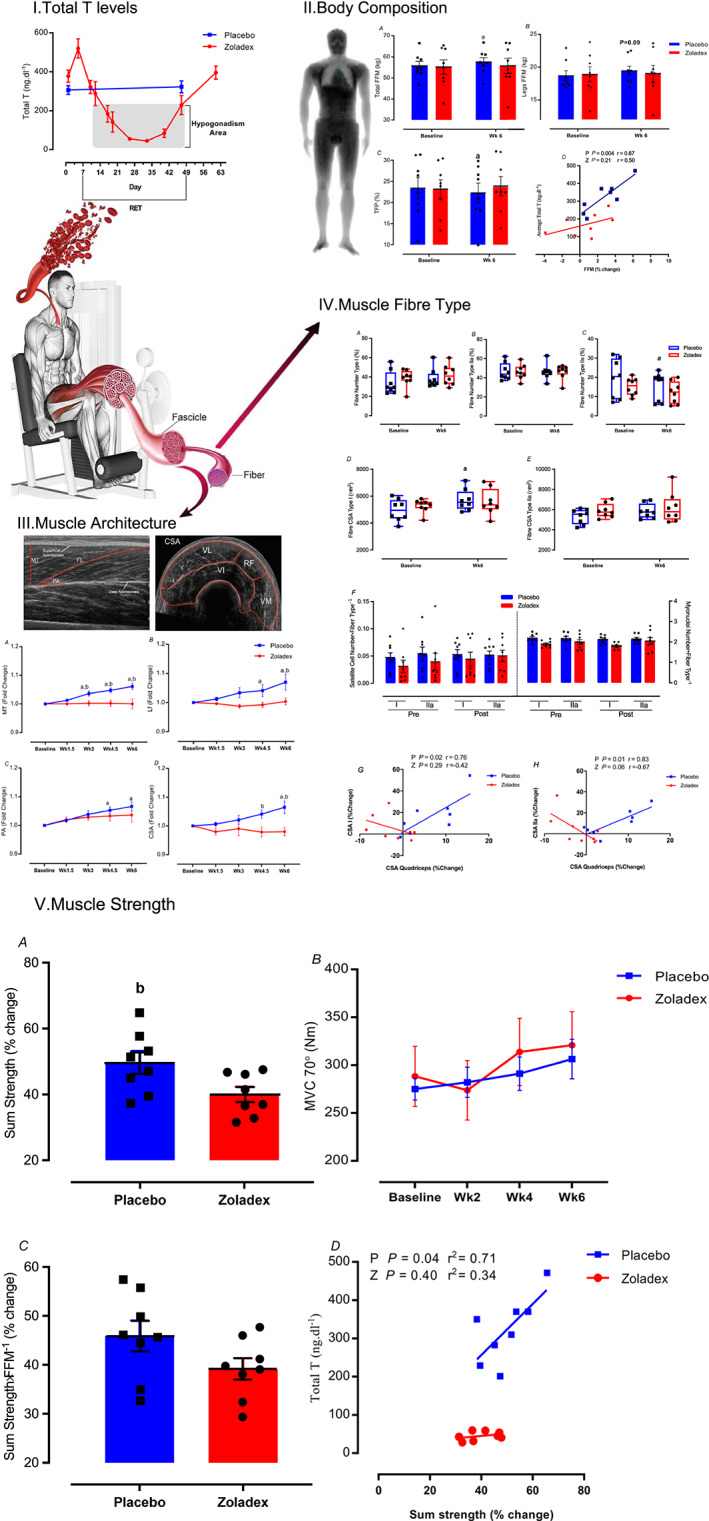
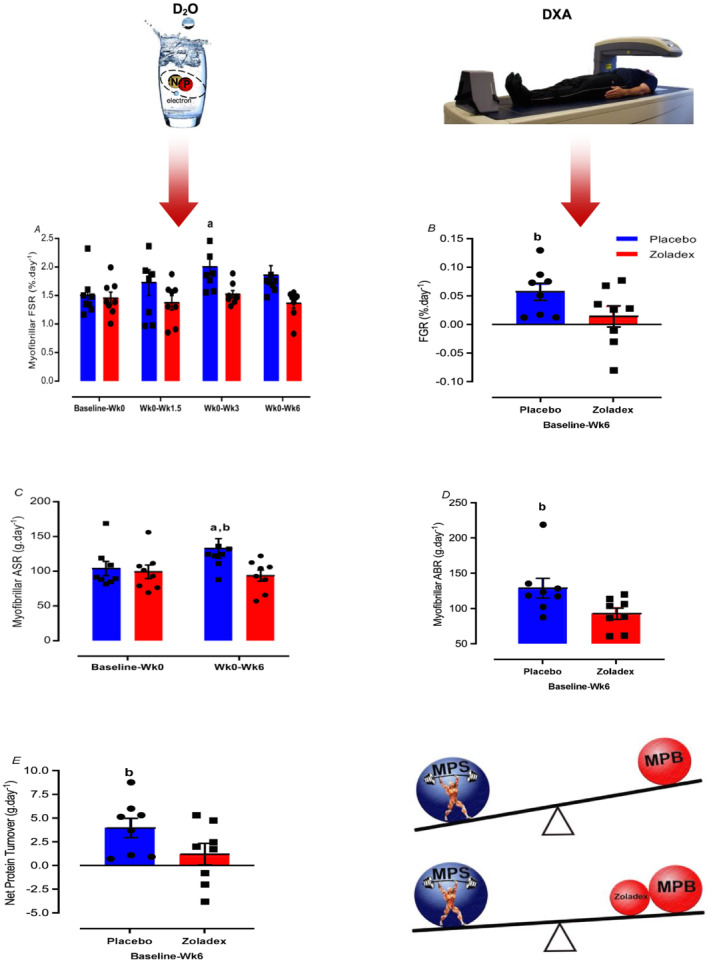
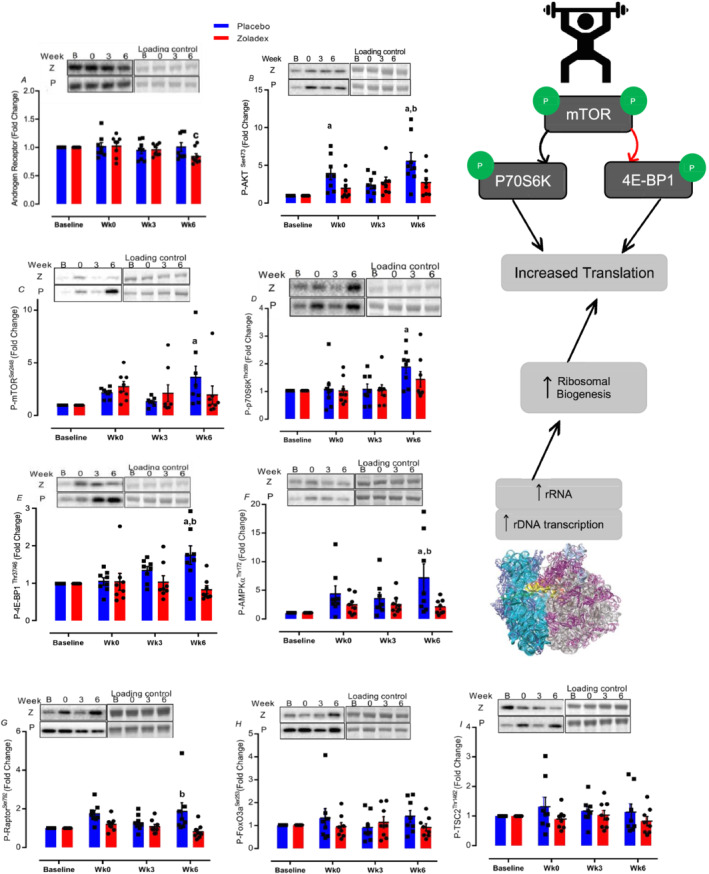
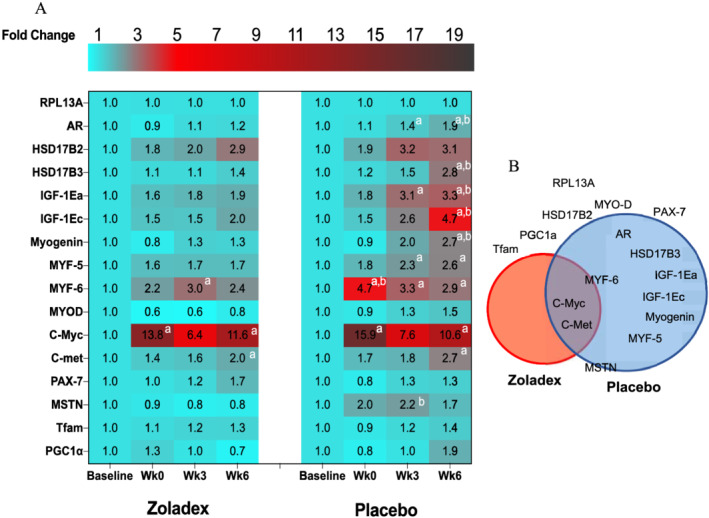
Results: Zoladex suppressed endogenous T to within the hypogonadal range and was well tolerated; suppression was associated with blunted fat free mass [Z: 55.4 ± 2.8 to 55.8 ± 3.1 kg, P = 0.61 vs. P: 55.9 ± 1.7 to 57.4 ± 1.7 kg, P = 0.006, effect size (ES) = 0.31], composite strength (Z: 40 ± 2.3% vs. P: 49.8 ± 3.3%, P = 0.03, ES = 1.4), and muscle thickness (Z: 2.7 ± 0.4 to 2.69 ± 0.36 cm, P > 0.99 vs. P: 2.74 ± 0.32 to 2.91 ± 0.32 cm, P < 0.0001, ES = 0.48) gains. Hypogonadism attenuated molecular transducers of muscle growth related to T metabolism (e.g. androgen receptor: Z: 1.2 fold, P > 0.99 vs. P: 1.9 fold, P < 0.0001, ES = 0.85), anabolism/myogenesis (e.g. IGF-1Ea: Z: 1.9 fold, P = 0.5 vs. P: 3.3 fold, P = 0.0005, ES = 0.72; IGF-1Ec: Z: 2 fold, P > 0.99 vs. P: 4.7 fold, P = 0.0005, ES = 0.68; myogenin: Z: 1.3 fold, P > 0.99 vs. P: 2.7 fold, P = 0.002, ES = 0.72), RNA/DNA (Z: 0.47 ± 0.03 to 0.53 ± 0.03, P = 0.31 vs. P: 0.50 ± 0.01 to 0.64 ± 0.04, P = 0.003, ES = 0.72), and RNA/ASP (Z: 5.8 ± 0.4 to 6.8 ± 0.5, P > 0.99 vs. P: 6.5 ± 0.2 to 8.9 ± 1.1, P = 0.008, ES = 0.63) ratios, as well as acute RET-induced phosphorylation of growth signalling proteins (e.g. AKTser473 : Z: 2.74 ± 0.6, P = 0.2 vs. P: 5.5 ± 1.1 fold change, P < 0.001, ES = 0.54 and mTORC1ser2448 : Z: 1.9 ± 0.8, P > 0.99 vs. P: 3.6 ± 1 fold change, P = 0.002, ES = 0.53). Both MPS (Z: 1.45 ± 0.11 to 1.50 ± 0.06%·day-1 , P = 0.99 vs. P: 1.5 ± 0.12 to 2.0 ± 0.15%·day-1 , P = 0.01, ES = 0.97) and (extrapolated) muscle protein breakdown (Z: 93.16 ± 7.8 vs. P: 129.1 ± 13.8 g·day-1 , P = 0.04, ES = 0.92) were reduced with hypogonadism result in lower net protein turnover (3.9 ± 1.1 vs. 1.2 ± 1.1 g·day-1 , P = 0.04, ES = 0.95).
Conclusions: We conclude that endogenous T sufficiency has a central role in the up-regulation of molecular transducers of RET-induced muscle hypertrophy in humans that cannot be overcome by muscle mechano-transduction alone.
Keywords: Exercise training; Hypertrophy; Muscle protein synthesis; Testosterone.
© 2021 The Authors. Journal of Cachexia, Sarcopenia and Muscle published by John Wiley & Sons Ltd on behalf of Society on Sarcopenia, Cachexia and Wasting Disorders.
Conflict of interest statement
The authors have declared that no conflict of interest exists.
Figures
References
Publication types
MeSH terms
Grants and funding
LinkOut - more resources
Full Text Sources
