. 2022 Nov;18(11):2327-2340.
doi: 10.1002/alz.12610. Epub 2022 Mar 2.

Role of chronic neuroinflammation in neuroplasticity and cognitive function: A hypothesis

Affiliations

Role of chronic neuroinflammation in neuroplasticity and cognitive function: A hypothesis

Daniela Lecca et al. Alzheimers Dement. 2022 Nov.

Abstract

Objective: Evaluating the efficacy of 3,6'-dithioPomalidomide in 5xFAD Alzheimer's disease (AD) mice to test the hypothesis that neuroinflammation is directly involved in the development of synaptic/neuronal loss and cognitive decline.

Background: Amyloid-β (Aβ) or tau-focused clinical trials have proved unsuccessful in mitigating AD-associated cognitive impairment. Identification of new drug targets is needed. Neuroinflammation is a therapeutic target in neurodegenerative disorders, and TNF-α a pivotal neuroinflammatory driver.

New hypothesis: AD-associated chronic neuroinflammation directly drives progressive synaptic/neuronal loss and cognitive decline. Pharmacologically mitigating microglial/astrocyte activation without altering Aβ generation will define the role of neuroinflammation in AD progression.

Major challenges: Difficulty of TNF-α-lowering compounds reaching brain, and identification of a therapeutic-time window to preserve the beneficial role of neuroinflammatory processes.

Linkage to other major theories: Microglia/astroglia are heavily implicated in maintenance of synaptic plasticity/function in healthy brain and are disrupted by Aβ. Mitigation of chronic gliosis can restore synaptic homeostasis/cognitive function.

Keywords: 3,6’-dithioPomalidomide; 5xFAD mice; Alzheimer pathology; TNF-α; amyloid hypothesis; microglial/astrocyte activation; neuroinflammation.


Conflict of interest statement

3,6’‐Dithiopomalidomide (3,6’‐DP) is protected under US Patent 8,927,725 to support its development for the treatment of neurodegenerative disorders. DT, WL and NHG are named inventors on this patent and have assigned all their rights to the National Institutes of Health (US Government), and hence have no ownership of 3,6’‐DP or other agents within US Patent 8,927,725. DSK is the founding scientist and CEO of Aevis Bio, Inc., and its US division AevisBio, Inc., which have a Cooperative Research and Development Agreement with the National Institute on Aging, National Institutes of Health, in relation to the evaluation of thalidomide analogs in preclinical models of neurodegenerative disorders. IH, YKK and SK are employees of Aevis Bio, Inc. All other authors declare that they have no competing interests.

Figures

FIGURE 1
FIGURE 1
3,6’‐DP and Pom bind cereblon, but 3,6’‐DP does not lower downstream neo‐substrates Ikaros, Aiolos, and SALL4. The binding of thalidomide analogs 3,6’‐DP and Pom (A) to cereblon was examined by using a cereblon/BRD3 binding FRET assay (B). An initial concentration‐dependent evaluation of binding between 3,6’‐DP, Pom, and cereblon provided an IC50 value of 1.635 and 3.074 μM, respectively. Based on this, degradation of the downstream neo‐substrates Ikaros and Aiolos was evaluated in MM.1S cells, and of SALL4 in Tera‐1 cells. (C) Concentration‐dependent challenge of MM.1S cells with Pom but not 3,6’‐DP resulted in a reduction in Ikaros (D) as well as Aiolos (E). Likewise, a concentration‐dependent challenge of Tera‐1 cells with Pom but not 3,6’‐DP (F and G) resulted in a decrease in SALL4. *P < .05, **P < .01, ****P < .0001, and NS (not significant) refer to the effects of treatments versus Control (Con). #P < .05, ##P < .01 refer to the effects of Pom versus 3,6’‐DP with the same concentration. Values are presented as mean ± S.E.M., of n observations (n = 2 or 3 per group)
FIGURE 2
FIGURE 2
3,6’‐DP and Pom mitigate inflammation in Aβ‐challenged primary cortical cell cultures, and LPS‐challenged rodents. (A) Mixed primary cortical cultures containing neurons and microglia were challenged with oligomeric Aβ (5μM) for 72 hours, and their inflammatory status was evaluated by OX‐41 immunostaining, demonstrating microglial activation that was ameliorated by 3,6’‐DP and Pom (3‐60 μM). (B) Neuronal survival was quantified in the presence and absence of 3,6’‐DP and Pom, as was (C) neurite number per cell. The addition of oligomeric Aβ (5 uM) to primary co‐culture resulted in a reduction in parameters. Pretreatment with 3,6’‐DP and Pom significantly mitigated these Aβ‐induced effects. Mean ± S.E.M. (n = 5‐6/group). *P < .05 versus the Aβ alone (red bar) group. Treatment of rodents in vivo challenged with LPS (1 mg/kg, i.p.) significantly elevated levels of proinflammatory cytokines, exemplified by TNF‐α in (D) plasma and (E) brain (hippocampus), as well as IL‐6 in (F) plasma and (G) brain (hippocampus). Pretreatment of animals with 3,6’‐DP or Pom (29.5 or 26.4mg/kg, i.p., respectively) significantly mitigated this LPS‐induced increase, thereby exhibiting their anti‐inflammatory action. *P < .05, **P < .01, ****P<.0001 refer to the effects of treatments versus LPS + vehicle. Values are presented as mean ± S.E.M., of n observations (n = 4‐5/group)
FIGURE 3
FIGURE 3
Aβ amyloid plaques, activated microglia, elevated expression of glial fibrillary acid protein (GFAP) associated with astrogliosis, and elevated proinflammatory cytokine levels are evident in 5xFAD Tg6799 C57BL6 female mice by 4‐months (mo) of age, particularly in cerebral cortex and dentate gyrus, and demonstrate a trend to age‐dependently increase. Aβ amyloid plaques: (A) Representative photomicrographs in dentate gyrus from 5xFAD mice of increasing age (4 to 8‐months) (white: Aβ amyloid plaques; blue: DAPI [nucleus]). (A1) Quantification of the percent brain area covered by Aβ amyloid plaques across age in dentate gyrus (DG) and (A2) cerebral cortex (CTX). Activated microglia: (B) Representative photomicrographs of Iba1 expression in cerebral cortex from WT (wild type) and 5xFAD mice of increasing age (4 to 8 months). (C) Co‐localization of Iba1 positive cells with Aβ amyloid plaques in the cerebral cortex of 6 mo 5xFAD mice (red: Iba1 [microglia]; blue: DAPI [nucleus]; white: Aβ amyloid plaques). (B1) Quantification of the percent brain area covered by Iba1 positive cells across age in dentate gyrus (DG) and (B2) cerebral cortex (CTX). GFAP‐associated astrocytosis: (D) Representative photomicrographs of GFAP expression in cerebral cortex from WT and 5xFAD mice of increasing age (4 to 8 months). (E) Co‐localization of GFAP positive cells with Aβ amyloid plaques in the cerebral cortex of 6 mo 5xFAD mice (green: GFAP [astroglia]; blue: DAPI [nucleus]; white: Aβ amyloid plaques). (D1) Quantification of the percent brain area covered by GFAP positive cells across age in dentate gyrus (DG) and (D2) cerebral cortex (CTX). Pro‐inflammatory cytokines: (F1) TNF‐α, (F2) IL‐1β and (F3) IL‐6 levels were quantified in hippocampal brains samples from WT and 5xFAD 4‐, 6‐, and 8‐month‐old mice, and were found to change age‐dependently. Protein loading concentration = 200 μg. *P < .05, **P < .01, ***P <.001, and ****P < 0.0001 for 5xFAD mice versus WT control (cntl) mice. * P < .05, **** P < .0001 for comparison to 5xFAD 4 mo mice. Values are presented as mean ± S.E.M., of n observations (n = 4‐5 per group)
FIGURE 4
FIGURE 4
3,6’‐DP and Pom were well tolerated and the former mitigated behavioral impairments in 5xFAD mice following 4 months treatment. (A) Weekly body weights were no different between 5xFAD mice administered vehicle (1% CMC in 0.9% saline) and those provided a systemic daily dose of 3,6’‐DT (29.5 mg/kg) or Pom (26.4 mg/kg). (B) Composite behavioral score in a naïve cohort of 8 to 10‐month‐old female 5xFAD mice and wild‐type littermates. Composite behavioral score was derived by combining behavioral measures depicted in panels E‐G below. ***P < .001, Student's t‐test. (C) Composite behavioral score in a separate cohort of mice following 4 months of daily drug administration. (D) Sample tracks of mice in first 30 seconds of exploration in the open field test. (E) Latency for mice to visit each of the four corners of apparatus. (F) Percent of distance traveled that was in the center zone of the open field. (G) Spontaneous alternation behavior in the Y‐maze. **P < .01 5xFAD veh versus WT veh groups, * P < .05 5xFAD veh versus 5xFAD 3,6’‐DP groups, ** P < .01 5xFAD veh versus 5xFAD 3,6’‐DP groups by one‐way ANOVA followed by Dunnett's post‐hoc tests
FIGURE 5
FIGURE 5
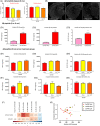
3,6’‐DP and Pom mitigate brain inflammation in 5xFAD mice, and abate synaptic loss and neurodegeneration. (A) Microglial activation was evaluated by Iba1 immunohistochemistry in both hippocampus and cerebral cortex across WT vehicle (Veh) and 5xFAD animals treated with Veh, 3,6’‐DT (29.5mg/kg) or Pom (26.4mg/kg) i.p. daily for 4 months. (A1) Quantification of Iba1 total area occupied as a percent of the WT Veh group, (A2) representative photomicrographs (scale bar = 30 μm). (B) Microglial activation was additionally evaluated in relation to (B1) Iba1 immunoreactivity (IR) per cell, as well as by their morphology into activated (pink) versus quiescent (blue) phenotypes (B2). (C) Gliosis was evaluated by GFAP immunohistochemistry in hippocampus and cerebral cortex across groups. (C1) Quantification of GFAP as a percent of brain area occupied, (C2) representative photomicrographs (scale bar = 30 μm). (D) Dendritic/synaptic loss was evaluated immunohistochemically with postsynaptic density protein 95 (PSD‐95) in hippocampus and cerebral cortex across groups. (D1) Quantification of the number of PSD‐95+ dendritic spines/μm, (D2) representative images showing PSD‐95+ spines (green) in MAP2+ dendrites (scale bar = 3 μm). (E) Neurodegeneration was evaluated by Fluoro‐Jade C (FJC) staining in hippocampus and cerebral cortex across animal groups. (E1) The total number of FJC‐(+) cells/area of equal neuroanatomical selected areas were calculated for three brain sections per sample. (E2) Representative images of FJC staining (20×, tile scan over entire area of the brain section, scale bar = 1 mm). *P < .05, **P < .01, ***P < .001, ****P < .0001 versus WT Veh group; * P < .05, ** P < .01 versus 5xFAD Veh group by one‐way ANOVA followed by Dunnett's post‐hoc test. (n = 4‐5/group)
FIGURE 6
FIGURE 6
3,6’‐DP and Pom mediated mitigation of neuroinflammation, neuronal, and synaptic loss, and improved behavioral outcome in 5xFAD mice occur in the absence of actions on amyloid plaque and Aβ burden. Aβ plaque load was evaluated by immunohistochemistry using a polyclonal anti‐β‐amyloid antibody (Cell Signaling, #24545) in both hippocampus and cerebral cortex across WT vehicle (Veh) (no activity and not shown) and 5xFAD animals treated with Veh, 3,6’‐DT (29.5 mg/kg) or Pom (26.4 mg/kg) i.p. daily for 4 months. (A) Quantification of Aβ plaque total area occupied, (B) representative photomicrographs. There was no statistical difference across groups (P > .05). Brain (cerebral cortex) Aβ peptide concentrations were quantified by ELISA for both Aβ42 and Aβ40 forms across age (4 to 8 mo) as well as by treatment. (C) By age: Aβ42 (C1) and Aβ40 (C2) levels increased age‐dependently, as evaluated at 4 through 8 months. A greater elevation in Aβ42 levels resulted in an increase in the Aβ 42/40 concentration ratio at 8 versus 4 months. **P < .01, ****P < .0001 versus 4 mo group (n = 4‐5/group). Protein loading concentration = 25 μg. (D, E) By treatment (initiated at 4 mo age and dosed to and evaluated at 8 mo): No statistically significant differences were evident either in soluble Aβ42 (D1) and Aβ40 (D2) or in insoluble Aβ42 (E1) and Aβ40 (E2) levels across treatment groups (Veh, 3,6’‐DT (29.5mg/kg) or Pom (26.4mg/kg) i.p. daily for 4 months). The ratios of the Aβ 42/40 forms were calculated in the soluble (D3) and insoluble (E3) fractions, and likewise, were not statistically different across treatment groups (P > .05, n = 4‐5/group). Protein loading concentration for detection of soluble Aβ = 25 μg. Protein loading concentration for detection of insoluble Aβ = 1μg. (F) Correlation matrix for all seven amyloid‐related measurements (columns) assessed within 5xFAD Veh only mice (top row) or all 5xFAD mice (bottom row). Pearson correlation coefficient is indicated by panel color, with legend at bottom. Number within each panel indicates P‐value for each comparison. (G) Scatterplot of composite behavioral score versus cortical soluble Aβ40. Red line is best‐fit line for 5xFAD veh group only; dashed gray line is fit for all 5XFAD mice

References

    1. Mullard A. Landmark Alzheimer's drug approval confounds research community. Nature. 2021;594:309‐310. 10.1038/D41586-021-01546-2 - DOI - PubMed
    1. Thambisetty M, Howard R, Glymour MM, Schneider LS. Alzheimer's drugs: does reducing amyloid work? Science. 2021;374:544‐545. 10.1126/SCIENCE.ABL8366 - DOI - PubMed
    1. Selkoe DJ. Treatments for Alzheimer's disease emerge. Science. 2021;373:624‐626. 10.1126/SCIENCE.ABI6401 - DOI - PubMed
    1. Hebert LE, Weuve J, Scherr PA, Evans DA. Alzheimer disease in the United States (2010‐2050) estimated using the 2010 census. Neurology. 2013;80:1778‐1783. 10.1212/WNL.0b013e31828726f5 - DOI - PMC - PubMed
    1. Cummings J, Feldman HH, Scheltens P. The “rights” of precision drug development for Alzheimer's disease. Alzheimers Res Ther. 2019;11:76. 10.1186/s13195-019-0529-5 - DOI - PMC - PubMed

Publication types

Substances