. 2022 Mar 31;19(2):10.1088/1741-2552/ac59a3.
doi: 10.1088/1741-2552/ac59a3.

Concurrent stimulation and sensing in bi-directional brain interfaces: a multi-site translational experience

Affiliations

Concurrent stimulation and sensing in bi-directional brain interfaces: a multi-site translational experience

Juan Ansó et al. J Neural Eng. .

Abstract

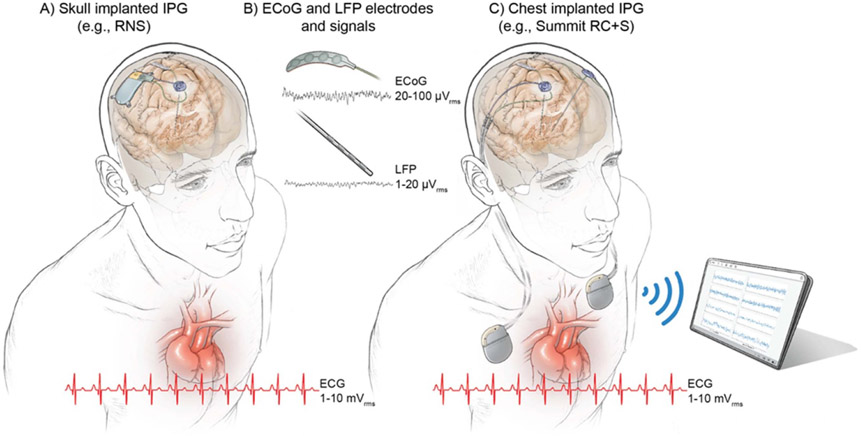
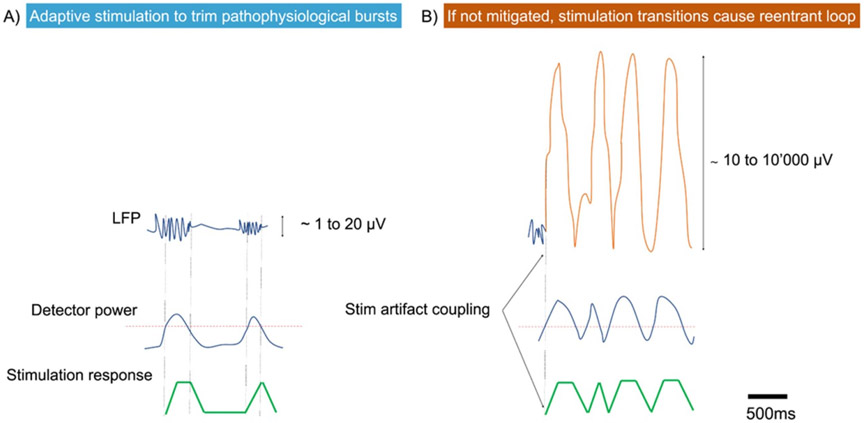
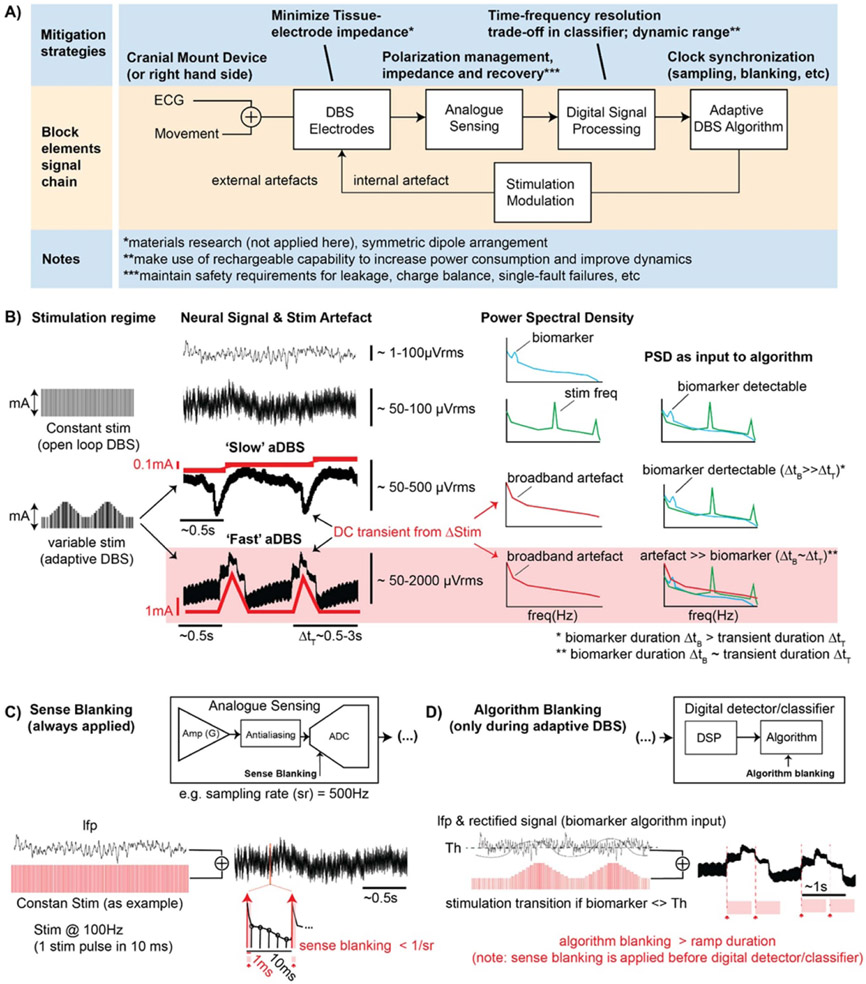
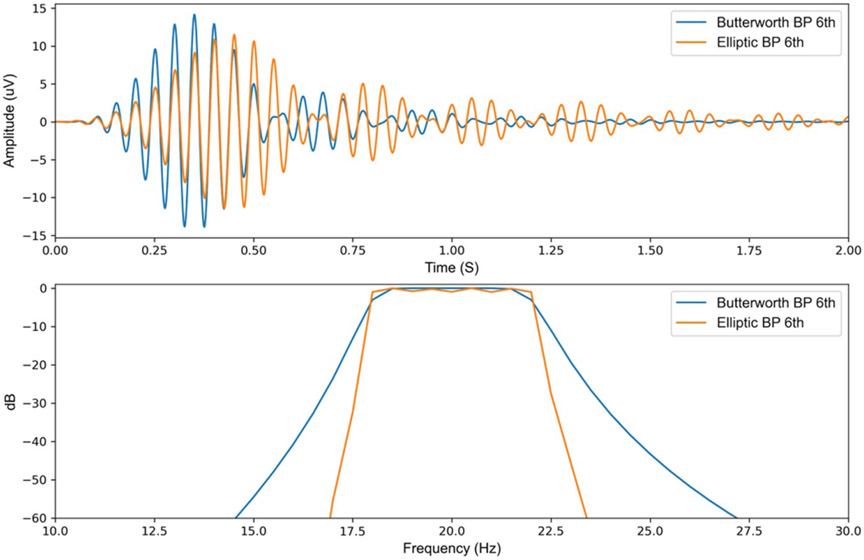
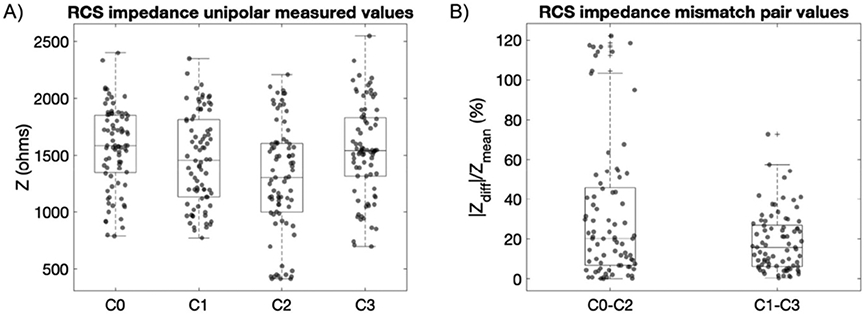
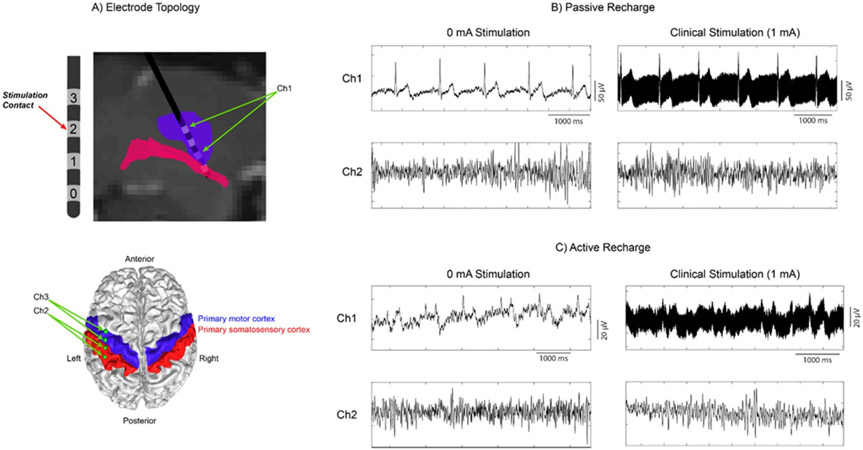
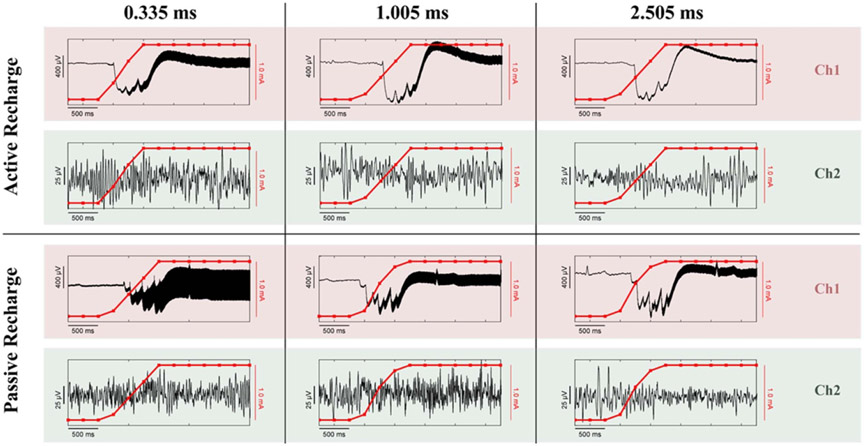
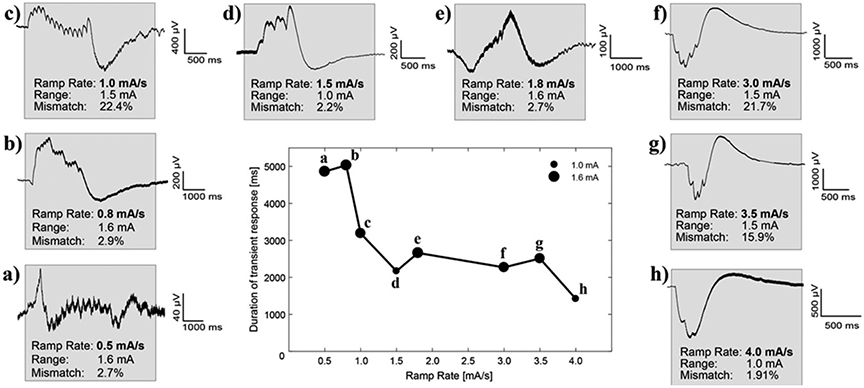
Objective. To provide a design analysis and guidance framework for the implementation of concurrent stimulation and sensing during adaptive deep brain stimulation (aDBS) with particular emphasis on artifact mitigations.Approach. We defined a general architecture of feedback-enabled devices, identified key components in the signal chain which might result in unwanted artifacts and proposed methods that might ultimately enable improved aDBS therapies. We gathered data from research subjects chronically-implanted with an investigational aDBS system, Summit RC + S, to characterize and explore artifact mitigations arising from concurrent stimulation and sensing. We then used a prototype investigational implantable device, DyNeuMo, and a bench-setup that accounts for tissue-electrode properties, to confirm our observations and verify mitigations. The strategies to reduce transient stimulation artifacts and improve performance during aDBS were confirmed in a chronic implant using updated configuration settings.Main results.We derived and validated a 'checklist' of configuration settings to improve system performance and areas for future device improvement. Key considerations for the configuration include (a) active instead of passive recharge, (b) sense-channel blanking in the amplifier, (c) high-pass filter settings, (d) tissue-electrode impedance mismatch management, (e) time-frequency trade-offs in the classifier, (f) algorithm blanking and transition rate limits. Without proper channel configuration, the aDBS algorithm was susceptible to limit-cycles of oscillating stimulation independent of physiological state. By applying the checklist, we could optimize each block's performance characteristics within the overall system. With system-level optimization, a 'fast' aDBS prototype algorithm was demonstrated to be feasible without reentrant loops, and with noise performance suitable for subcortical brain circuits.Significance. We present a framework to study sources and propose mitigations of artifacts in devices that provide chronic aDBS. This work highlights the trade-offs in performance as novel sensing devices translate to the clinic. Finding the appropriate balance of constraints is imperative for successful translation of aDBS therapies.Clinical trial:Institutional Review Board and Investigational Device Exemption numbers: NCT02649166/IRB201501021 (University of Florida), NCT04043403/IRB52548 (Stanford University), NCT03582891/IRB1824454 (University of California San Francisco). IDE #180 097.

Keywords: adaptive deep brain stimulation; algorithms; artifacts; chronic implant; closed loop; embedded; neural sensing.


Conflict of interest statement

Conflict of interest

JA and RG have worked for Rune Labs Inc. since September 2021. SL is a scientific advisor to Rune Labs Inc. and has received reimbursement for educational activities for Medtronic. Bronte-Stewart serves on a clinical advisory board for Medtronic PLC. TD has received funding for educational activities by Medtronic PLC, has stock ownership in Bioinduction Ltd and Amber Therapeutics, has consulted with Synchron, Cortec Neuro, and Amber Therapeutics.

Figures

Figure 1.
Figure 1.
Configurations of chronic implanted sensing pulse generators and sense electrodes. (A) Example of a skull implanted internal pulse generator (IPG) (e.g. RNS, NeuroPace Inc.), (B) example of quadripolar ECoG and DBS leads and ranges of neural signals (LFPs running a few microvolts and ECoG signals ranging a few tens of microvolts). (C) Example of an aDBS system that is implanted in the cervical space (or chest cavity); in this example the Summit RC + S (Medtronic) investigational system. The heart anatomy is shown along with representation of ten cycles of the cardiac signal with amplitude range × 1000 the neural signals (millivolt instead of microvolt). Notice the close location of chest implanted IPGs (C) to the heart, which may influence leakange of ECG artifacts into the neural signal. ECG artifact is avoided in skull mounted IPGs (a).
Figure 2.
Figure 2.
‘Ideal’ versus ‘reentrant loop’ (or ‘self-triggering’) scenarios during ‘fast’ aDBS: (A) ‘Ideal’: stimulation is triggered by an increase in amplitude or power of the predefined biomarker bandpass LFP signal. (B) ‘Reentrant loop’ or ‘self triggering’: the onset of stimulation as response to the first detection of the biomarker signal results in a transient response due to the stimulation ramp or stimulation transitions coupled in the sensed signal. The contaminated LFP signal increases detector power and, if not mitigated, may result in false-detection and the detector will go into reentrant loop or ‘self-triggered’ stimulation, not responsive to physiological changes.
Figure 3.
Figure 3.
Signal chain diagram and summary of mitigation strategies of a generic aDBS system. (A) In the top row (light blue), proposed mitigation strategies to artifact susceptibility through signal chain. In the middle row (orange) the block diagram of key signal chain elements, with possible artifacts due to external triggers, such as ECG signal and movement artifacts; or due to stimulation. (B) Stimulation regimes: constant stimulation (e.g. 2 mA and 130 Hz) or varying stimulation following biomarker variations (aDBS). Rate of change in amplitude is defined by the stimulation ramp rate, with ‘slow’ ramps ranging 0.1–1 mA s−1 and ‘fast’ ramps from 1 to 10 mA s−1. Variable stimulation amplitude (red time-varying traces) results in transient step responses contaminating the LFP in the neighborhood of the stimulation electrode (black time-varying traces). Examples of biomarker signature (blue), stimulation artifact (green), and broadband artifact due to stimulation ramp (red) for a frequency-based detector/classifier. (C) Sense blanking is part of the analog chain and is always synchronously applied following the stimulation clock for a duration in the order of a few milliseconds (≫duration of stimulation pulse). By blanking the analog sense channel for a duration of ~ms the artifact in the sense channel due to the stimulation pulse can be rejected while the LFP signal is not missed. Typically the sense blanking duration falls in the order of the time between consecutive samples (1/sampling rate). Sense blanking is applied continuously, during both constant stimulation and adaptive stimulation. (D) Algorithm blanking is part of the digital chain and is synchronously applied to an algorithm detection event (e.g. biomarker input crosses predefined threshold Th). Algorithm blanking is defined with a certain duration based on biomarker physiology time/frequency dynamics and device specifications. By applying algorithm blanking to the input signal of the detector, the aDBS algorithm is blanked for that duration (hundred milliseconds to few seconds; typically at least for the duration of the stimulation ramp). By selecting appropriate algorithm blanking values, stimulation transition artifacts can be mitigated and detector performance improved. However, setting algorithm blanking parameters may be challenging for ‘fast’ aDBS because the duration of stimulation transients and time/frequency dynamics of the biomarker (e.g. beta band) converge at time scales of 1 s or less.
Figure 4.
Figure 4.
Comparison between a 6th order Butterworth and elliptic bandpass filters, both with a bandwidth of 18–22 Hz (A) 1 mV Impulse response of the two bandpass filters to illustrate the difference in settling time and ringing of the filters in the time domain. (B) Frequency response of the two bandpass filter to illustrate the difference in frequency specificity of the two filters.
Figure 5.
Figure 5.
Subcortical impedances measured with the RC + S system in a group of movement disorders patients (7 STN, 4 GP, 2 dystonia) represented as absolute unipolar and percentage difference mismatch between paired electrodes. (A) Distribution of single measurement points of each subcortical electrode contact referenced to the IPG case, with a range of variability from 500 to 2500 ohms. (B) Impedance mismatch of a subcortical electrode pair defined as the absolute difference of the impedance of each contact divided by the mean value between them. Electrode pairs are defined as those capable of providing a symmetric sense dipole around a monopolar stimulation contact. With a quadripolar subcortical lead, this leads to stimulation contacts C1 or C2 with subsequently symmetric sense pair electrodes C0–C2 or C1–C3. By pairing electrodes in this manner, calculated impedance mismatches were 20.2% (75th percentile 45.7%) for C0–C2 and 15.8% (75th percentile 26.9%) for C1–C3. Note that the outliers observed in C0-C2 (panel (B)) could be due the large range of variability between C0 and C2 (panel (A)). This large variability can be expected due to: (a) the different target electrode locations (STN or GP), (b) the use of different electrode lead models (geometry of STN electrode lead differs from GP lead), and (c) the impedance variability of intrinsic anatomical target regions due to different brain conductivity media (in the GP contact C2 is placed at the intersection of the GPe and GPi (gray and white matter), see supplementary material figure S1).
Figure 6.
Figure 6.
ECG and high frequency stimulation artifacts during concurrent stimulation and sensing with the bidirectional neural interface (Sumit RC + S, Medtronic) in a patient with ET. (a) Electrode placement within the VIM, and cortical strip placement over the primary motor/somatosensory cortices (Ch1 subcortical channel and Ch2, Ch3 cortical channels). (b) Recording during passive recharge at 0 mA and clinical stimulation levels, at Ch1 (subcortical channel) and Ch2 (cortical channel). Passive recharge utilizes a square pulse followed by a long-term small-amplitude charge in the opposite polarity. (c) Recording during active recharge using the same amplitudes and channels as (b). Active recharge sends sequential symmetric square pulses with opposite polarities, balancing the charge in a shorter time period.
Figure 7.
Figure 7.
Comparison of the effect of waveform and sense blanking values on DC transient artifacts during ramping and high frequency stimulation artifacts. Every combination of waveform/sense blanking values contains both a depth channel (Ch1) and a cortical channel (Ch2) for comparison of near-field and far-field recording contacts, respectively. Each panel depicts the time-domain signal as a black line, and the current amplitude of the device while ramping up in red.
Figure 8.
Figure 8.
Duration of transient response as a function of ramp rate and amplitude range from in vivo testing (subjects ID1,2, supplementary materials table S2). The center panel shows the total time from the start of the ramping period until the signal returns to a steady state. The range of the amplitude (from the minimum value to the maximum value) is denoted by the size of the marker. (A)–(H) Sub-panels surrounding the central panel are ordered based on their ramp rate. The gray box highlights when the ramping starts, on the left edge, and when the signal returns to approximately steady state, on the right edge. Within each sub-panel is displayed the ramp rate of the run, the total range the amplitude oscillates between, and the measured impedance mismatch between the bipolar recording channels as a percentage.
Figure 9.
Figure 9.
Step response artifact on LFP signal during ‘fast’ stim ramping at 10 mA s−1. A 2 s segment of subcortical LFP recorded from pallidum of a PD patient for three different DBS settings: (A) DBS OFF, (B) DBS ON, and (C): ‘fast aDBS’. For each DBS state (column), the top row is the LFP time domain, middle row the band pass filtered signal and the bottom row is the PSD of the 2 s segment. Sandwiched sense configuration (C1 and C3 around stim contact C2). Stimulation 0–3 mA in 300 ms (ramp up = ramp down), 150 Hz frequency, 90 us. (A) DBS OFF: no neural stimulation which results in maximal amplitude of biomarker oscillation, ~10 microvolts peak (top (A) panel). (B) DBS ON: therapeutic open-loop stimulation (cathodic monopolar stim in C2 relative to IPG in chest, 3 mA, 149.3 Hz, 90 μs). (C) ‘Fast’ aDBS algorithm: top panel shows a time segment of raw LFP signal aligned with a time-varying stimulation amplitude (stimulation ramp 0–3 mA and 3–0 mA in 300 ms).
Figure 10.
Figure 10.
DyNeuMo-2 benchtop and saline test results. (A) Transient response results of RC-R network with 680 nF–1.47 μF capacitor mismatch. (B) Transient response results of RC-R network with 1–2.2 μF capacitor mismatch. (C) Saline test transient response with 1:1 electrode no surface area mismatch. (D) Saline test transient response with 2:1 electrode surface area mismatch.
Figure 11.
Figure 11.
Implementation of ‘fast’ aDBS in a chronically implanted patient with RC + S using optimal settings. (A) Input power feature to detector (blue trace) and corresponding transitions of stimulation current (orange trace) following power threshold crossing (dashed black line). (B) The linear discriminant LD0 (blue trace) is the averaged output of the power (blue trace is the average of 2 FFT power values in (A)). The algorithm blanking segment (lockout period) of 550 ms at the onset of a threshold cross (states 0–2 and 2–0) is depicted with a red rectangle. The detection state (orange trace) changes value with threshold crosses of LD0, with state 2 indicating a detector increase, state 1 (‘hold’) indicating LD0 within thresholds (in case upper and lower threshold) and state 0 indicating a detector decrease below threshold event. Note: after second 8, the sudden stimulation transition from high to low creates a prominent increase in power, with algorithm blanking of 550 ms or shorter (e.g. 250 ms, duration of the ramp) sufficing to avoid reentrant loop.
Figure 12.
Figure 12.
1 mV impulse response of a 6th order Butterworth with 1 and 5 Hz envelope detection filter.

References

    1. Fountas KN and Smith JR 2007. A novel closed-loop stimulation system in the control of focal, medically refractory epilepsy Acta Neurochir. Suppl 97 357–62 - PubMed
    1. Stanslaski S et al. 2018. A chronically implantable neural coprocessor for investigating the treatment of neurological disorders. IEEE Trans. Biomed. Circuits Syst 12 1230–45 - PMC - PubMed
    1. Herron J, Linde D, Chouinard T, Isaacson B, Stanslaski S, Bourget D, Adamski T and Denison T 2018. Embedding adaptive stimulation algorithms for a new implantable deep-brain stimulation research tool 2018 IEEE Biomedical Circuits and Systems Conf (Biocas) pp 1–4
    1. Ruoff L, Jarosiewicz B, Zak R, Tcheng TK, Neylan TC and Rao VR 2020. Sleep disruption is not observed with brain-responsive neurostimulation for epilepsy Epilepsia Open 5 155–65 - PMC - PubMed
    1. Toth R et al. 2020. DyNeuMo Mk-2: an investigational circadian-locked neuromodulator with responsive stimulation for applied chronobiology 2020 IEEE Int. Conf. on Systems, Man, and Cybernetics (SMC) pp 3433–40 - PMC - PubMed

Publication types