. 2022 Mar 4;8(9):eabl9155.
doi: 10.1126/sciadv.abl9155. Epub 2022 Mar 2.

A general pattern of trade-offs between ecosystem resistance and resilience to tropical cyclones

Affiliations

A general pattern of trade-offs between ecosystem resistance and resilience to tropical cyclones

Christopher J Patrick et al. Sci Adv. .

Abstract

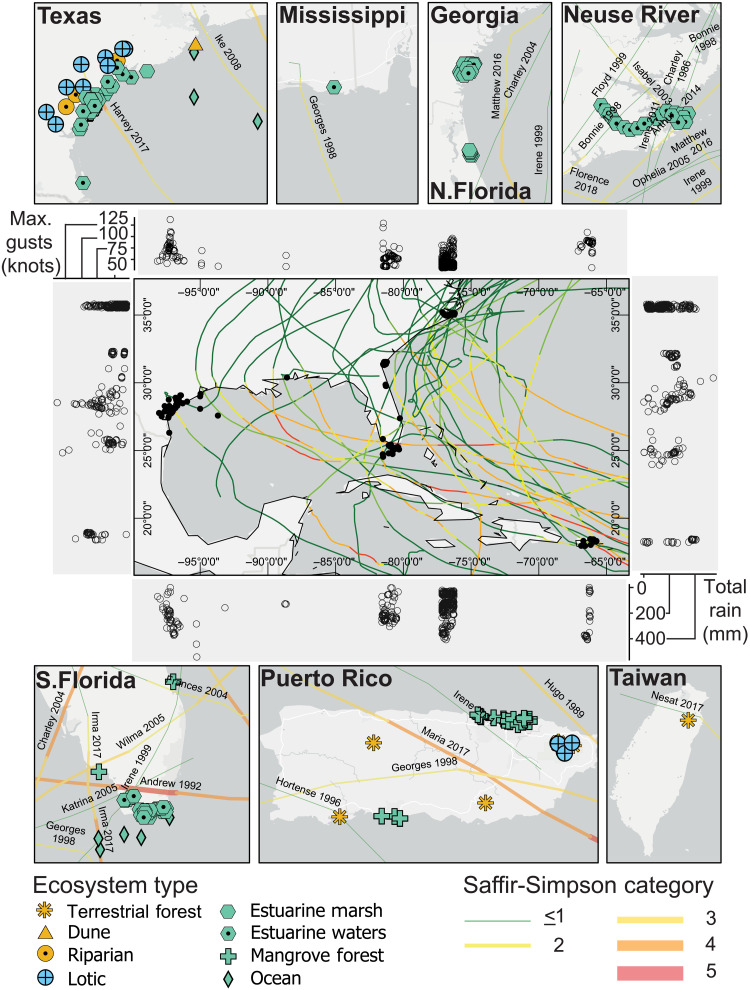
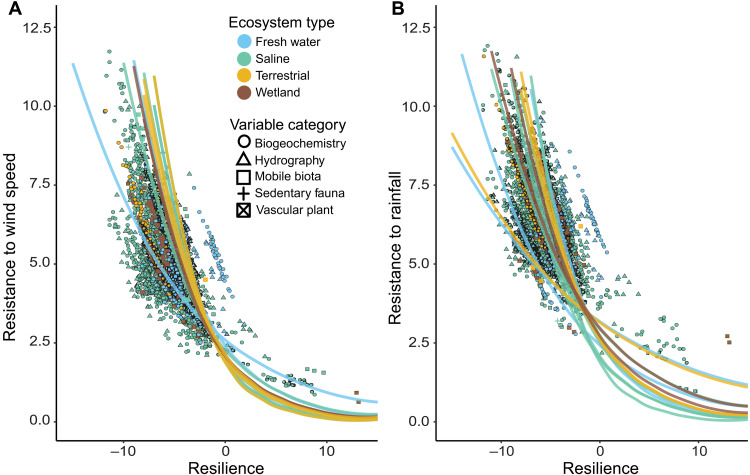
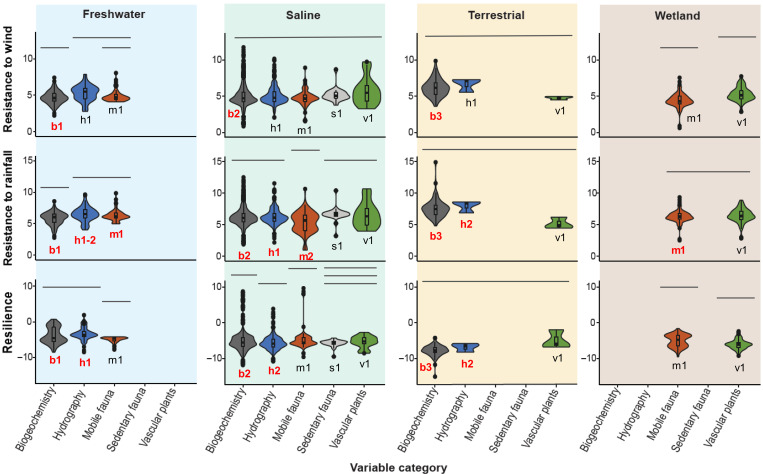
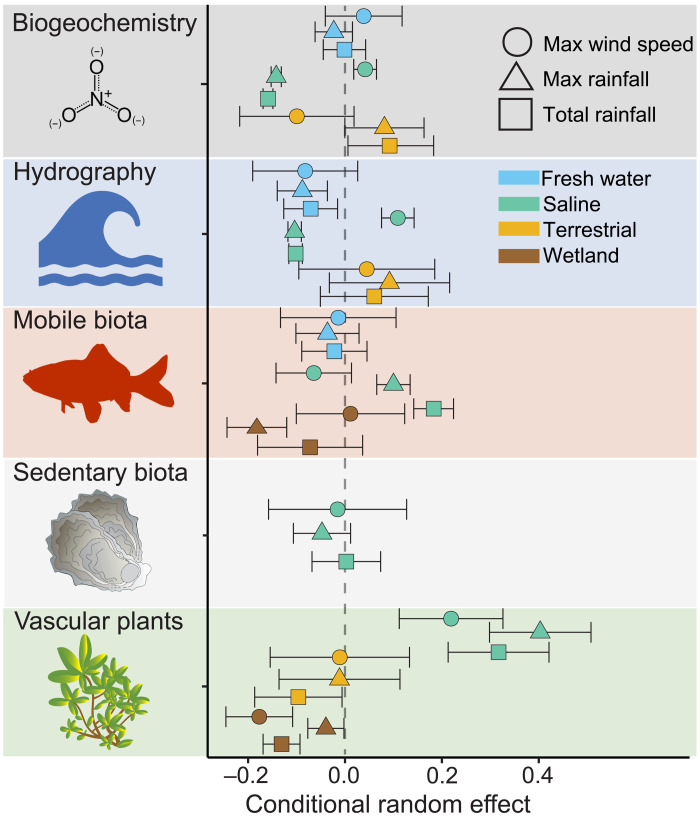
Tropical cyclones drive coastal ecosystem dynamics, and their frequency, intensity, and spatial distribution are predicted to shift with climate change. Patterns of resistance and resilience were synthesized for 4138 ecosystem time series from n = 26 storms occurring between 1985 and 2018 in the Northern Hemisphere to predict how coastal ecosystems will respond to future disturbance regimes. Data were grouped by ecosystems (fresh water, salt water, terrestrial, and wetland) and response categories (biogeochemistry, hydrography, mobile biota, sedentary fauna, and vascular plants). We observed a repeated pattern of trade-offs between resistance and resilience across analyses. These patterns are likely the outcomes of evolutionary adaptation, they conform to disturbance theories, and they indicate that consistent rules may govern ecosystem susceptibility to tropical cyclones.


Figures

Fig. 1.
Fig. 1.. Map of sites with storm tracks and ecosystem types studied.
Middle panel is all site (dots) and storm track (lines) except data from Taiwan. Bordering center panels are cumulative rainfall values (bottom, right) and max wind speed (left, top) by longitude and latitude.
Fig. 2.
Fig. 2.. Relationships between resistance to wind or rain and resilience among ecosystem and variable types.
Ecosystem types, ecosystem processes, and flora and fauna all demonstrate negative covariation between resilience and (A) resistance to wind speed and (B) resistance to rainfall. Metrics are on a natural log scale and should be considered unitless for simple interpretation and viewed in relative terms from low to high. Each graph displays the stability summary metrics calculated from each time series labeled by ecosystem (color) and variable category (shape). Best fit lines shown include the relationships for each group-variable category combination in the varying slope and intercept model with line color indicating ecosystem type.
Fig. 3.
Fig. 3.. Comparison of resistance and resilience among variable categories within ecosystem types.
Columns correspond to ecosystem type, rows correspond to response metric, and colors denote variable category. Violin plots show the distribution of data within each group, while inset box plots show the median, quartiles, and outliers (points). Bars over each plot indicate which variables are not significantly different from one another within ecosystems. Alphanumeric labels under each violin plot indicate which variable categories were significantly different among ecosystems (columns). Letter denotes variable category (e.g., b = biogeochemistry, h = hydrography, m = mobile fauna, s = sedentary fauna, v = vascular plants). Number denotes rank, with different numbers across plots (e.g., b1 versus b2) indicating a significant difference. Red text indicates that for the response variable (row) and the indicated variable category (letter), we observed significant differences among ecosystem types (table S4).
Fig. 4.
Fig. 4.. Relationship between storm metrics (total rainfall, max rainfall, and max wind speed) and resistance among ecosystems within each variable category.
Points display the conditional random effect (x axis) of each storm metric (shape) on each variable category (row) in each ecosystem (color) from the respective mixed effects models for each storm metric. Error bars are the conditional standard deviations of the random effect.

References

    1. Costanza R., Pérez-Maqueo O., Martinez M. L., Sutton P., Anderson S. J., Mulder K., The value of coastal wetlands for hurricane protection. Ambio 37, 241–248 (2008). - PubMed
    1. B. Crossett, K. Ache, P. Pacheco, K. Haber, "National Coastal Population Report, Population Trends from 1970 to 2020" (US Department of Commerce, 2013).
    1. Neumann B., Vafeidis A. T., Zimmermann J., Nicholls R. J., Future coastal population growth and exposure to sea-level rise and coastal flooding - a global assessment. PLOS ONE 10, e0118571 (2015). - PMC - PubMed
    1. Wang S., Toumi R., Recent migration of tropical cyclones toward coasts. Science 371, 514–517 (2021). - PubMed
    1. Knutson T., Camargo S. J., Chan J. C. L., Emanuel K., Ho C.-H., Kossin J., Mohapatra M., Satoh M., Sugi M., Walsh K., Wu L., Tropical cyclones and climate change assessment: Part II: Projected response to anthropogenic warming. Bull. Am. Meteorol. Soc. 101, E303–E322 (2020).