. 2022 Mar 4;8(9):eabn2070.
doi: 10.1126/sciadv.abn2070. Epub 2022 Mar 2.

Mitochondria in cone photoreceptors act as microlenses to enhance photon delivery and confer directional sensitivity to light

Affiliations

Mitochondria in cone photoreceptors act as microlenses to enhance photon delivery and confer directional sensitivity to light

John M Ball et al. Sci Adv. .

Abstract

Mammalian photoreceptors aggregate numerous mitochondria, organelles chiefly for energy production, in the ellipsoid region immediately adjacent to the light-sensitive outer segment to support the high metabolic demands of phototransduction. However, these complex, lipid-rich organelles are also poised to affect light passage into the outer segment. Here, we show, via live imaging and simulations, that despite this risk of light scattering or absorption, these tightly packed mitochondria "focus" light for entry into the outer segment and that mitochondrial remodeling affects such light concentration. This "microlens"-like feature of cone mitochondria delivers light with an angular dependence akin to the Stiles-Crawford effect (SCE), providing a simple explanation for this essential visual phenomenon that improves resolution. This new insight into the optical role of mitochondria is relevant for the interpretation of clinical ophthalmological imaging, lending support for the use of SCE as an early diagnostic tool in retinal disease.


Figures

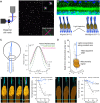
Fig. 1.
Fig. 1.. Isolated cone photoreceptor ellipsoids focus incident light.
(A) Cone mitochondria in dorsal GS retina. Left: Cone photoreceptor anatomy in an immunolabeled vertical section. The arrow indicates the junction between the IS and cell body. Right: Top-down flat-mount view of TMRE-labeled mitochondria in live photoreceptors. RCVRN, recoverin. (B) Horizontal sectioning and imaging of light transmission through agarose-embedded retinas. (C) Top-down view of light concentration in a 3D Z-stack by photoreceptors in retinas sectioned as in (B). MitoTracker localizes to mitochondria; CellTracker is sequestered within the cytoplasm following internalization. In the orthogonal vertical projection through the image stack, note the absence of CellTracker labeling where the cone myoid region would ordinarily be expected [dashed line; compare to (A)]. The arrow indicates the direction of light transmission. (D) Quantification of light concentration factors in three exemplary cones. Flat-mount TMRE view is a maximum projection; the LED image is a single plane near the peak concentration intensity. Orthogonal projection comes from the bracketed cones. Panels (1) to (4) depict features of light concentration at the depths indicated. Graph shows the relative light intensity (concentration factor) for the three cones (individual and average) as a function of depth from the distal IS tip in the 1.5-μm-diameter OS region (OSR; top cone, dashed line; see Materials and Methods). TMRE signal is arbitrarily scaled for comparison.
Fig. 2.
Fig. 2.. Cone mitochondrial structural changes correlate with hibernation-induced decreases in light gathering.
(A) Serial block-face electron microscopy (SBEM) images of GS cone mitochondria. Vertical and horizontal images are software projections. (B) Example reconstructions (segmented 3D models and skeletonizations) of all mitochondria from sample cones. (C) Morphological quantification of reconstructed mitochondria. Data shown as means ± SD. Statistical comparison not performed here (see Materials and Methods). MT, mitochondria. (D) Quantification of mitochondrial alignment from skeletons. The diagram depicts the scheme for measuring mitochondria branch orientation at an example cone height h [see (B)]. The graph shows histograms (means ± SD; shaded regions) of mitochondrial deviation angles throughout reconstructed cones. (E) Experimental light concentration comparison for active versus hibernating GS cones (see Fig. 1). The scatterplot shows cone focal points and means ± SD for each condition. Violin plot shows the distributions of average light concentration in the OSR and the 99% confidence interval (CI) of the difference in means (see Materials and Methods for a detailed explanation of statistics). Act, active; Hib, hibernating.
Fig. 3.
Fig. 3.. Electromagnetic simulations of light concentration by GS cone mitochondria.
(A) 2D schematic of the 3D FDTD simulation framework. (B) Example light concentration by a reconstructed cone from active GS. From left to right: Intact, without mitochondria, and mitochondria only. The dashed shape depicts approximate OSR. (C) Quantification of simulated light focusing. The top graph depicts light concentration factor profiles for simulations shown in (B). Bar graphs show aggregate measures across all reconstructions (n = 9). Values are means ± SD; wavy lines indicate apparent focal lengths that fell beyond the upper boundary of the simulation volume (>10 μm). *P < 0.05, ***P < 0.001.
Fig. 4.
Fig. 4.. Enhanced light gathering by mitochondria in simulations of active compared to hibernating GS cones.
(A) Quantification of light concentration in simulations of active versus hibernating GS cones. Profile shows the increase in light versus baseline intensity within a 1.5-μm-diameter range of the central cone axis as a function of depth. The shaded regions indicate the SDs from the mean across the indicated condition. Bar graphs compare measures of focusing between active (n = 5) and hibernating (n = 4) GS cone simulations. (B) Comparison of example simulations concerning isolated mitochondria with cell membrane and cytoplasm removed. (C) Quantification of light concentration measures for simulations with only mitochondria versus those with cell membrane and cytoplasm but devoid of mitochondria. Wavy lines indicate focal lengths for simulations whose apparent focal points lay beyond the simulation bounds (i.e., >10 μm).
Fig. 5.
Fig. 5.. Simulated Stiles-Crawford–like directionality of light concentration by GS cone mitochondria.
(A) Reproduction of an inverted image plane (slit mask) at the focal points of cone ellipsoids. The image is the overlaid result of two separate acquisitions with the mask reversed before the second acquisition. (B) Conceptual illustration of angle-dependent concentration of light upon the cone OS. (C) Diagram of the SCE and directionality. Angular dependence of light focusing shown here in GS is overlaid upon directionality tuning curves based on measurements in human SCE (45, 67, 68) and turtle cone light responses (15). (D) Schematic of the directionality calculation for cone light concentration in 3D space (see Materials and Methods). (E) Directionality of simulated light concentration in the OSR by GS cones. Left: Example simulations with models tilted by the indicated angles. Overlay shows the simulations rotated in register with one another in different colors for comparison. Graph shows the directionality fit analysis [compare to (C)] across simulations for all cone models (three angles per cone model). (F) Reduced directionality of simulated cone light concentration without mitochondria.
Fig. 6.
Fig. 6.. Experimental demonstration of SCE-like angular dependence of light concentration by isolated ellipsoids.
(A) Concentration by cone mitochondria along the axis of light incidence. Annotations are simplified angle measurements in the 2D plane used here only for illustration, whereas angle measurements shown in (C) were performed in 3D space. (B) Example images with cones featuring short average focal lengths (i; “short f”) versus long average focal lengths (ii; “long f”). (C) Directionality measures for the cones for the example images shown in (C). Note the stronger directionality demonstrated by cones in the short f sample. (D) A strong correlation between mean focal length and apparent directionality (calculated ρ) across GS samples.

References

    1. Frazier A. E., Kiu C., Stojanovski D., Hoogenraad N. J., Ryan M. T., Mitochondrial morphology and distribution in mammalian cells. Biol. Chem. 387, 1551–1558 (2006). - PubMed
    1. Hoang Q. V., Linsenmeier R. A., Chung C. K., Curcio C. A., Photoreceptor inner segments in monkey and human retina: Mitochondrial density, optics, and regional variation. Vis. Neurosci. 19, 395–407 (2002). - PubMed
    1. Spaide R. F., Curcio C. A., Anatomical correlates to the bands seen in the outer retina by optical coherence tomography: Literature review and model. Retina 31, 1609–1619 (2011). - PMC - PubMed
    1. Ingram N. T., Fain G. L., Sampath A. P., Elevated energy requirement of cone photoreceptors. Proc. Natl. Acad. Sci. U.S.A. 117, 19599–19603 (2020). - PMC - PubMed
    1. Wong-Riley M., Energy metabolism of the visual system. Eye Brain 2, 99–116 (2010). - PMC - PubMed