. 2022 Mar 1;38(9):110443.
doi: 10.1016/j.celrep.2022.110443.

Recruitment of DNA to tumor-derived microvesicles

Affiliations

Recruitment of DNA to tumor-derived microvesicles

James W Clancy et al. Cell Rep. .

Abstract

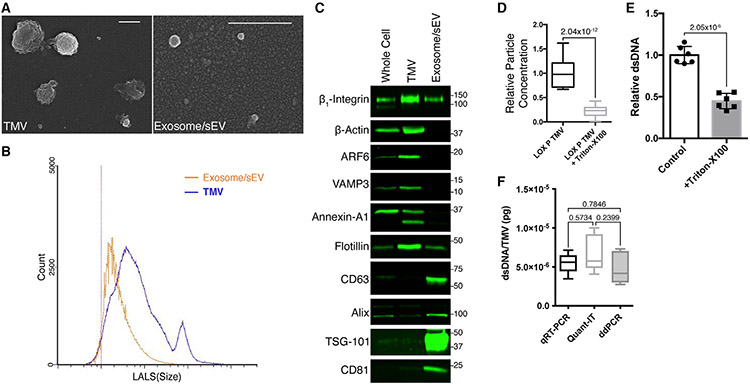
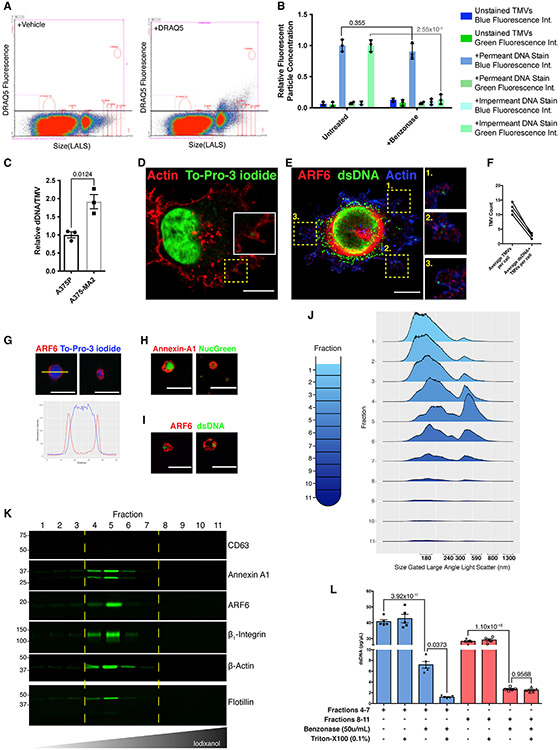
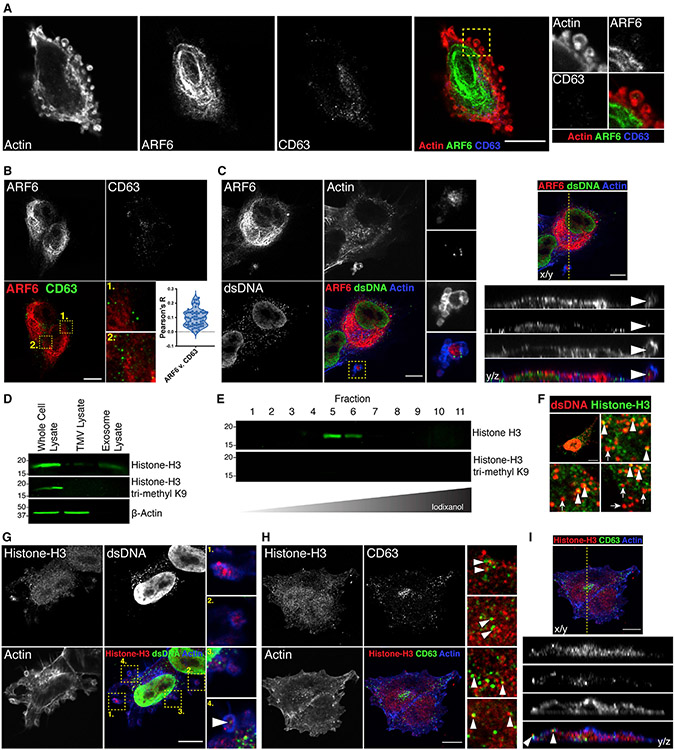
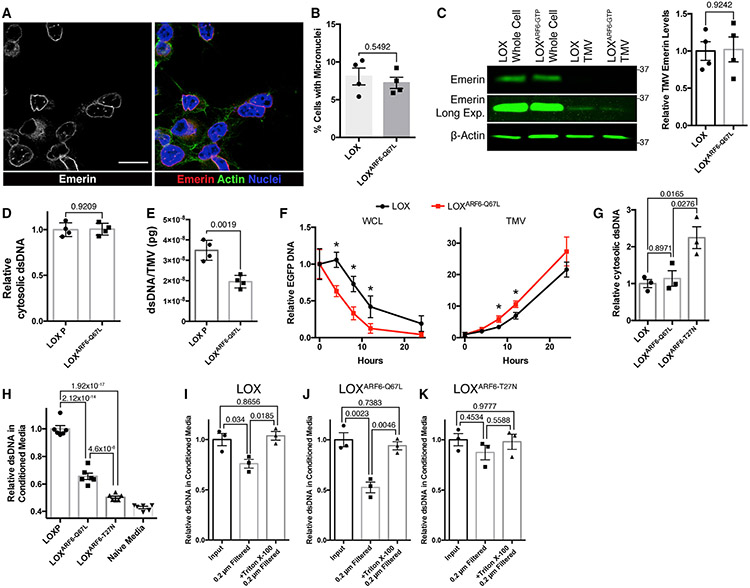
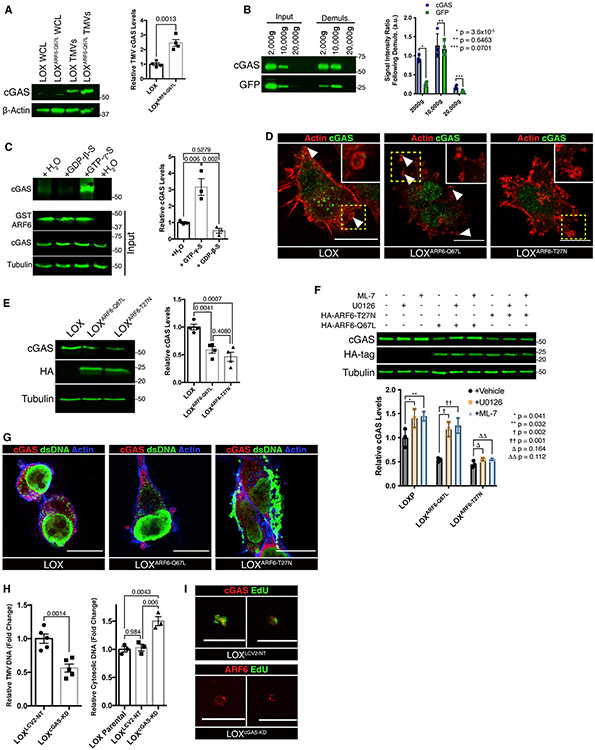
The shedding of extracellular vesicles (EVs) represents an important but understudied means of cell-cell communication in cancer. Among the currently described classes of EVs, tumor-derived microvesicles (TMVs) comprise a class of vesicles released directly from the cell surface. TMVs contain abundant cargo, including functional proteins and miRNA, which can be transferred to and alter the behavior of recipient cells. Here, we document that a fraction of extracellular double-stranded DNA (dsDNA) is enclosed within TMVs and protected from nuclease degradation. dsDNA inclusion in TMVs is regulated by ARF6 cycling and occurs with the cytosolic DNA sensor, cGAS, but independent of amphisome or micronuclei components. Our studies suggest that dsDNA is trafficked to TMVs via a mechanism distinct from the multivesicular body-dependent secretion reported for the extracellular release of cytosolic DNA. Furthermore, TMV dsDNA can be transferred to recipient cells with consequences to recipient cell behavior, reinforcing its relevance in mediating cell-cell communication.

Keywords: ARF6; cGAS; extracellular DNA; extracellular vesicles; microvesicles.


Conflict of interest statement

Declaration of interests The authors declare no competing interests.

Figures

Figure 1.
Figure 1.. Tumor microvesicles (TMVs) are distinct from exosomes, and contain DNA
(A) TMVs and exosomes were isolated from LOX melanoma cells and allowed to adhere to poly-l-lysine-coated coverslips. Following fixation and dehydration, the vesicles were sputter coated and subjected to scanning electron microscopy. Scale bars, 500 nm. (B) TMVs and exosomes were isolated from conditioned media of LOX melanoma cells by serial centrifugation. The isolated EV pools were then resuspended in 0.1-μm filtered PBS, analyzed by flow cytometry, and the data displayed as histograms for the individual fractions. (C) TMVs and exosomes were isolated from conditioned media as described in Method details. Equal amounts of protein lysates from whole cells, TMVs, and exosomes were then separated by SDS-PAGE and the cargo contents were examined by western blotting. (D) Isolated TMVs were incubated at 37°C for 2 h with or without 0.1% Triton X-100. Vesicles were then isolated from the mixture as described in Method details, and particle concentrations measured by flow cytometry. The data are presented as means, with whiskers indicating maximum and minimum values. n = 18. The p value was obtained by an unpaired 2-tailed t test. (E) dsDNA was isolated from TMVs treated with benzonase, or bBenzonase + 0.1% Triton X-100. DNA was then quantified by the Qubit fluorometer. Detergent disruption reduces the amount of recoverable DNA. The data are presented as means ± SDs. n = 6. The p value was obtained by an unpaired 2-tailed t test. (F) Absolute quantification by qRT-PCR, Quant-IT high-sensitivity dsDNA assay, and digital PCR confirms the presence of dsDNA within benzonase-treated TMVs. The data are presented as means, with whiskers indicating maximum and minimum values. n = 6. The p value was obtained by 1-way ANOVA.
Figure 2.
Figure 2.. TMV genomic DNA is membrane protected and associated with TMV protein markers
(A) TMVs were isolated from conditioned media and stained with the cell-permeant dsDNA dye DRAQ-5 or vehicle control. Fluorescent TMVs (containing dsDNA) were then detected by flow cytometry and plotted as size versus fluorescent intensity. Vehicle control used to determine baseline autofluorescence in DRAQ-5 channel. (B) Control or benzonase-treated TMVs were stained with either the cell-permeable blue fluorescing dsDNA dye or the impermeable green fluorescing dye as described in Method details. Stained TMVs were then analyzed by flow cytometry, demonstrating the significant reduction in the number of vesicles carrying external DNA, stained with the impermeable dye, following treatment with benzonase. The data are presented as means ± SDs. n = 3. The p values were obtained by unpaired 2-tailed t tests for each independent condition. (C) DNA isolated from an equivalent number of TMVs (measured by flow cytometry) shed by the paired primary and metastatic melanoma cell lines A375P and A375-MA2 was quantified by Quant-IT high-sensitivity dsDNA assay. The data are presented as means ± SDs. n = 3. The p values were obtained by unpaired 2-tailed t tests. (D) LOX cells were fixed and stained as indicated. Confocal microscopy reveals the inclusion of dsDNA, stained with To-Pro-3 iodide, within budding TMVs. (E and F) LOX cells were fixed and stained using a monoclonal antibody against dsDNA (E). Staining pattern reveals the inclusion of dsDNA as cargo within nascent TMVs, quantified in (F). (G–I) TMVs isolated and treated with benzonase as described in Method details were overlaid onto poly-l-lysine-coated coverslips. These coverslips were then fixed, stained as indicated, and analyzed by confocal microscopy. The line plot in (G) shows the peak of To-Pro-3 iodide signal within the membrane. (J) EVs isolated from iodixanol gradient fractions were analyzed by micro-flow cytometry. Ridge plot of histograms shown for each of the 11 fractions. (K) EVs isolated from iodixanol gradient fractions were lysed, separated by SDS-PAGE, and EV content examined by western blotting. (L) Genomic DNA was isolated from pooled EV fractions recovered following iodixanol gradient centrifugation and indicated nuclease treatments. DNA content was quantified by qRT-PCR as outlined in Method details. The data are presented as means ± SEMs. n = 5. The p value was obtained by ANOVA with Sidak’s correction for multiple comparisons. Scale bars, 10 μm (D and E); 5 μm (F–I).
Figure 3.
Figure 3.. TMV DNA is not associated with amphisome markers
(A) LOX melanoma cells were fixed and stained to examine the intracellular localization of ARF6 (green) and CD63 (blue). CD63 is not detected at the cell periphery in nascent TMVs (inset). (B) Intracellular pools of ARF6 (red) and CD63 (green) were imaged by confocal microscopy and colocalization measured using Pearson’s R (n = 20 cells from n = 3 biological replicates). (C) LOX cells were fixed and stained as indicated. Confocal microscopy reveals the inclusion of dsDNA, together with ARF6, within budding TMVs. (D) TMVs and exosomes were isolated from conditioned media as described previously. Equal amounts of protein lysates from whole cells, TMVs, and exosomes were then separated by SDS-PAGE and histone H3 content was examined by western blotting. (E) EVs isolated from iodixanol gradient fractions were lysed, separated by SDS-PAGE, and histone H3 and trimethyl H3K9 content examined by western blotting. (F) Histone H3 and dsDNA contents were examined by confocal microscopy in shedding melanoma cells. Histone near the nucleus co-labels with dsDNA (arrowheads), while punctate histone H3 nearer the cell periphery does not (arrows). (G) Histone H3 and dsDNA contents were examined in nascent TMVs by immunofluorescence. Only a small pool of TMV-associated histone co-labels for dsDNA (arrowhead inset). (H) Amphisome markers histone H3 and CD63 content were examined by immunofluorescence. Similar to previously published reports, histone H3 and CD63 can be identified juxtaposed where they are likely to reside within the same late endosomal structure (arrowheads). (I) Orthogonal view of histone H3 and CD63 immunofluorescent image reveals co-trafficking of histone H3 and CD63 to the cell periphery where they are released without containment within TMVs. Scale bars, 10 μm.
Figure 4.
Figure 4.. TMVs represent a mechanism of DNA efflux that is independent of micronuclei formation
(A) LOX cells were fixed and stained for the inner nuclear membrane protein emerin to monitor for the presence of micronuclei. Scale bar, 25 μm. (B) Percentage of LOX or LOXARF6-Q67L cells containing micronuclei were counted. The data represent 450 cells across 4 independent biological replicates and are presented as means ± SDs. n = 4. The p value was obtained by an unpaired 2-tailed t test. (C) Whole-cell lysate and TMV lysates were generated from LOX and LOXARF6-Q67L cells. Equal amounts of protein lysates from whole cells and TMVs were then separated by SDS-PAGE and the emerin content was examined by western blotting. The relative TMV emerin content was quantified and graphed. The data are presented as means ± SDs. n = 4. The p value was obtained by an unpaired 2-tailed t test. (D) Cytosolic DNA was isolated from LOX and LOXARF6-Q67L cells. Isolated DNA was then quantified by Quant-iT high-sensitivity dsDNA assay according to the manufacturer’s instructions. The data are presented as means ± SDs. n = 4. The p value was obtained by an unpaired 2-tailed t test. (E) DNA isolated from TMVs shed from LOX or LOXARF6-Q67L cells was analyzed by qRT-PCR, and the quantity of DNA per TMV determined by absolute quantitation using control human genomic DNA. The data are presented as means ± SDs. n = 4. The p value was obtained by an unpaired 2-tailed t test. (F) EGFP cDNA was transfected into LOX or LOXARF6-Q67L melanoma cells actively shedding TMVs. Following incubation with EV-free media for the times indicated, TMVs were isolated as described in Method details, and EGFP DNA within whole cells or TMVs was quantified by qRT-PCR. The data are presented as means ± SDs. n = 3. The p value was obtained by an unpaired 2-tailed t test with Bonferonni’s correction for multiple comparisons. (G) Cytosolic DNA was isolated from LOX, LOXARF6-Q67L, and LOXARF6-T27N cells. Isolated DNA was then quantified using the Quant-iT high-sensitivity dsDNA kit. The data are presented as means ± SDs. n = 3. The p value was obtained by ANOVA with Sidak’s correction for multiple comparisons. (H) Total dsDNA content was measured in media conditioned by LOX, LOXARF6-Q67L, and LOXARF6-T27N cells, following 24-h incubation in EV-free media. DNA quantification was determined by the Quant-iT high-sensitivity dsDNA kit. The data are presented as means ± SDs. n = 6. The p value was obtained by ANOVA with Sidak’s correction for multiple comparisons. (I–K) Total dsDNA content was measured in media conditioned by LOX, LOXARF6-Q67L, and LOXARF6-T27N cells, following 24-h incubation in EV-free media. BeforeDNA quantification, media was subjected to 0.2 μm filtration alone or following 60-min incubation with 0.1% Triton X-100. DNA was then quantified by the Quant-iT high-sensitivity dsDNA kit and relative amounts of dsDNA were graphed. For each panel, the data are presented as means ± SDs. n = 3. The p value was obtained by ANOVA with Sidak’s correction for multiple comparisons.
Figure 5.
Figure 5.. ARF6 and cGAS coordinate DNA delivery to TMVs
(A) TMVs were isolated from LOX and LOXARF6-Q67L cells and lysed. Equal amounts of TMV protein were separated by SDS-PAGE and probed for cGAS content by western blotting. Relative TMV cGAS levels were quantified and graphed. The data are presented as means ± SDs. n = 4. The p value was obtained by an unpaired 2-tailed t test. (B) Equal numbers of large EVs were divided, with half being subjected to demulsification to monitor for the presence of cGAS liquid phase droplets. Following repeated cycles of freezing and heating, vesicle pellets were re-isolated and both cGAS and cytosolic GFP levels were examined by western blotting. The data are presented as means ± SDs. n = 3. The p value was obtained by an unpaired 2-tailed t test. (C) cGAS preferentially binds active, GTP-bound ARF6 in vitro. Recombinant GST-WT-ARF6 conjugated beads were incubated with melanoma cell lysate in the presence of 100 μM GTP-γ-S, 1 mM GDP-β-S, or vehicle control, for 60 min at 37° C. Bound proteins were then precipitated, separated by SDS-PAGE for western blotting, and relative amounts of co-precipitating cGAS were quantified. The data are presented as means ± SDs. n = 4. The p value was obtained by ANOVA with Sidak’s correction for multiple comparisons. (D) Immunofluorescence was used to examine the localization of endogenous cGAS in LOX, LOXARF6-Q67L, and LOXARF6-T27N cells. In parental and LOXARF6-Q67L cells, cGAS can be found at the cell periphery, where it is incorporated into shedding TMVs. Scale bars, 15 μm. (E) Equal amounts of whole-cell lysate from LOX, LOXARF6-Q67L, and LOXARF6-T27N cells were separated by SDS-PAGE, and relative amounts cGAS were quantified by western blotting. The data are presented as means ± SDs. n = 4. The p value was obtained by ANOVA with Sidak’s correction for multiple comparisons. (F) Whole-cell lysates from LOX, LOXARF6-Q67L, and LOXARF6-T27N cells treated for 6 h with ML-7, U0126, or vehicle control were separated by SDS-PAGE, and relative amounts of cGAS were quantified by western blotting. The data are presented as means ± SDs. n = 3. The p value was obtained by ANOVA with Sidak’s correction for multiple comparisons. (G) Endogenous cGAS and dsDNA were examined by immunofluorescence. Dominant inhibition of ARF6 by ARF6(T27N) expression results in the accumulation of large, intracellular puncta containing both dsDNA and cGAS. Imaging parameters result in the overexposure of intracellular aggregates in LOXARF6-T27N cells. See Figure S5D for alternate exposure. Scale bars, 15 μm. (H) Total dsDNA content was measured in TMVs isolated from LOXLCV–NT or LOXcGAS–KD cells (left), or from cytosol of LOX, LOXLCV–NT, or LOXcGAS–KD cells (left). DNA quantification was determined by the Quant-iT high-sensitivity dsDNA kit. The data are presented as means ± SEMs. n = 5 (TMVs) or 3 (cytosol). The p value was obtained by t test (TMVs) or ANOVA with Sidak’s correction for multiple comparisons (cytosol). (I) TMVs were isolated from EdU-labeled LOXLCV–NT or LOXcGAS–KD cells and fixed to poly-l-lysine-coated coverslips as described in Method details. TMVs were fixed, stained, and imaged by confocal microscopy. Scale bar, 10 μm.
Figure 6.
Figure 6.. TMVs transfer dsDNA to recipient cells, leading to protein expression and behavioral changes
(A) Using absolute quantification by qRT-PCR, SRY genomic DNA was identified and measured within TMVs treated with benzonase or co-treated with Triton X-100. The data are presented as means, with whiskers indicating maximum and minimum values. n = 9. The p value was obtained by an unpaired 2-tailed t test. (B) Total RNA was isolated from 3 benzonase-treated independent pools of LOX, TMVs, or LNCaP cells. SRY mRNA was then examined by RT-PCR. (C) SRY protein was examined by western blot in lysates from whole cells or isolated TMVs from the male cell lines DU145 or LOX. (D) SRY genomic DNA is reduced when measured by qRT-PCR on equal numbers of benzonase-treated TMVs from LOX or LOXcGAS–KD cells. The data are presented as means, with whiskers indicating maximum and minimum values. n = 6. The p value was obtained by an unpaired 2-tailed t test. (E) SRY genomic DNA can be detected by qRT-PCR in female mammary cell lines, MDA-MB-231, or MCF-10A, following incubation with male (LOX) TMVs. Maximal threshold cycle (Ct) count for each qRT-PCR run was set to 40, and SRY was undetected in untreated MDA-MB-231 or MCF-10A cells. The data are presented as means ± SDs. n = 5. The p value was obtained by an unpaired 2-tailed t test. (F) SRY protein can be detected by western blotting in female cell lines, MDA-MB-231, or MCF-10A, when incubated with LOX TMVs. (G) Incubation with LOX TMVs increases growth rate in MCF-10A cells, while loss of cGAS mitigates this increase. The data are presented as means ± SDs for each time point. n = 8. The p value was obtained by the Wilcoxon rank-sum test. (H) Treatment with LOX TMVs leads to SRY protein expression and increases anchorage-independent growth as measured by mammosphere sphere-forming efficiency. The data are presented as means, with whiskers indicating maximum and minimum values. n = 12. The p value was obtained by an unpaired 2-tailed t test. Scale bar, 75 μm. (I) SRY shRNA reduces TMV-mediated changes to anchorage-independent growth as measured by mammosphere sphere-forming efficiency and blocks expression of SRY protein in mammosphere cultures. The data are presented as means ± SDs. n = 12 (sphere-forming efficiency), n = 5 (protein expression). The p value was obtained by ANOVA with Sidak’s correction for multiple comparisons (mammospheres) or 2-tailed t test (protein levels).

References

    1. Abels ER, and Breakefield XO (2016). Introduction to extracellular vesicles: biogenesis, RNA cargo selection, content, release, and uptake. Cell Mol. Neurobiol 36, 301–312. - PMC - PubMed
    1. An X, Zhu Y, Zheng T, Wang G, Zhang M, Li J, Ji H, Li S, Yang S, Xu D, et al. (2019). An analysis of the expression and association with immune cell infiltration of the cGAS/STING pathway in pan-cancer. Mol. Ther. Nucleic Acids 14, 80–89. - PMC - PubMed
    1. Andzinski L, Spanier J, Kasnitz N, Kroger A, Jin L, Brinkmann MM, Kalinke U, Weiss S, Jablonska J, and Lienenklaus S (2016). Growing tumors induce a local STING dependent type I IFN response in dendritic cells. Int. J. Cancer 139, 1350–1357. - PubMed
    1. Bakhoum SF, Ngo B, Laughney AM, Cavallo JA, Murphy CJ, Ly P, Shah P, Sriram RK, Watkins TBK, Taunk NK, et al. (2018). Chromosomal instability drives metastasis through a cytosolic DNA response. Nature 553, 467–72. - PMC - PubMed
    1. Balaj L, Lessard R, Dai L, Cho YJ, Pomeroy SL, Breakefield XO, and Skog J (2011). Tumour microvesicles contain retrotransposon elements and amplified oncogene sequences. Nat. Commun 2, 180. - PMC - PubMed

Publication types