. 2022 Mar 8;38(10):110503.
doi: 10.1016/j.celrep.2022.110503. Epub 2022 Feb 21.

SARS-CoV-2 Nsp13 encodes for an HLA-E-stabilizing peptide that abrogates inhibition of NKG2A-expressing NK cells

Affiliations

SARS-CoV-2 Nsp13 encodes for an HLA-E-stabilizing peptide that abrogates inhibition of NKG2A-expressing NK cells

Quirin Hammer et al. Cell Rep. .

Abstract

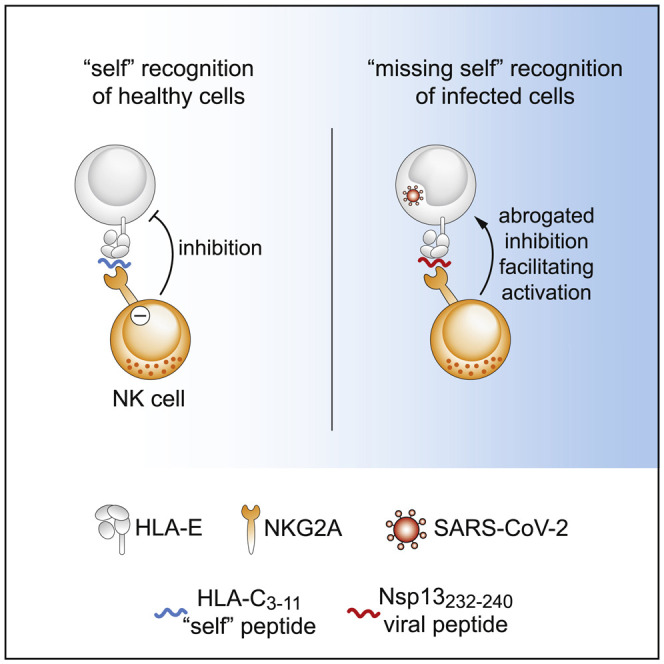
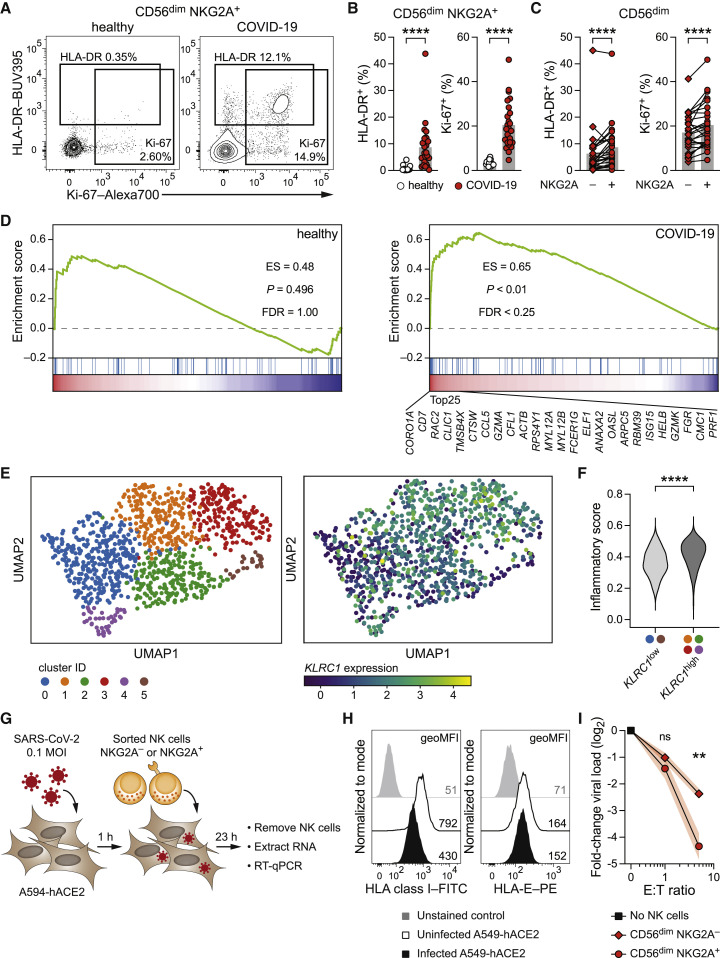
Natural killer (NK) cells are innate immune cells that contribute to host defense against virus infections. NK cells respond to severe acute respiratory syndrome coronavirus 2 (SARS-CoV-2) in vitro and are activated in patients with acute coronavirus disease 2019 (COVID-19). However, by which mechanisms NK cells detect SARS-CoV-2-infected cells remains largely unknown. Here, we show that the Non-structural protein 13 of SARS-CoV-2 encodes for a peptide that is presented by human leukocyte antigen E (HLA-E). In contrast with self-peptides, the viral peptide prevents binding of HLA-E to the inhibitory receptor NKG2A, thereby rendering target cells susceptible to NK cell attack. In line with these observations, NKG2A-expressing NK cells are particularly activated in patients with COVID-19 and proficiently limit SARS-CoV-2 replication in infected lung epithelial cells in vitro. Thus, these data suggest that a viral peptide presented by HLA-E abrogates inhibition of NKG2A+ NK cells, resulting in missing self-recognition.

Keywords: COVID-19; HLA-E; NK cells; NKG2A; SARS-CoV-2; missing self.


Conflict of interest statement

Declaration of interests H.-G.L. is a member of the Board of XNK Therapeutics AB and Vycellix Inc. K.-J.M. is a Scientific Advisor and has a research grant from Fate Therapeutics and is a member of the Scientific Advisory Board of Vycellix Inc. The other authors declare no competing interests.

Figures

None
Graphical abstract
Figure 1
Figure 1
SARS-CoV-2 Nsp13 encodes for an HLA-E-stabilizing peptide (A–C) In silico prediction of HLA-E01:01-binding nonamers using NetMHC4.0. (A) pp65 protein containing the irrelevant pp65495–503 peptide. (B) HLA-C01:02 protein containing the known stabilizing HLA-C3–11 peptide. (C) SARS-CoV-2 ORFeome (isolate Wuhan-Hu-1) containing the three top candidates Nsp13232–240, Nsp6114–122, and S269–277. (D) HLA-E stabilization on K562/HLA-E after pulsing with the indicated peptides at 300 μM overnight in serum-free medium. Left: representative HLA-E surface detection by flow cytometry (black line: solvent control; back filled histogram: pp65495-503; blue filled histogram: HLA-C3-11; red filled histogram: Nsp13232-240). Right: summary of HLA-E stabilization as geometric mean fluorescence intensity (geoMFI; n = 3 independent experiments). (E) HLA-E surface stabilization after peptide pulsing with varying concentrations (n = 4 independent experiments). (F) Pulse chase of HLA-E surface levels normalized to initiation of chase (t0; n = 4 independent experiments). (G) Summary table of delta energy of binding as indicator of theoretical affinity of HLA-E/peptide complexes determined by molecular dynamics (MD) simulations (n = 3 replicate simulations). (H) MD-based positioning of peptides in the peptide-binding groove of HLA-E. Left: HLA-C3–11. Right: Nsp13232–240. (I) Phylogenetic relationships between the genomes of SARS-CoV-2, SARS-CoV-1, and common cold-causing HCoVs as determined by Clustalω. Scale bar indicates nucleotide substitution per site. (J) Sequence identities relative to SARS-CoV-2. Left: genome level as determined by Clustalω. Middle: ORF1ab protein level as determined by Clustalω. Right: Nsp13232–240 peptide identity. (K) Nsp13232–240 amino acid sequence comparison between viruses. Sequence alterations relative to SARS-CoV-2 are highlighted in red. (L) HLA-E surface stabilization on K562/HLA-E after pulsing with Nsp13232–240 peptides from different viruses at 300 μM overnight determined by flow cytometry and displayed as geoMFI (n = 3 independent experiments). Data are either mean and individual data points (D) or mean ± SD (E, F, G, and L). Statistical significance was tested using two-way repeated measures ANOVA with Bonferroni correction (E and F). p < 0.05. See also Figure S1.
Figure 2
Figure 2
HLA-E/Nsp13232–240 complexes fail to bind to CD94/NKG2A (AC) HLA-E stabilization and binding of recombinant (recomb.) CD94/NKG2A protein to K562/HLA-E after peptide pulsing at 300 μM overnight in serum-free medium. (A) Representative binding of recombinant CD94/NKG2A as determined by flow cytometry after pulsing with the indicated peptides. (B) Summaries of CD94/NKG2A binding. Left: frequency of K562/HLA-E cells positive for CD94/NKG2A. Right: degree of CD94/NKG2A bound by K562/HLA-E cells presented as geoMFI (n = 3 independent experiments). (C) Summaries of HLA-E stabilization in the same experiments. Left: frequency of K562/HLA-E cells on which HLA-E is stabilized at the cell surface. Right: degree of HLA-E surface stabilization presented as geoMFI (n = 3 independent experiments). (D and E) Binding of HLA-E tetramers to primary CD56dim NKG2C NK cells. (D) Representative binding of tetramers refolded with the indicated peptides in the absence or presence of blocking anti-CD94 antibodies. (E) Summary of tetramer binding to CD56dim NKG2C NKG2A+ and CD56dim NKG2C NKG2A NK cells without or with CD94 blockade (n = 9 donors in 3 independent experiments). Data are mean and individual data points (B, C, and E). FMO, fluorescence minus one.
Figure 3
Figure 3
Nsp13232–240 presented by HLA-E unleashes NKG2A+ NK cell activity NK cell activation of purified NK cells from healthy donors either left unstimulated or stimulated by co-culture with peptide-pulsed K562/HLA-E target cells as determined by flow cytometry. (A) Representative degranulation of CD56dim NK cells upon co-culture with K562/HLA-E cells pulsed with the indicated peptides as measured by CD107a surface mobilization detected by flow cytometry. (B) Summary of degranulation (n = 16 donors in 6 independent experiments). (C) Degranulation responses of CD56dim NKG2C NK cell subsets stratified for expression of NKG2A, KIR2DL1, KIR2DL3, and KIR3DL1 (black filled circle: expressed; gray filled circle: not expressed) upon co-culture with K562/HLA-E cells pulsed with the indicated peptides (n = 8 donors in 4 independent experiments). (D) Correlation of the frequency of NKG2A+ NK cells within the total CD56dim NK cells population and the difference in degranulation between pulsing with Nsp13232–240 and HLA-C3–11 (n = 16 donors in 6 independent experiments). (E) Representative degranulation and intracellular cytokine expression of CD56dim NKG2C NKG2A+ NK cells upon co-culture with K562/HLA-E cells pulsed with the indicated peptides. (F) Summaries of activation of CD56dim NKG2C NKG2A+ NK cells. Top left: degranulation. Top right: TNF expression. Bottom left: IFN-γ expression. Bottom right: polyfunctional (CD107a+ TNF+ IFN-γ+) responses (n = 12 donors in 5 independent experiments). Data are either mean and individual data points (B and F), mean (C), or individual data points (D). Statistical significance was tested using Friedman test with Dunn's multiple comparison test (B and F) or Spearman correlation (D). p < 0.05, ∗∗p < 0.01, ∗∗∗p < 0.001, ∗∗∗∗p < 0.0001. irr., irrelevant. See also Figure S2.
Figure 4
Figure 4
NKG2A+ NK cells are activated in patients with COVID-19 and proficiently suppress SARS-CoV-2 replication in vitro (AC) Ex vivo Activation of NKG2A+ NK cells in the blood of healthy controls and of patients with COVID-19 as determined by flow cytometric detection of the activation marker HLA-DR and the proliferation marker Ki-67. (A) Representative expression of HLA-DR and Ki-67 by CD56dim NKG2A+ NK cells. Left: healthy control. Right: patient with COVID-19. (B) Summaries of markers expressed by CD56dim NKG2A+ NK cells in controls and patients (n = 17 healthy controls and n = 25 patients). (C) Summaries of markers expressed by NKG2A CD56dim and NKG2A+ CD56dim NK cells in patients (n = 25). (DF) Analysis of publicly available single-cell RNA sequencing data of ex vivo NK cells from BALF of healthy controls and patients with COVID-19 (Liao et al., 2020). (D) Gene set enrichment analysis (GSEA) of a signature of inflammatory responses (Table S2) (Yang et al., 2019) along with KLRC1 expression in NK cells from BALF. Left: healthy controls. Right: patients with COVID-19. The top 25 transcripts positively correlating with KLRC1 in BALF NK cells of patients with COVID-19 are depicted. (E) UMAP plot illustrating the distribution of BALF NK cells from patients with COVID-19. Left: colored according to Leiden clustering. Right: colored based on KLRC1 expression. (F) Inflammatory score expression between cells of the KLRC1low bin and the KLRC1high bin. (GI) A549-hACE2 human lung epithelial cells were infected with SARS-CoV-2 (isolate SARS-CoV-2/human/SWE/01/2020) at MOI = 0.1 and co-cultured with NK cells. (G) Schematic illustration of experimental setup. (H) Uninfected and SARS-CoV-2-infected A549-hACE2 cultured without NK cells were assessed for HLA surface expression by flow cytometry at 24 h post-infection. Left: HLA class. Right: HLA-E (representative results of two independent experiments). (I) A549-hACE2 were infected with SARS-CoV-2, followed by co-culture with sorted CD56dim NKG2A and NKG2A+ NK cells at the indicated effector/target (E:T) ratios starting at 1 h post-infection as in (G). Virus copies in adherent A549-hACE2 cells were quantified at 24 h post-infection by RNA isolation and RT-qPCR using the CDC nCoV-2019 N1 assay. Data are expressed as fold-change to SARS-CoV-2-infected A549-hACE cultured without NK cells (n = 6 NK cell donors in 2 independent experiments). Data are represented as mean and individual data points (B and C), distribution (F), or mean ± SEM (I). Statistical significance was tested using Mann-Whitney U test (B and C), Wilcoxon signed-rank test (F), or two-way repeated measures ANOVA with Bonferroni correction (I). ∗∗p < 0.01, ∗∗∗∗p < 0.0001. See also Figure S3 and Tables S1 and S2.

References

    1. Alter G., Heckerman D., Schneidewind A., Fadda L., Kadie C.M., Carlson J.M., Oniangue-Ndza C., Martin M., Li B., Khakoo S.I., et al. HIV-1 adaptation to NK-cell-mediated immune pressure. Nature. 2011;476:96–100. doi: 10.1038/nature10237. - DOI - PMC - PubMed
    1. Andreatta M., Nielsen M. Gapped sequence alignment using artificial neural networks: application to the MHC class I system. Bioinformatics. 2016;32:511–517. doi: 10.1093/bioinformatics/btv639. - DOI - PMC - PubMed
    1. Babic M., Pyzik M., Zafirova B., Mitrovic M., Butorac V., Lanier L.L., Krmpotic A., Vidal S.M., Jonjic S. Cytomegalovirus immunoevasin reveals the physiological role of "missing self" recognition in natural killer cell dependent virus control in vivo. J. Exp. Med. 2010;207:2663–2673. doi: 10.1084/jem.20100921. - DOI - PMC - PubMed
    1. Bao C., Tao X., Cui W., Hao Y., Zheng S., Yi B., Pan T., Young K.H., Qian W. Natural killer cells associated with SARS-CoV-2 viral RNA shedding, antibody response and mortality in COVID-19 patients. Exp. Hematol. Oncol. 2021;10:5. doi: 10.1186/s40164-021-00199-1. - DOI - PMC - PubMed
    1. Berman H.M., Westbrook J., Feng Z., Gilliland G., Bhat T.N., Weissig H., Shindyalov I.N., Bourne P.E. The protein Data Bank. Nucleic Acids Res. 2000;28:235–242. doi: 10.1093/nar/28.1.235. - DOI - PMC - PubMed

Publication types

MeSH terms