. 2022 Apr;42(4):407-427.
doi: 10.1161/ATVBAHA.121.317182. Epub 2022 Mar 3.

Novel Role of Prereplication Complex Component Cell Division Cycle 6 in Retinal Neovascularization

Affiliations

Novel Role of Prereplication Complex Component Cell Division Cycle 6 in Retinal Neovascularization

Raj Kumar et al. Arterioscler Thromb Vasc Biol. 2022 Apr.

Abstract

Background: The major aim of this study is to investigate whether CDC6 (cell division cycle 6), a replication origin recognition complex component, plays a role in retinal neovascularization, and if so, to explore the underlying mechanisms.

Methods: In this study, we used a variety of approaches including cellular and moleculer biological methodologies as well as global and tissue-specific knockout mice in combination with an oxygen-induced retinopathy model to study the role of CDC6 in retinal neovascularization.

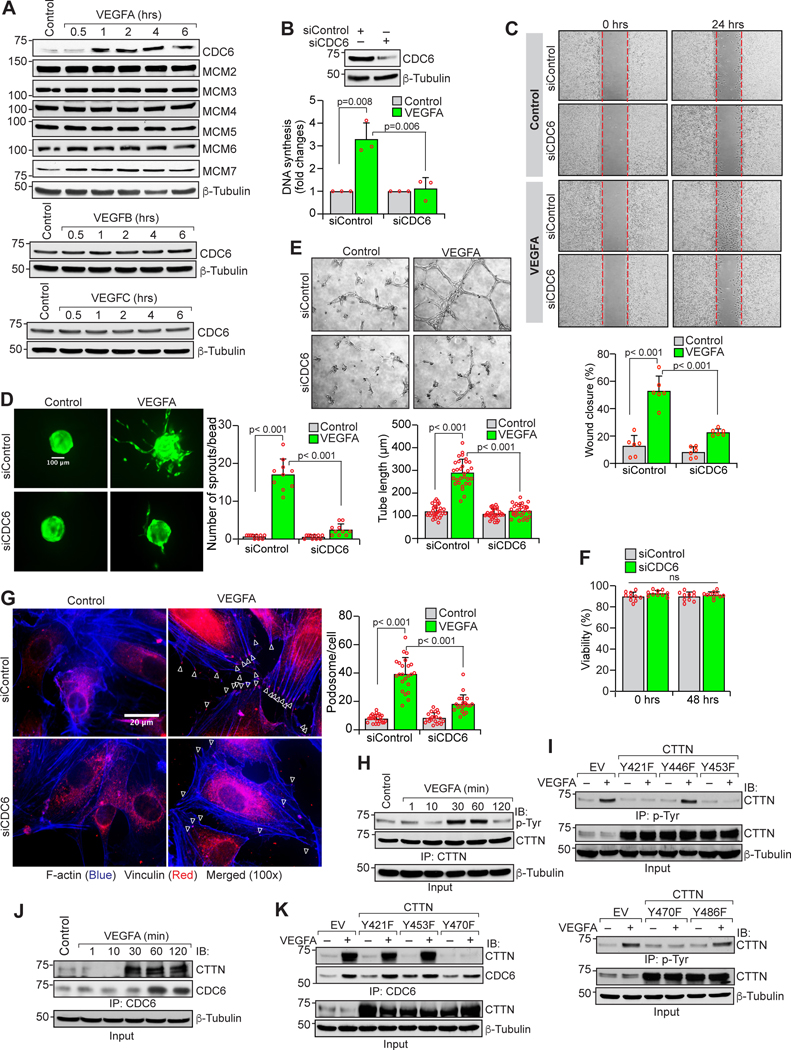
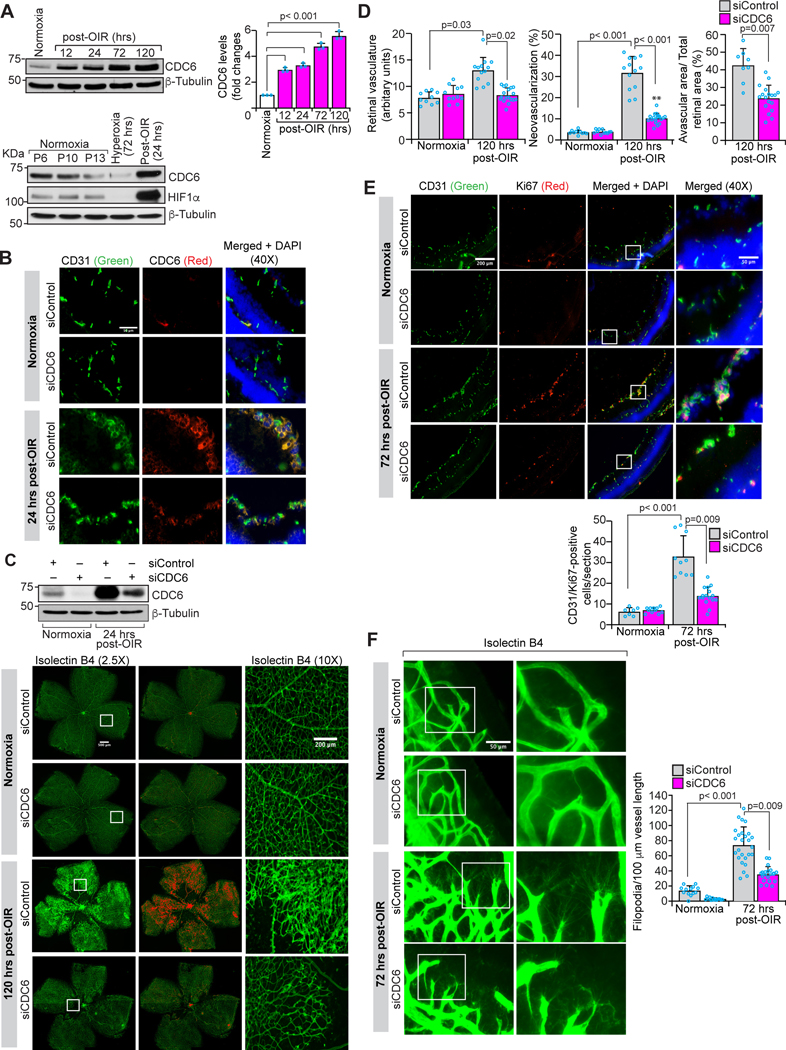
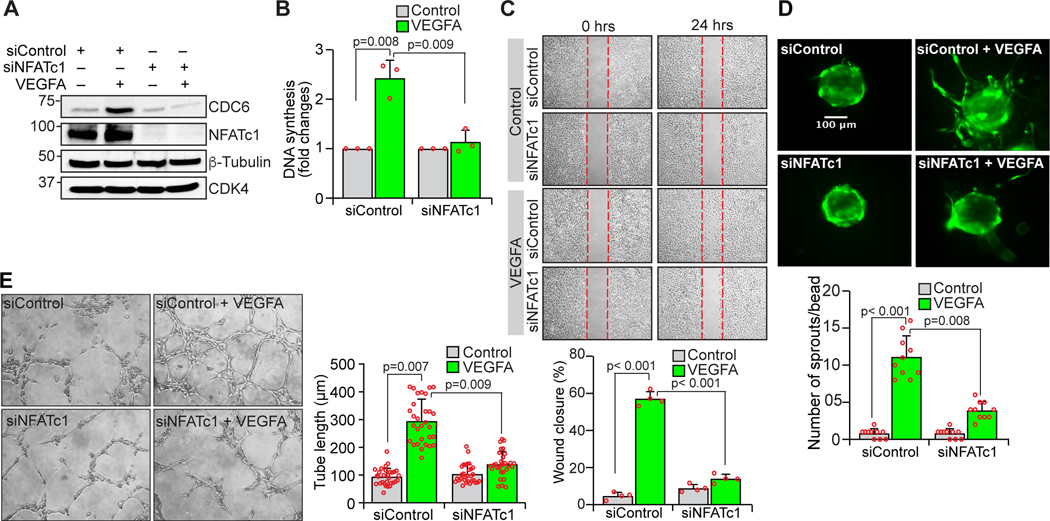
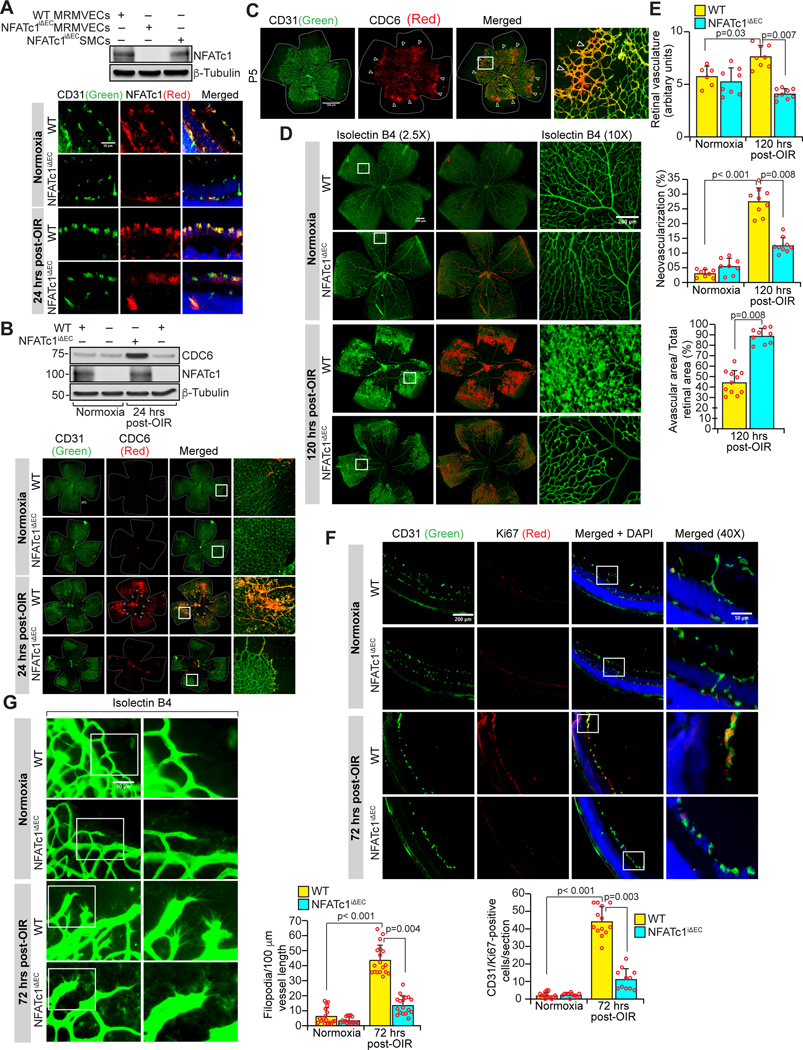
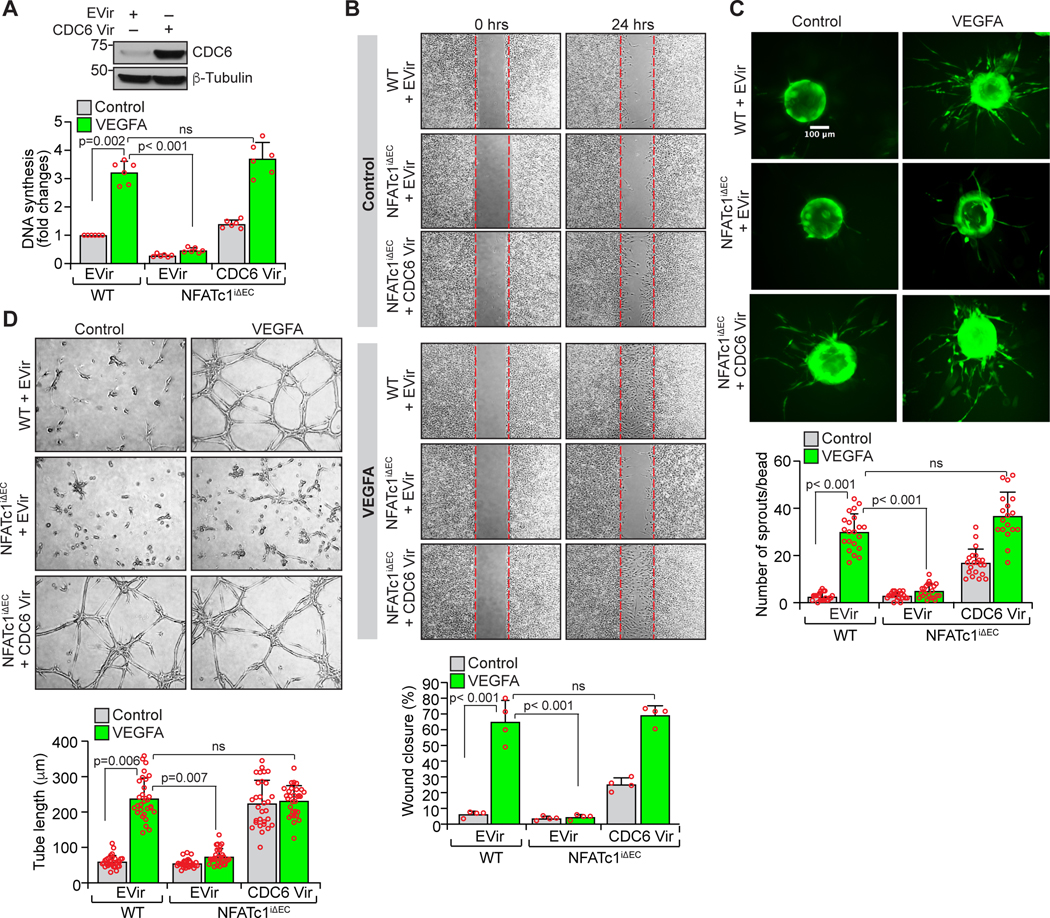
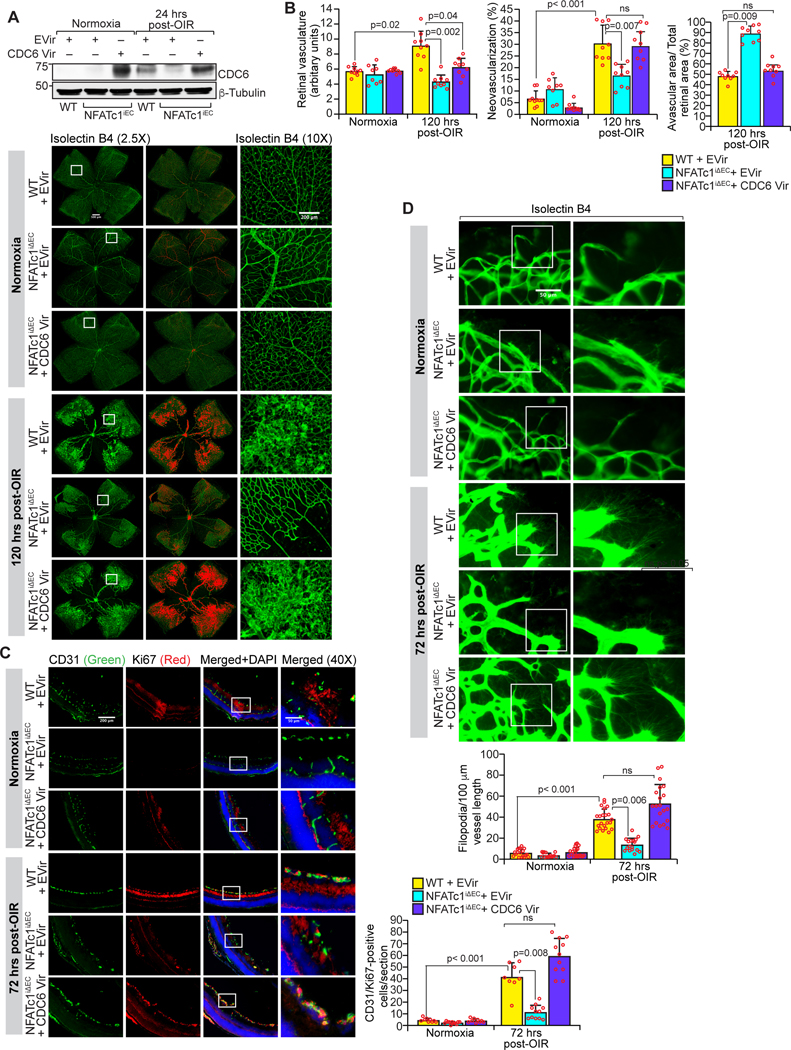
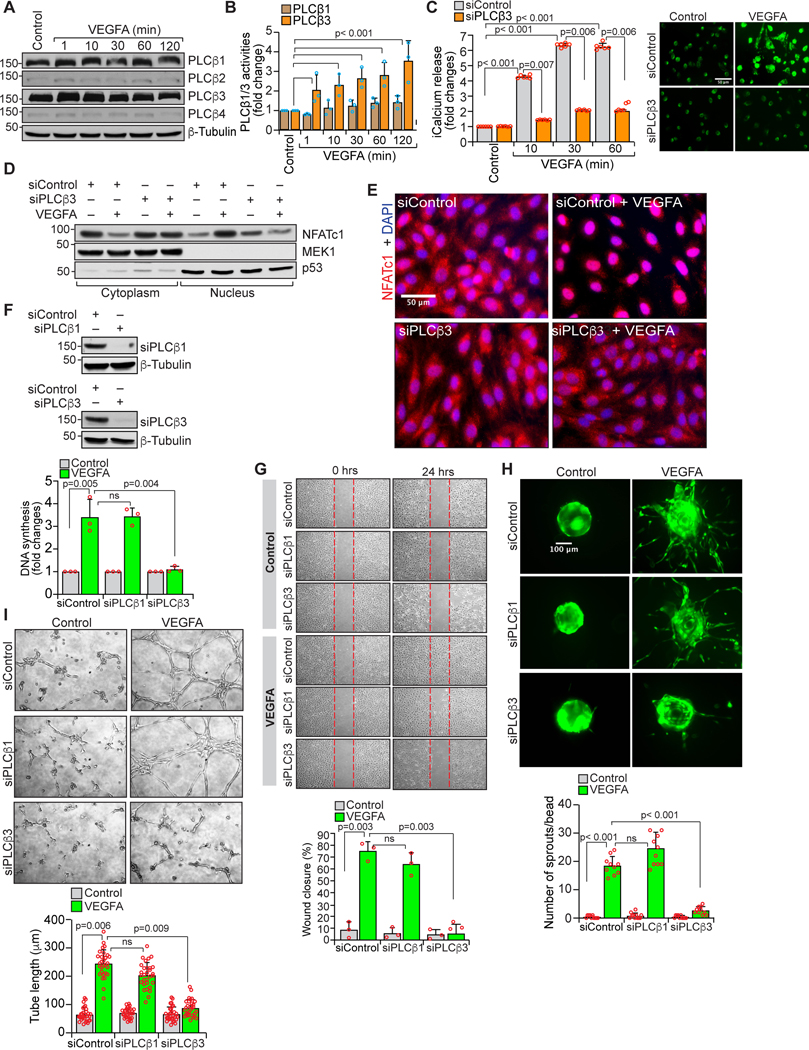
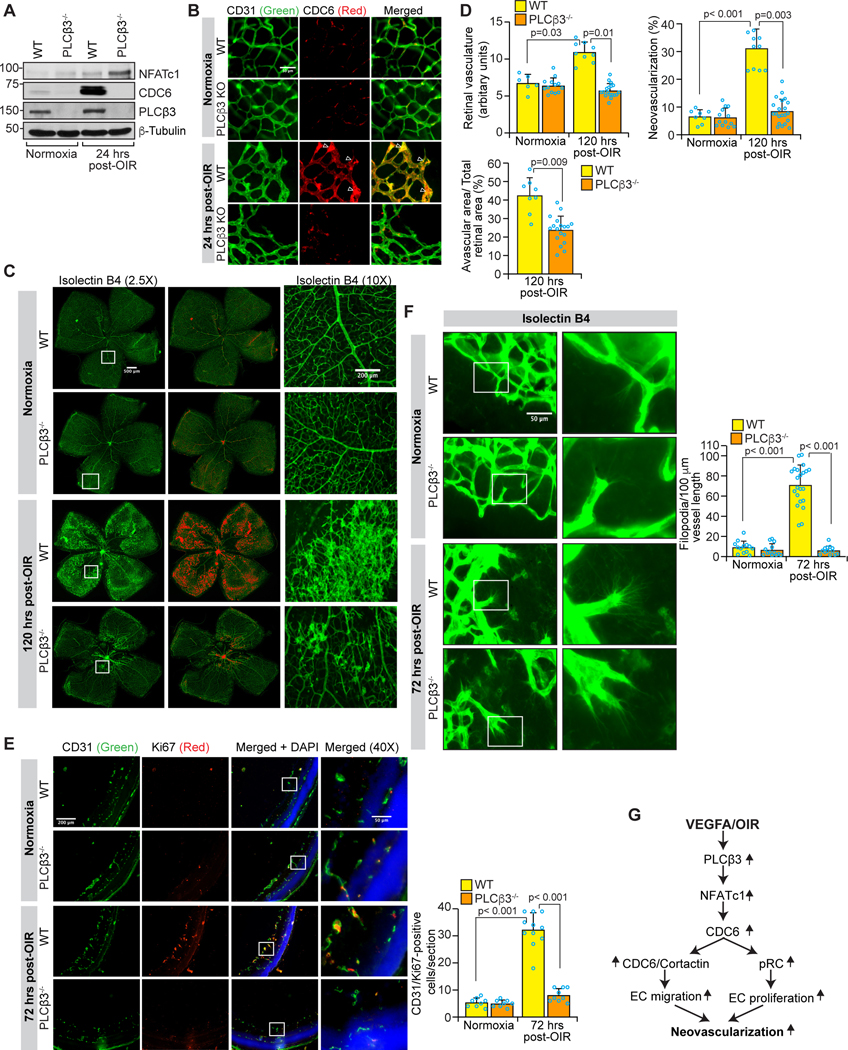
Results: VEGFA (vascular endothelial growth factor A)-induced CDC6 expression in a time-dependent manner in human retinal microvascular endothelial cells. In addition, VEGFA-induced CDC6 expression was dependent on PLCβ3 (phospholipase Cβ3)-mediated NFATc1 (nuclear factor of activated T cells c1) activation. Furthermore, while siRNA-mediated depletion of PLCβ3, NFATc1, or CDC6 levels blunted VEGFA-induced human retinal microvascular endothelial cell angiogenic events such as proliferation, migration, sprouting, and tube formation, CDC6 overexpression rescued these effects in NFATc1-deficient mouse retinal microvascular endothelial cells. In accordance with these observations, global knockdown of PLCβ3 or endothelial cell-specific deletion of NFATc1 or siRNA-mediated depletion of CDC6 levels substantially inhibited oxygen-induced retinopathy-induced retinal sprouting and neovascularization. In addition, retroviral-mediated overexpression of CDC6 rescued oxygen-induced retinopathy-induced retinal neovascularization from inhibition in PLCβ3 knockout mice and in endothelial cell-specific NFATc1-deficient mice.

Conclusions: The above observations clearly reveal that PLCβ3-mediated NFATc1 activation-dependent CDC6 expression plays a crucial role in VEGFA/oxygen-induced retinopathy-induced retinal neovascularization.

Keywords: endothelial cell; knockout mice; origin recognition complex; oxygen; retinal neovascularization.


Figures

Figure 1.
Figure 1.. CDC6 mediates VEGFA-induced HRMVEC proliferation, migration, sprouting, tube formation and podosome formation.
A. Western blot analysis of control and various time periods of VEGFA, VEGFB or VEGFC-treated HRMVECs for the indicated proteins. B, Upper panel. Western blot analysis of the extracts of siControl and siCDC6-transfected HRMVECs for CDC6 and β-tubulin levels. B, Bottom panel. The effect of siControl and siCDC6 on VEGFA-induced HRMVEC DNA synthesis. C-E & G. All the conditions were the same as in bottom panel B except that cells were assayed for migration (C), sprouting (D), tube formation (E) or podosome formation (G). F. HRMVECs were transfected with siControl or siCDC6 for 6 hrs in MEM, recovered for overnight in complete medium (EGM2), quiecced for 24 hrs in EBM2 and tested for viability as described in Materials and Methods. H. All the conditions were the same as in panel A except that equal amounts of protein from control and each treatment were immunoprecipitated (IP) with anti-cortactin antibody and the immunocomplexes were analyzed by Western blotting using antibodies against phosphotyrosine (pTyr) and the blot was then reprobed for cortactin. Input proteins were analyzed by Western blotting for β-tubulin. I. HRMVECs that were transfected with empty or the indicated tyrosine mutants of cortactin (CTTN) expressing pCMV vector and synchronized were treated with and without VEGFA for 30 min and equal amounts of protein from control and each treatment were IP with pTyr antibody and the immunocomplexes were analyzed by Western blotting using antibodies against cortactin. Input proteins were analyzed by Western blotting for cortactin and β-tubulin. J. All the conditions were the same as in panel H except that equal amounts of protein from control and each treatment were IP with anti-CDC6 antibody and immunocomplexes were analyzed by Western blotting using antibodies against cortactin and the blot was reprobed for CDC6. Input proteins were analyzed by Western blotting for β-tubulin. K. HRMVECs that were transfected with empty or the indicated tyrosine mutant cortactin (CTTN) expressing pCMV vector and synchronized were treated with and without VEGFA for 30 min and equal amounts of protein from control and each treatment were IP with anti-CDC6 antibody, the immunocomplexes were analyzed by Western blotting using antibodies against cortactin and the blot was reprobed for CDC6. Input proteins were analyzed by Western blotting for cortactin and β-tubulin. Bar graphs represent quantitative analysis. Values are presented as Mean ± SD. Scale bars in panels D and G are 100 and 20 μm, respectively.
Figure 2.
Figure 2.. CDC6 mediates retinal neovascularization.
A, Upper panel. Western blot analysis of retinal extracts of normoxic and the indicated time periods of post OIR WT mice pups for CDC6 levels. The blot was reprobed for β-tubulin. Bar graph represents quantitative analysis. A, Bottom panel. Retinas were isolated from mice pups at the indicated conditions and an equal amount of protein from each retinal extract was analyzed by Western blotting for CDC6 and HIF1α levels using their specific antibodies and the blot was reprobed for β-tubulin. B. Normoxic and hyperoxic mice pups were injected intravitreally with 1 μg/0.5 μl/eye of siControl or siCDC6 at P11 and P12 and, at 24 hrs post OIR (P13), eyes were enucleated, fixed, sections were made and coimmunostained for CD31 and CDC6 (scale bar, 50 μm). C, Upper panel. All the conditions were the same as in panel B except that at 24 hrs post OIR, eyes were enucleated and retinal extracts were prepared and analyzed by Western blotting for CDC6 and β-tubulin. C, Lower panel. All the conditions were the same as in panel B except that the pups received the indicated siRNA at P11, P12 and P13 and at 120 hrs post OIR (P17), eyes were enucleated, fixed, retinas were isolated, stained with isolectin B4 and flat mounts were prepared. Retinal vascularization is shown in the first column at 2.5X magnification (scale bar, 500 μm) and neovascularization is highlighted in red in the second column. The third column shows the selected rectangular areas of the images in the first column at 10X magnification (scale bar, 200 μm). D. Retinal vasculature, retinal neovascularization and avascular area were determined as described in “Materials and Methods” using the retinal flat mounts prepared in bottom panel C. E. Upper panel: All the conditions were the same as in bottom panel C except that at 72 hrs of post OIR (P15), eyes were enucleated, fixed, sections were made and coimmunostained for CD31 and Ki67. Retinal EC proliferation was measured by counting CD31 and Ki67-positive cells that extended anterior to the inner limiting membrane in each section and shown in the bottom bar graph. The scale bars in the far left and far right columns are 200 μm and 50 μm, respectively. F. Left panel: All the conditions were the same as in bottom panel C except that the retinal flat mounts were examined for filopodia at 40X magnification (scale bar, 50 μm). Right panel: Quantitative analysis of the number of filopodia/unit vessel length. Values are presented as Mean ± SD.
Figure 3.
Figure 3.. NFATc1 mediates VEGFA-induced CDC6 expression, HRMVEC proliferation, migration, sprouting, and tube formation.
A. The effect of siControl, siNFATc1 on VEGFA- induced (1 h) CDC6 expression in HRMVECs. The blot was sequentially reprobed for NFATc1, β-tubulin and CDK4 to show the specificity and efficacy of the siRNA on its target and off-target molecules. B-E. HRMVECs that were transfected with siControl or siNFATc1 and synchronized were tested for VEGFA-induced DNA synthesis (B), migration (C), sprouting (D) and tube formation (E). Bar graphs represent quantitative analysis. Values are presented as Mean ± SD. Scale bar in panel D is 100 μm.
Figure 4.
Figure 4.. EC-specific knockdown of NFATc1 suppresses hypoxia-induced CDC6 expression and retinal neovascularization.
A, Uppaer panel. Retinal ECs and aortic SMCs from the indicated mice were analyzed by Western blotting for NFATc1 levels using its specific antibody and the blot was reprobed for β-tubulin. A, Bottom panel. WT and NFATc1flox/flox:Cdh5-CreERT2 mouse pups with dams were housed in normoxia or in a hyperoxia chamber and exposed to hyperoxia (75% O2) from P7 to P12. At P9 and P10, the normoxic and hyperoxic NFATc1flox/flox:Cdh5-CreERT2 mice pups were injected (IP) with 100 μg of tamoxifen and the eyes from normoxic and 72 hrs post OIR pups (P15) were enucleated, fixed, sections were made and coimmunostained for CD31 and NFATc1 (scale bar, 50 μm). B, Upper panel. All the conditions were the same as in panel A except that normoxic and 24 hrs post OIR (P13) pups’ retinal extracts were prepared and analyzed by Western blotting for CDC6, NFATc1, and β-tubulin levels. B, Lower panel. All the conditions were the same as in panel A except that eyes from normoxic and 24 hrs post OIR pups were enucleated, fixed, retinas were isolated, immunostained with anti-CDC6 and anti-CD31 antibodies, and flat mounts were prepared and examined under a Zeiss inverted fluorescence microscope (Axiovision Observer.z1) (scale bar, 50 μm). The images in the extreme right column represent the digital magnification of the images shown in the immediate left column by rectangular boxes. C. Eyes from P5 mice pups were enucleated, fixed, retinas isolated, coimmunostained with anti-CDC6 and anti-CD31 antibodies, and flat mounts were prepared and examined under a zeiss inverted fluorescence microscope (Axiovision Observer.z1). Arrows in the 3rd and 4th columns indicate CDC6 expression in the vascular front (scale bar, 500 μm). D. All the conditions were the same as in panel A except that eyes were enucleated from normoxic and 120 hrs post OIR pups (P17), fixed, retinas were isolated, stained with isolectin B4, flat mounts were prepared, and retinal vascularization and neovascularization were measured. Retinal vascularization is shown in the first column at 2.5X magnification (scale bar 500 μm) and neovascularization is highlighted in red in the second column. The third column shows the selected rectangular areas of the images in the first column at 10X magnification (scale bar, 200 μm). E. Retinal vasculature, retinal neovascularization and avascular area were determined as described in “Materials and Methods” using the retinal flat mounts prepared in panel D. F. Upper panel: All the conditions were the same as in panel A except that the sections were coimmunostained for CD31 and Ki67. The extreme right column shows 40X magnification of the areas selected by rectangular boxes in the immediate left column images (scale bars in the far left and far right columns are 200 and 50 μm, respectively). Retinal EC proliferation was measured by counting CD31 and Ki67-positive cells from the inner limiting membrane to the extended region in each section and presented in the bottom bar graph. G. All the conditions were the same as in panel D except that at P15 the retinas were isolated, stained with isolectin B4, and flat mounts were prepared and examined for filopodia under fluorescent microscope at 40X magnification (scale bar, 50 μm). Bar graph on the right represents quantitative analysis. Values are presented as Mean ± SD.
Figure 5.
Figure 5.. Forced expression of CDC6 in NFATc1iΔEC retinal ECs restores VEGFA-induced proliferation, migration, sprouting and tube formation.
A, Upper panel. MRMVECs from WT and NFATc1iΔEC mice were isolated, infected with empty or CDC6 expression retrovirus, and 36 h later cell extracts were prepared and analyzed by Western blotting for CDC6 and β-tubulin levels. A, Bottom panel. All the conditions were the same as in upper panel A except that after 24 hrs of retroviral infection, cells were synchronized for 24 hrs and subjected to VEGFA-induced DNA synthesis. B-D. All the conditions were the same as in bottom panel A except that cells were subjected to VEGFA-induced migration (B), sprouting (C) and tube formation (D). Bar graphs represent quantitative analysis. Values are presented as Mean ± SD. Scale bar in panel C is 100 μm.
Figure 6.
Figure 6.. Forced expression of CDC6 in NFATc1iΔEC mice pups’ retina restores hypoxia-induced retinal neovascularization.
A, Upper panel. WT and NFATc1flox/flox:Cdh5-CreERT2 mice pups with dams were housed in normoxia or in a hyperoxia chamber and exposed to hyperoxia from P7 to P12. At P9 and P10, the normoxic or hyperoxic NFATc1flox/flox:Cdh5-CreERT2 mice pups were injected (IP) with 100 μg tamoxifen. Then, at P10 and P11, WT mice pups received with 40 moi/0.5 μl/eye of empty retrovirus whereas NFATc1flox/flox:Cdh5-CreERT2 mice pups received with 40 moi/0.5 μl/eye of empty or CDC6 expression retrovirus intravitreally. At 24 hrs post OIR (P13), retinal extracts were prepared and analyzed by Western blotting for CDC6 and β-tubulin. Bottom panel. All the conditions were the same as in the upper panel A except that at 120 hrs post OIR (P17), eyes were enucleated, fixed, retinas were isolated, stained with isolectin B4, and flat mounts were prepared and examined under a fluorescent microscope for retinal neovascularization. Retinal vascularization is shown in the first column (scale bar, 500 μm). Neovascularization is highlighted in red in the second column. The third column shows the selected rectangular areas of the images in the first column under 10X magnification (scale bar, 200 μm). B. Retinal vasculature, neovascularization and avascular area were determined as described in the “Materials and Methods” using the retinal flat mounts prepared in bottom panel A. C. All the conditions were the same as in bottom panel A except that at 72 hrs post OIR (P15), eyes were enucleated, fixed and cross-sections were made and coimmunostained for CD31 and Ki67. The right column (scale bar, 50 μm) shows the higher magnification (40X) of the areas selected by the rectangular boxes in the left column images (scale bar, 200 μm). D. All the conditions were the same as in bottom panel A except that at 72 hrs post OIR (P15), retinas were isolated, stained with isolectin B4, and flat mounts were prepared and examined for filopodia under fluorescent microscope at 40X (scale bar, 50 μm). Bar graphs represent quantitative analysis. Values represent Mean ± SD.
Figure 7.
Figure 7.. PLCβ3 mediates VEGFA-induced NFATc1 activation, HRMVEC proliferation, migration, sprouting and tube formation.
A. Western blot analysis of control and various time periods of VEGFA-treated HRMVECs for PLCβ1, PLCβ2, PLCβ3, and PLCβ4 levels. The blot was reprobed for β-tubulin. B. HRMVECs were treated with or without VEGFA for the indicated time periods and assayed for PLCβ1 and PLCβ3 activities as described in Materials and Methods. C, left panel. HRMVECs were transfected with siControl or siPLCβ3, quiesced, preloaded with Fluo-8 AM and intracellular calcium release in response to VEGFA at the indicated time period was measured by flurometry. C, right panel. All the conditions were the same as in left panel except that calcium release at 30 min of VEGFA treatment was measured by fluorescence miscroscopy. D. HRMVECs that were transfected with siControl or siPLCβ3 and synchronized were treated with and without VEGFA for 30 min and nuclear and cytoplasmic extracts were prepared and analyzed by Western blotting for NFATc1 nuclear translocation. The blot was reprobed sequentially for MEK1 and p53 levels to show the purity of the cytoplasmic and nuclear extracts, respectively. E. All the conditions were same as in panel D except that HRMVECs were immunostained with anti-NFATc1 antibody to examine NFATc1 nuclear translocation. F, Upper and middle panels. Western blot analysis showing the efficacy of siPLCβ1 and siPLCβ3 on the downregulation of PLCβ1 and PLCβ3 levels in HRMVECs. F, Bottom panel. The effect of siPLCβ1 and siPLCβ3 on VEGFA-induced HRMVEC DNA synthesis. G-I. All the conditions were the same as in bottom panel (F) except that cells were subjected to VEGFA-induced migration (G), sprouting (H) or tube formation (I). Values are presented as Mean ± SD. Scale bars in panels C (right panel), E and H are 50 μm, 50 μm and 100 μm, respectively.
Figure 8.
Figure 8.. PLCβ3 mediates hypoxia-induced CDC6 expression and retinal neovascularization.
A. WT and PLCβ3−/− mice pups with dams were housed in normoxia or in a hyperoxia chamber and exposed to hyperoxia from P7 to P12. At P12 mice pups were returned to normal air to develop hyeroxia-mediated hypoxia. Normoxic or 24 hrs post OIR (P13) retinas were isolated, extracts were prepared and analyzed by Western blotting for NFATc1 and CDC6 levels. The blot was reprobed for PLCβ3 and β-tubulin. B. All the conditions were the same as in panel A except that at 24 hrs post OIR (P13), eyes were enucleated, retinas were isolated, coimmunostained for CD31 and CDC6, flat mounts were prepared and examined under fluorescence microscope (scale bar, 50 μm). C, All the conditions were the same as in panel B except that at 120 hrs post OIR (P17), eyes were enucleated, retinas isolated, stained with isolectin B4, and flat mounts were prepared and examined under a fluorescent microscope for retinal neovascularization. Retinal vascularization is shown in the first column (scale bar, 500 μm). Neovascularization is highlighted in red in the second column. The third column shows the selected rectangular areas of the images in the first column under 10X magnification (scale bar, 200 μm). D. Retinal vasculature, neovascularization and avascular area were determined as described in the “Materials and Methods” using flat mounts prepared in panel C. E. All the conditions were the same as in panel B except that at P15, eyes from normoxic and 72 hrs post OIR pups were enucleated, fixed, cross-sections made and coimmunostained for CD31 and Ki67. The right column (scale bar, 50 μm) shows the higher magnification (40X) of the areas selected by the rectangular boxes in the left column images (scale bar, 200 μm). F. All the conditions were the same as in panel C except that at P15, eyes were enucleated, retinas isolated, stained with isolectin B4, and flat mounts were prepared and examined under a fluorescent microscope for filipodia (scale bar, 50 μm). G. Schematic diagram depicting the proposed signaling pathway of CDC6 expression mediating retinal neovascularization. Bar graphs represent quantitative analysis. Values represent Mean± S.D.

Similar articles

Cited by

References

    1. Yau JW, Rogers SL, Kawasaki R, et al. Meta-Analysis for Eye Disease (META-EYE) Study Group. Global prevalence and major risk factors of diabetic retinopathy. Diabetes Care. 2012;35:556–564. - PMC - PubMed
    1. World report on vision. Geneva: World Health Organization; 2019. Licence: CC BY-NC-SA 3.0 IGO. https://www.who.int/publications/i/item/9789241516570.
    1. Solomon SD, Chew E, Duh EJ, Sobrin L, Sun JK, VanderBeek BL, Wykoff CC, Gardner TW. Diabetic Retinopathy: A Position Statement by the American Diabetes Association. Diabetes Care. 2017;40:412–418. - PMC - PubMed
    1. Sun G, Zhang X, Shen YI, Sebastian R, Dickinson LE, Fox-Talbot K, Reinblatt M, Steenbergen C, Harmon JW, Gerecht S. Dextran hydrogel scaffolds enhance angiogenic responses and promote complete skin regeneration during burn wound healing. Proc Natl Acad Sci U S A. 2011;108:20976–20981. - PMC - PubMed
    1. Aiello LP, Pierce EA, Foley ED, Takagi H, Chen H, Riddle L, Ferrara N, King GL, Smith LE. Suppression of retinal neovascularization in vivo by inhibition of vascular endothelial growth factor (VEGF) using soluble VEGF-receptor chimeric proteins. Proc Natl Acad Sci U S A. 1995;92:10457–10461. - PMC - PubMed

Publication types