

The comparative anti-cancer effects of krill oil and oxaliplatin in an orthotopic mouse model of colorectal cancer
- PMID: 35236377
- PMCID: PMC8892734
- DOI: 10.1186/s12986-022-00646-8
The comparative anti-cancer effects of krill oil and oxaliplatin in an orthotopic mouse model of colorectal cancer
Abstract
Background: Our in vitro studies demonstrated that krill oil (KO) has anti-cancer potential. This study aimed to compare the anti-cancer effects of KO with a commonly used chemotherapeutic drug, oxaliplatin and to identify the molecular mechanisms associated with KO supplementation in a mouse model of colorectal cancer (CRC).
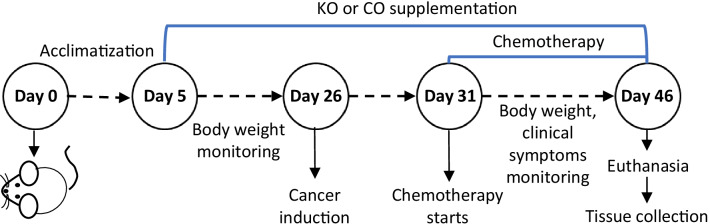
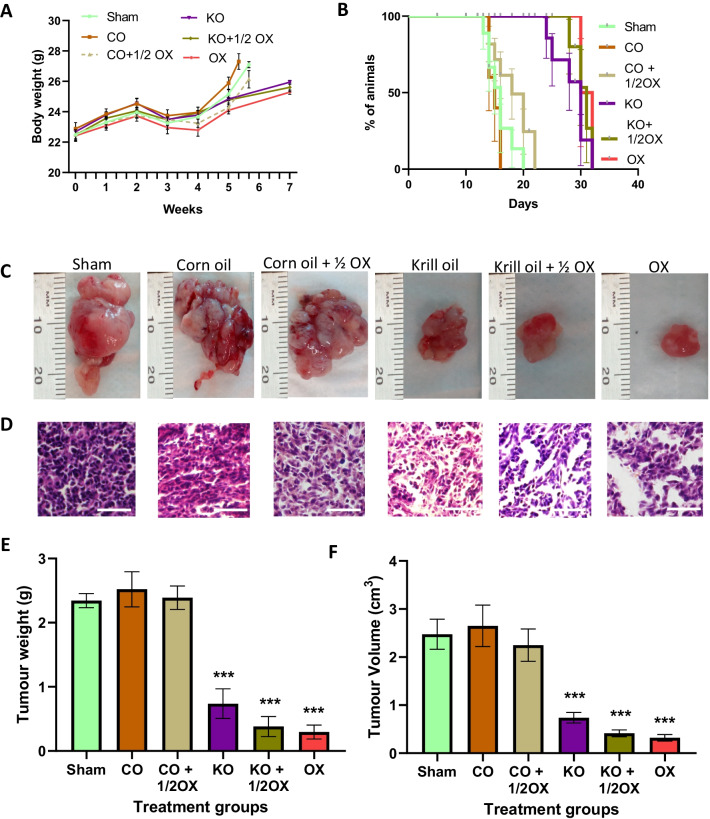
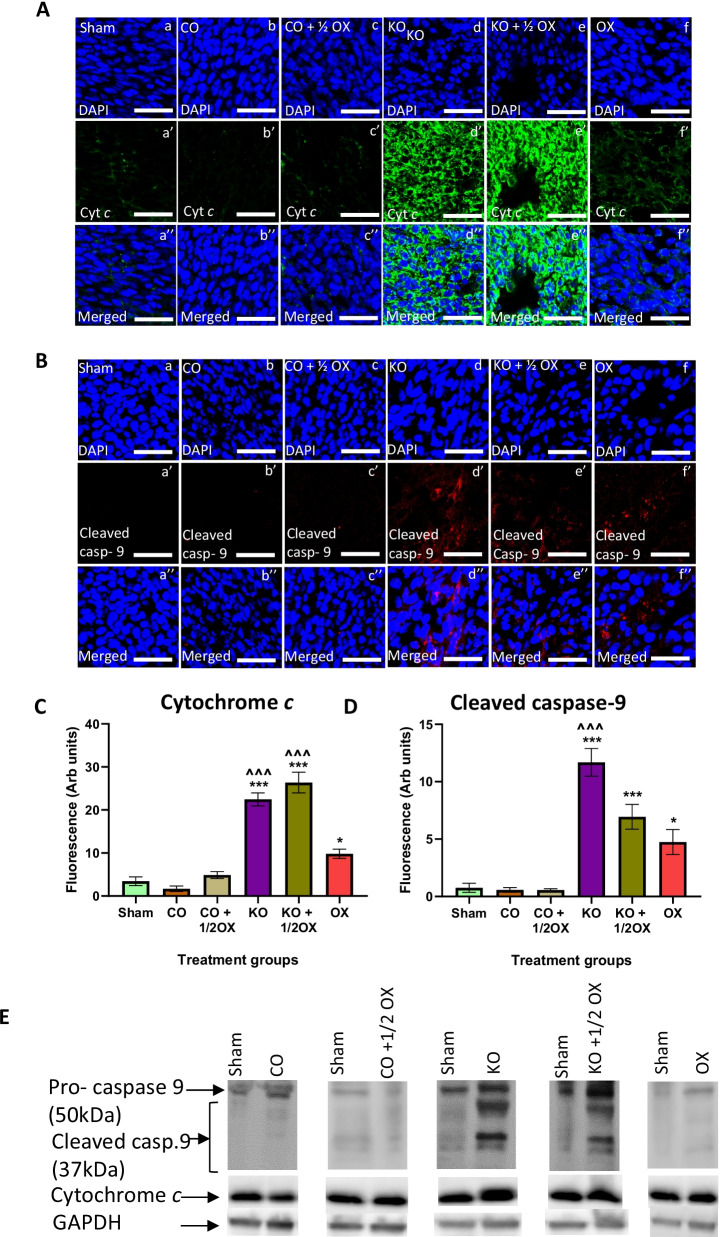
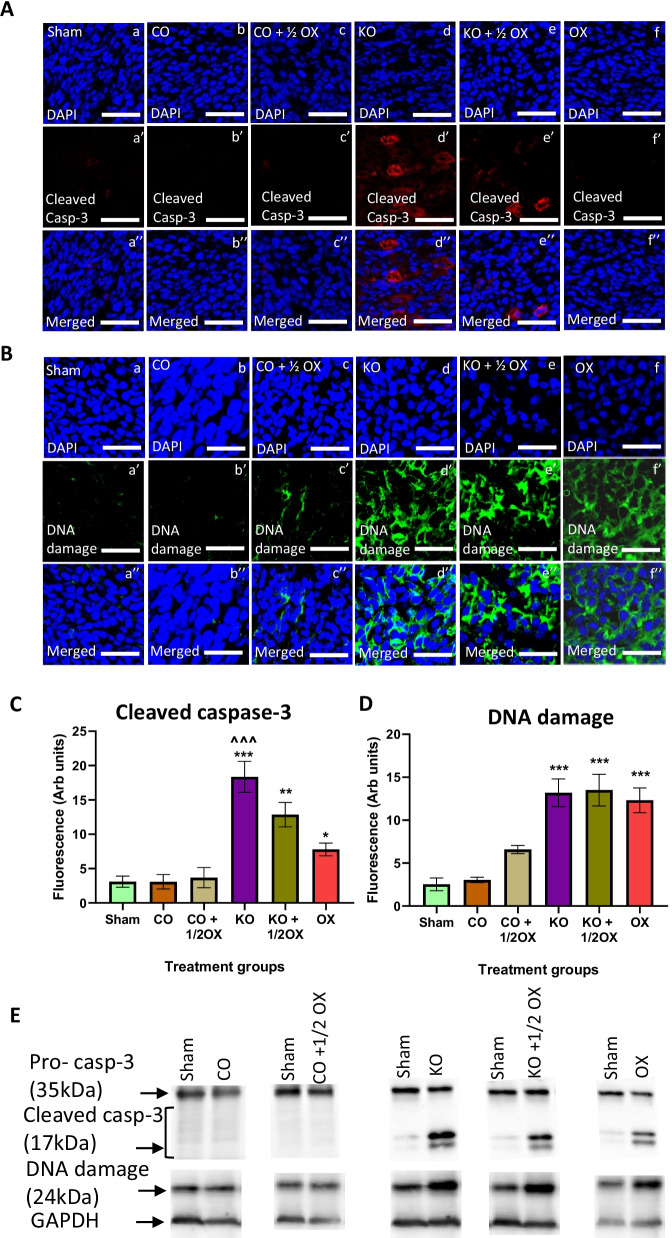
Methods: Thirty-six male Balb/c mice were randomly divided into six groups. Five groups received standard chow diet supplemented with KO (150 g/kg)), corn oil (150 g/kg), KO combined with ½ dose of oxaliplatin (1.5 mg/kg body weight/3 times per week), corn oil combined with ½ dose of oxaliplatin (1.5 mg/kg body weight/3 times per week), or a full dose of oxaliplatin (3 mg/kg body weight/3 times per week). The control (sham) group received a standard chow diet. Treatments started three weeks before and continued for three weeks after orthotopic CRC induction. The number of metastases, tumour weight and volume were quantified ex-vivo. The expression of cytochrome c, cleaved caspase-9 and -3, DNA damage, PD-L1, PD-L2 and HSP-70 were determined.
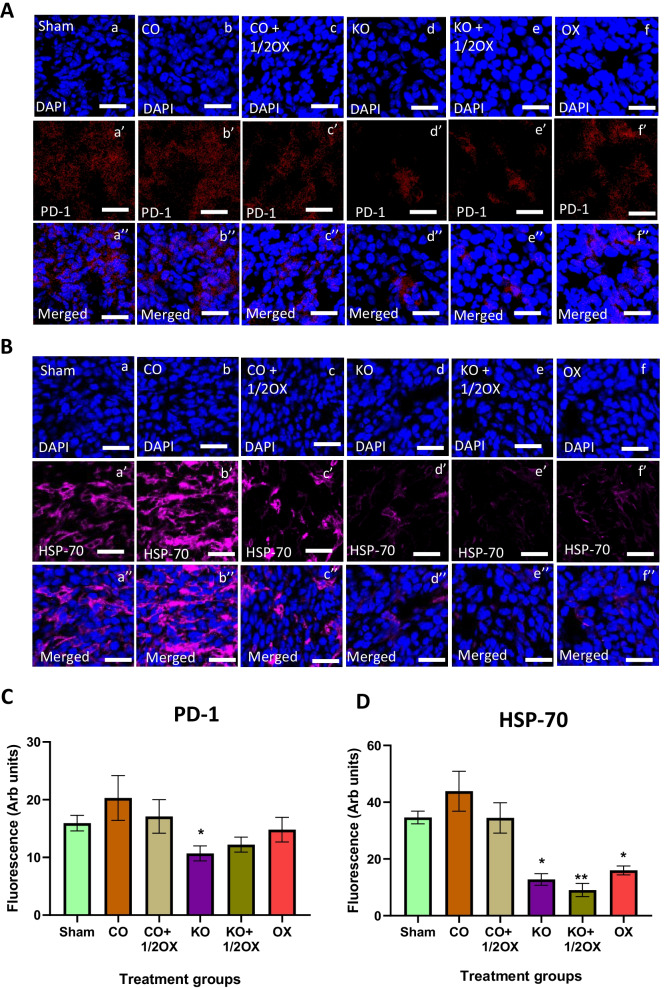
Results: A significant reductions in the weight and volume of tumours were observed in mice treated with KO and KO plus a ½ dose of oxaliplatin compared to the sham group, similar to oxaliplatin-treated mice. KO, and KO plus ½ dose of oxaliplatin significantly increased the expression of cytochrome c, cleaved caspase-9 and -3, and DNA damage and decreased expression of PD-L1, PD-L2 and HSP-70 in tumour tissues compared to the sham group.
Conclusions: The in vivo anti-cancer effects of KO are comparable with oxaliplatin. Thus, dietary KO supplementation has a great potential as a therapeutic/adjunctive agent for CRC treatment.
Keywords: Caspase 3/9; HSP-70; Krill oil; Orthotopic model of colorectal cancer; Oxaliplatin; PD-L1/PD-L2.
© 2022. The Author(s).
Conflict of interest statement
The authors declare that they have no competing interests.
Figures

Similar articles
-
Krill oil supplementation reduces the growth of CT-26 orthotopic tumours in Balb/c mice.BMC Complement Med Ther. 2022 Feb 4;22(1):34. doi: 10.1186/s12906-022-03521-4. BMC Complement Med Ther. 2022. PMID: 35120511 Free PMC article.
-
Krill oil extract suppresses the proliferation of colorectal cancer cells through activation of caspase 3/9.Nutr Metab (Lond). 2019 Aug 17;16:53. doi: 10.1186/s12986-019-0382-3. eCollection 2019. Nutr Metab (Lond). 2019. PMID: 31428181 Free PMC article.
-
NTP Toxicology and Carcinogenesis Studies of Coumarin (CAS No. 91-64-5) in F344/N Rats and B6C3F1 Mice (Gavage Studies).Natl Toxicol Program Tech Rep Ser. 1993 Sep;422:1-340. Natl Toxicol Program Tech Rep Ser. 1993. PMID: 12616289
-
Bioactive Peptides Sensitize Cells to Anticancer Effects of Oxaliplatin in Human Colorectal Cancer Xenografts in Nude Mice.Protein Pept Lett. 2019;26(7):512-522. doi: 10.2174/0929866526666190405124955. Protein Pept Lett. 2019. PMID: 30950338
-
NTP Toxicology and Carcinogenesis Studies of 3,4-Dihydrocoumarin (CAS No. 119-84-6) in F344/N Rats and B6C3F1 Mice (Gavage Studies).Natl Toxicol Program Tech Rep Ser. 1993 Sep;423:1-336. Natl Toxicol Program Tech Rep Ser. 1993. PMID: 12616288
Cited by
-
Krill Oil and Its Bioactive Components as a Potential Therapy for Inflammatory Bowel Disease: Insights from In Vivo and In Vitro Studies.Biomolecules. 2024 Apr 6;14(4):447. doi: 10.3390/biom14040447. Biomolecules. 2024. PMID: 38672464 Free PMC article. Review.
-
Molecular Mechanisms Associated with the Inhibitory Role of Long Chain n-3 PUFA in Colorectal Cancer.Integr Cancer Ther. 2024 Jan-Dec;23:15347354241243024. doi: 10.1177/15347354241243024. Integr Cancer Ther. 2024. PMID: 38708673 Free PMC article. Review.
-
Methamphetamine Induces Systemic Inflammation and Anxiety: The Role of the Gut-Immune-Brain Axis.Int J Mol Sci. 2022 Sep 23;23(19):11224. doi: 10.3390/ijms231911224. Int J Mol Sci. 2022. PMID: 36232524 Free PMC article.
References
-
- Araghi M, Soerjomataram I, Jenkins M, Brierley J, Morris E, Bray F, et al. Global trends in colorectal cancer mortality: projections to the year 2035. Int J Cancer. 2019;144(12):2992–3000. - PubMed
LinkOut - more resources
Full Text Sources
Research Materials
