. 2022 Mar 2;13(1):1118.
doi: 10.1038/s41467-022-28432-3.

In-degree centrality in a social network is linked to coordinated neural activity

Affiliations

In-degree centrality in a social network is linked to coordinated neural activity

Elisa C Baek et al. Nat Commun. .

Abstract

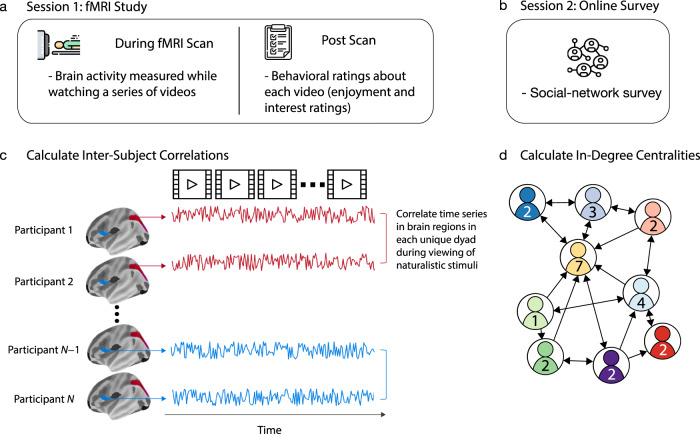
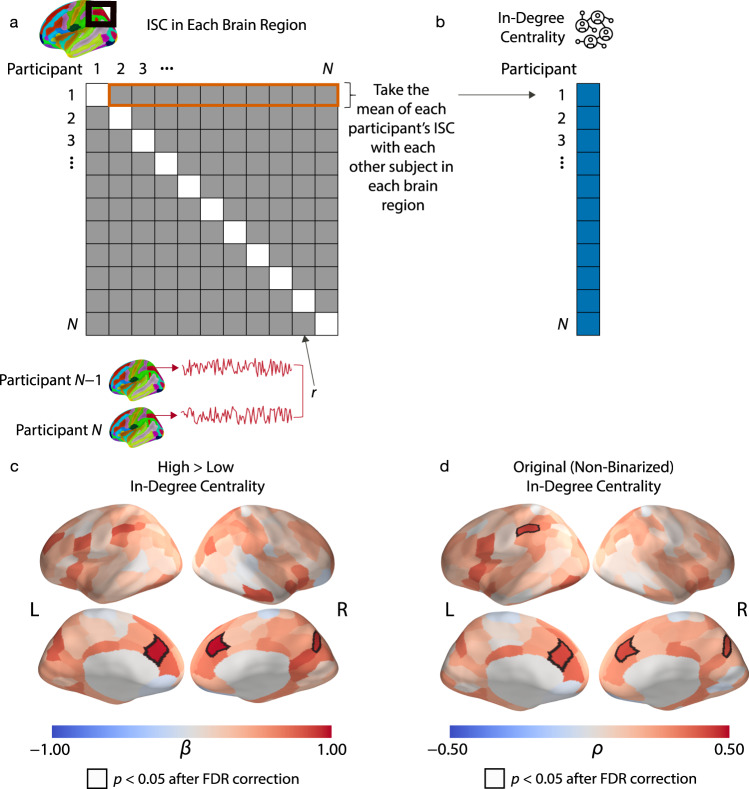
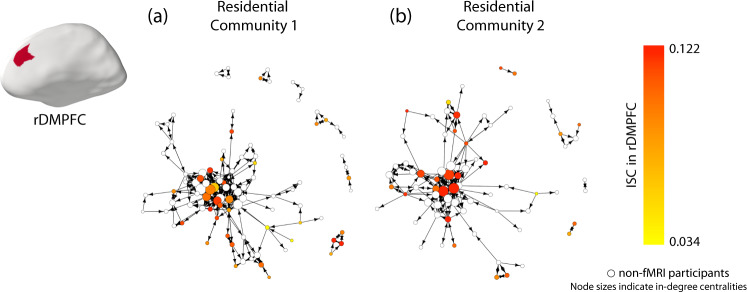
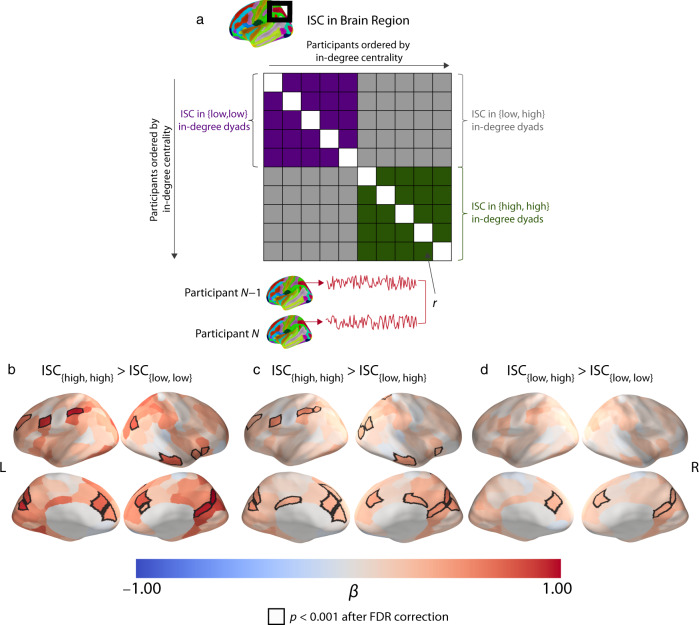
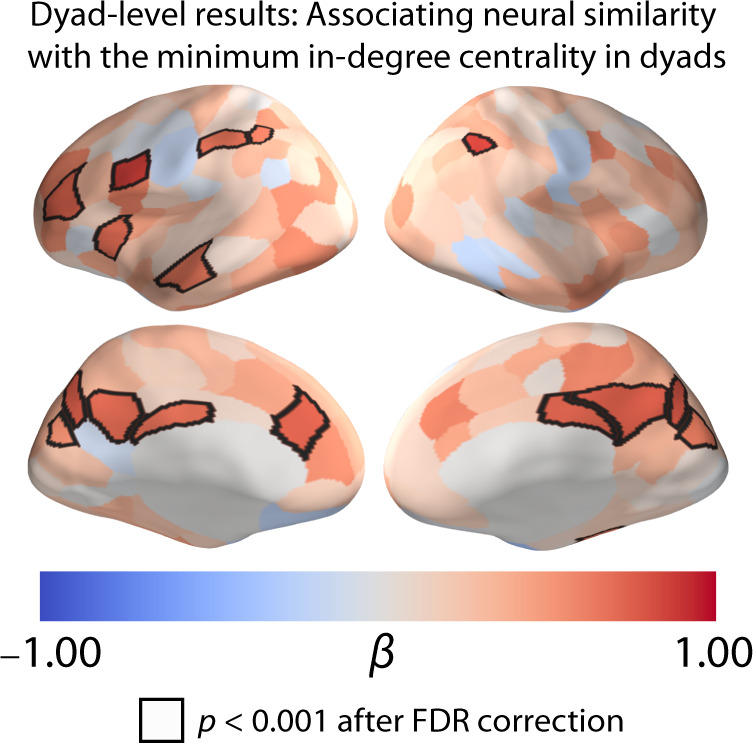
Convergent processing of the world may be a factor that contributes to social connectedness. We use neuroimaging and network analysis to investigate the association between the social-network position (as measured by in-degree centrality) of first-year university students and their neural similarity while watching naturalistic audio-visual stimuli (specifically, videos). There were 119 students in the social-network study; 63 of them participated in the neuroimaging study. We show that more central individuals had similar neural responses to their peers and to each other in brain regions that are associated with high-level interpretations and social cognition (e.g., in the default mode network), whereas less-central individuals exhibited more variable responses. Self-reported enjoyment of and interest in stimuli followed a similar pattern, but accounting for these data did not change our main results. These findings show that neural processing of external stimuli is similar in highly-central individuals but is idiosyncratic in less-central individuals.


Conflict of interest statement

The authors declare no competing interests.

Figures

Fig. 1
Fig. 1. Study paradigm and calculations.
a Schematic of the fMRI study paradigm. In session 1 of the study, participants attended an in-lab session in which their brain activity was measured using fMRI while they watched a series of naturalistic stimuli (i.e., videos). After the fMRI scan, the participants provided ratings on how enjoyable and interesting they found each video. b Schematic of our social-network survey. In session 2 of the study, participants completed an online social-network survey in which they indicated the individuals in their residential community with whom they were friends. c Schematic of neural similarity. We extracted the time series of neural responses that were obtained as participants viewed the stimuli. We then calculated inter-subject correlations (ISCs) of these time series for each of 214 brain regions. d Schematic of our network calculations. Based on the participants’ responses in (b), we constructed two directed, unweighted networks—with one for each residential community—in which each node represents an individual and each directed edge represents one individual nominating another as a friend. For each individual, we calculated in-degree centrality, which counts the number of times that that individual was nominated as a friend by others in their own residential community.
Fig. 2
Fig. 2. Participant-level analysis.
a Our approach for participant-level analysis. First, we Fisher z-transformed the dyad-level ISCs, which are encoded by a matrix of pairwise Pearson correlation coefficients (which we denote by r). We then computed the mean of each participant’s ISC with each other participant. (In other words, we took the mean of each row of the matrix.) We performed the above calculations for each of the 214 brain regions. This yields one ISC value for each participant for each brain region. The ISC value encodes the mean similarity of the neural responses between the participant and each other participant in the corresponding brain region. b We tested for relationships between the participants’ in-degree centralities and these participant-level ISC values in each brain region. c Our results that relate mean ISCs with the binarized in-degree centrality variable indicated that individuals with high in-degree centralities had much larger mean neural similarities with their peers in the bilateral DMPFC and precuneus than individuals with low in-degree centralities. d Our results that relate mean ISCs with the original (i.e., non-binarized) in-degree centrality values gave similar results as the analysis in (c). We found that the mean ISCs in the bilateral DMPFC, precuneus, and the superior parietal lobule were positively correlated with in-degree centrality. The quantity β denotes the standardized regression coefficient, and ρ denotes the Spearman rank correlation. All results are FDR-corrected at p < 0.05, which corresponds to an uncorrected p-value of 0.009 in (c) and an uncorrected p-value of 0.001 in (d). All of the reported p-values are two-tailed. Source data are provided as a Source Data file.
Fig. 3
Fig. 3. Visualization of participant-level ISC results in the social networks.
Visualizations of the social networks of (a) residential community 1 and (b) residential community 2 of a first-year dorm. Each participant was a resident of one of two distinct residential communities, where one “community” consists of the set of people who live in the same wing and floor of a residence hall. Each node (which we show as a disc) represents one resident who was living in one of the communities, and each line segment represents one directed edge between two nodes if it is unidirectional and represents two directed edges if it is bidirectional. For example, an arrow from node A to node B conveys that node A nominated node B as a friend. An edge with two arrowheads indicates a mutually nominated friendship. The size of a node represents its in-degree centrality, with larger nodes indicating individuals with higher in-degree centralities. The color of the nodes represents a node’s mean neural similarity in the rDMPFC to other members of its residential community, with darker colors indicating greater neural similarities. As this figure indicates, individuals with higher in-degree centralities (i.e., individuals who many other individuals nominated as a friend) tended to have the largest mean ISCs with their peers in the rDMPFC. Source data are provided as a Source Data file.
Fig. 4
Fig. 4. Dyad-level analysis and results.
a Dyad-level ISCs in a brain region are encoded in a matrix whose entries consist of pairwise Pearson correlation coefficients. The rows and columns of the matrix are ordered according to the in-degree centralities of the participants. We performed planned contrasts of the different centrality groups to test whether dyads in which both individuals were highly central (i.e., ISC{high,high}), had larger ISCs than dyads in which both individuals were less central (i.e., ISC{low,low}) and than dyads with mixed centralities (i.e., ISC{low,high}), for which one individual of the dyad had a low centrality and the other had a high centrality. [The figure in (a) is adapted from prior work.] b There were larger ISCs in the DMPFC, VMPFC,VLPFC, precuneus, temporal pole, and portions of the superior parietal lobule in {high, high} dyads than in {low, low} dyads. c We found similar patterns when we compared {high, high} dyads to {low, high} dyads and d when we compared {low, high} dyads to {low, low} dyads. The ISC{high,high} > ISC{low,low} contrast in (b) provides the most direct test of our main hypotheses that highly-central individuals have similar neural responses to one another and that less-central individuals have neural responses that are idiosyncratic. The quantity β is the standardized regression coefficient. Regions with significant differences for each contrast are outlined in black. We used an FDR-corrected significance threshold of p < 0.001, which corresponds to an uncorrected p-value threshold of p < 6.386 × 10−5. All of the reported p-values are two-tailed. Source data are provided as a Source Data file.
Fig. 5
Fig. 5. Dyad-level associations of neural similarity with the minimum in-degree centrality of dyads.
We found a positive association between ISC and minimum in-degree centrality. Larger ISCs in brain regions (including the DMPFC, the VLPFC, the precuneus, the temporal pole, and portions of the superior parietal lobule) were associated with a higher minimum in-degree centrality. The quantity β is the standardized regression coefficient. Regions where we observed significant associations between in-degree centrality and ISC are outlined in black. We used an FDR-corrected significance threshold of p < 0.001, which corresponds to an uncorrected p-value threshold of p < 8.879 × 10−5. All of the reported p-values are two-tailed. Source data are provided as a Source Data file.

References

    1. Cacioppo JT, Cacioppo S. Social relationships and health: the toxic effects of perceived social isolation. Soc. Personal. Psychol. Compass. 2014;8:58–72. - PMC - PubMed
    1. Shankar A, McMunn A, Banks J, Steptoe A. Loneliness, social isolation, and behavioral and biological health indicators in older adults. Heal. Psychol. 2011;30:377–385. - PubMed
    1. Hawkley LC, Burleson MH, Berntson GG, Cacioppo JT. Loneliness in everyday life: cardiovascular activity, psychosocial context, and health behaviors. J. Pers. Soc. Psychol. 2003;85:105–120. - PubMed
    1. Hawkley LC, Cacioppo JT. Loneliness matters: a theoretical and empirical review of consequences and mechanisms. Ann. Behav. Med. 2010;40:218–227. - PMC - PubMed
    1. Moieni M, Eisenberger NI. Social isolation and health. Wiley Encycl. Heal. Psychol. 2020;2:695–702.

Publication types