

Pandemic-response adenoviral vector and RNA vaccine manufacturing
- PMID: 35236838
- PMCID: PMC8891260
- DOI: 10.1038/s41541-022-00447-3
Pandemic-response adenoviral vector and RNA vaccine manufacturing
Abstract
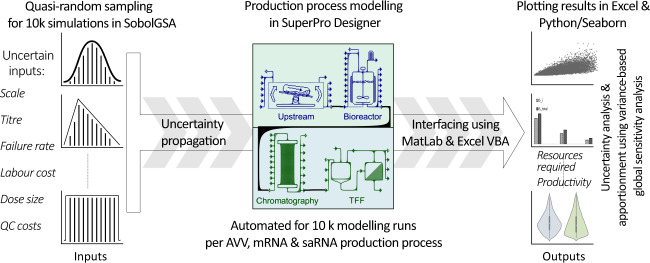
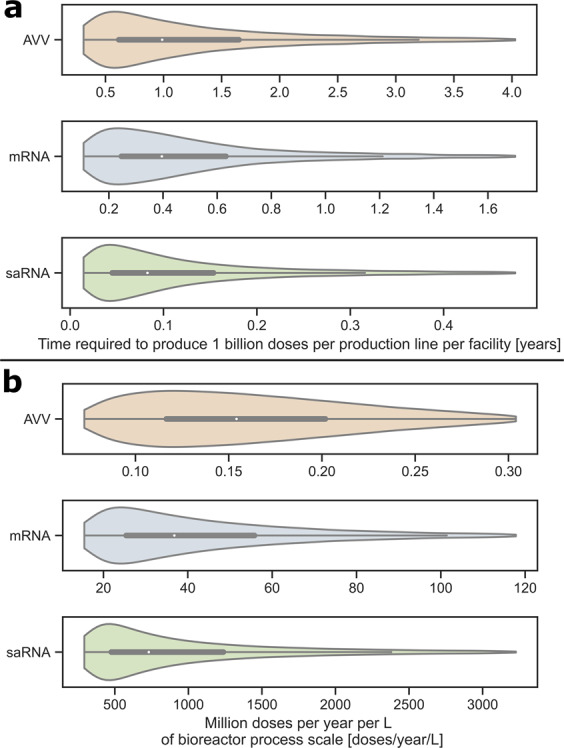
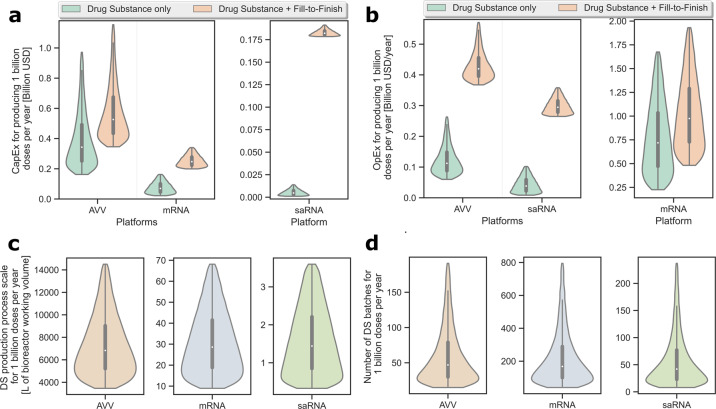
Rapid global COVID-19 pandemic response by mass vaccination is currently limited by the rate of vaccine manufacturing. This study presents a techno-economic feasibility assessment and comparison of three vaccine production platform technologies deployed during the COVID-19 pandemic: (1) adenovirus-vectored (AVV) vaccines, (2) messenger RNA (mRNA) vaccines, and (3) the newer self-amplifying RNA (saRNA) vaccines. Besides assessing the baseline performance of the production process, impact of key design and operational uncertainties on the productivity and cost performance of these vaccine platforms is quantified using variance-based global sensitivity analysis. Cost and resource requirement projections are computed for manufacturing multi-billion vaccine doses for covering the current global demand shortage and for providing annual booster immunisations. The model-based assessment provides key insights to policymakers and vaccine manufacturers for risk analysis, asset utilisation, directions for future technology improvements and future epidemic/pandemic preparedness, given the disease-agnostic nature of these vaccine production platforms.
© 2022. The Author(s).
Conflict of interest statement
The authors declare no competing interests.
Figures

References
-
- Kis, Z. et al. Rapid development and deployment of high‐volume vaccines for pandemic response. J. Adv. Manuf. Process. 2, e10060. https://www.ncbi.nlm.nih.gov/pmc/articles/PMC7361221/ (2020). - PMC - PubMed
-
- Wang, J. et al. The COVID-19 Vaccine Race: Challenges and Opportunities in Vaccine Formulation. AAPS PharmSciTech21, 225. https://pubmed.ncbi.nlm.nih.gov/32761294 (2020). - PMC - PubMed
-
- Spadaro, B. COVID-19 vaccines: challenges and promises of trials, manufacturing and allocation of doses. Futur Drug Discov. 10.4155/fdd-2020-0031 (2020).
-
- Kim, J. H., Marks, F. & Clemens, J. D. Looking beyond COVID-19 vaccine phase 3 trials. Nat. Med.10.1038/s41591-021-01230-y (2021). - PubMed
Grants and funding
- EP/V01479X/1/RCUK | Engineering and Physical Sciences Research Council (EPSRC)
- EP/R013756/1/RCUK | Engineering and Physical Sciences Research Council (EPSRC)
- EP/R013764/1/RCUK | Engineering and Physical Sciences Research Council (EPSRC)
- EP/V01479X/1/RCUK | Engineering and Physical Sciences Research Council (EPSRC)
- EP/R013756/1/RCUK | Engineering and Physical Sciences Research Council (EPSRC)
- EP/R013764/1/RCUK | Engineering and Physical Sciences Research Council (EPSRC)
- EP/V01479X/1/RCUK | Engineering and Physical Sciences Research Council (EPSRC)
- EP/R013756/1/RCUK | Engineering and Physical Sciences Research Council (EPSRC)
- EP/R013764/1/RCUK | Engineering and Physical Sciences Research Council (EPSRC)
- EP/V01479X/1/RCUK | Engineering and Physical Sciences Research Council (EPSRC)
- EP/R013756/1/RCUK | Engineering and Physical Sciences Research Council (EPSRC)
- EP/R013764/1/RCUK | Engineering and Physical Sciences Research Council (EPSRC)
- EP/V01479X/1/RCUK | Engineering and Physical Sciences Research Council (EPSRC)
- EP/R013756/1/RCUK | Engineering and Physical Sciences Research Council (EPSRC)
- EP/R013764/1/RCUK | Engineering and Physical Sciences Research Council (EPSRC)
- EP/V01479X/1/RCUK | Engineering and Physical Sciences Research Council (EPSRC)
- EP/R013756/1/RCUK | Engineering and Physical Sciences Research Council (EPSRC)
- EP/R013764/1/RCUK | Engineering and Physical Sciences Research Council (EPSRC)
- EP/V01479X/1/RCUK | Engineering and Physical Sciences Research Council (EPSRC)
- EP/R013756/1/RCUK | Engineering and Physical Sciences Research Council (EPSRC)
- EP/R013764/1/RCUK | Engineering and Physical Sciences Research Council (EPSRC)
LinkOut - more resources
Full Text Sources
