. 2022 Mar 2;13(1):1128.
doi: 10.1038/s41467-022-28603-2.

Secondary structural ensembles of the SARS-CoV-2 RNA genome in infected cells

Affiliations

Secondary structural ensembles of the SARS-CoV-2 RNA genome in infected cells

Tammy C T Lan et al. Nat Commun. .

Abstract

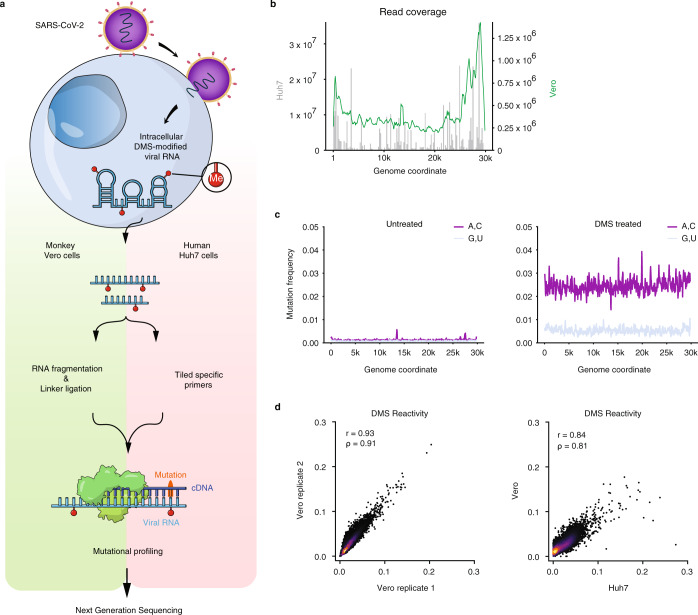
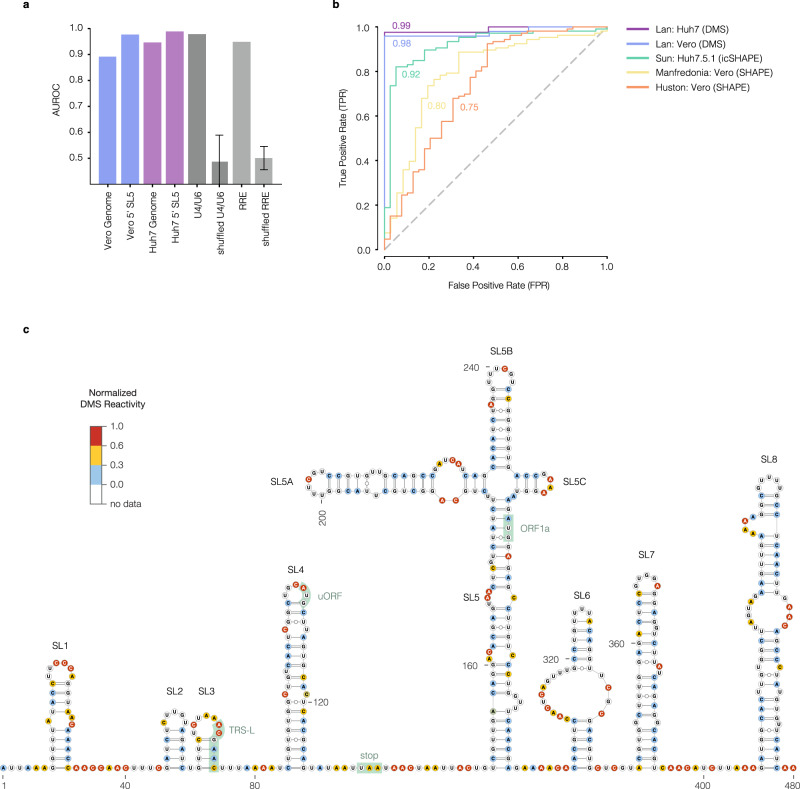
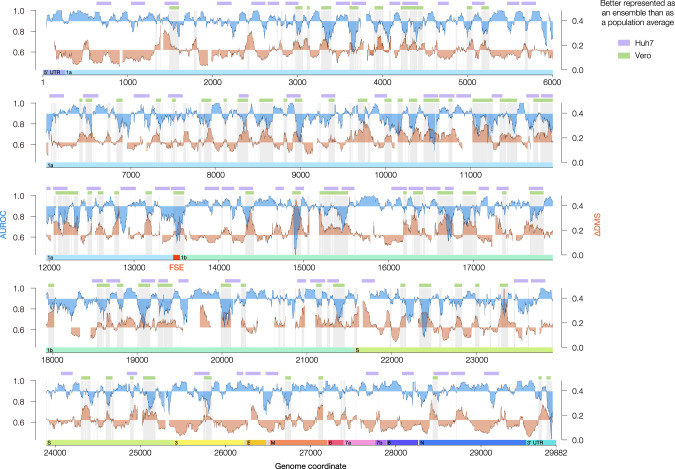
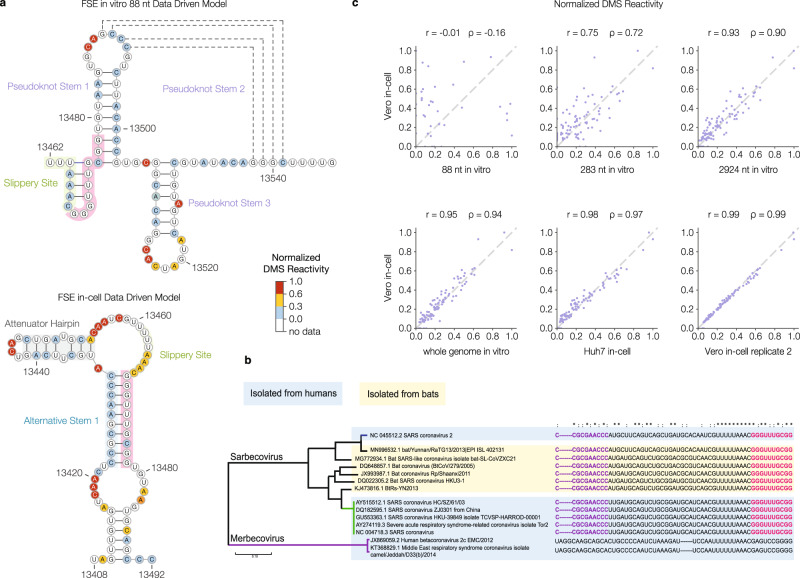
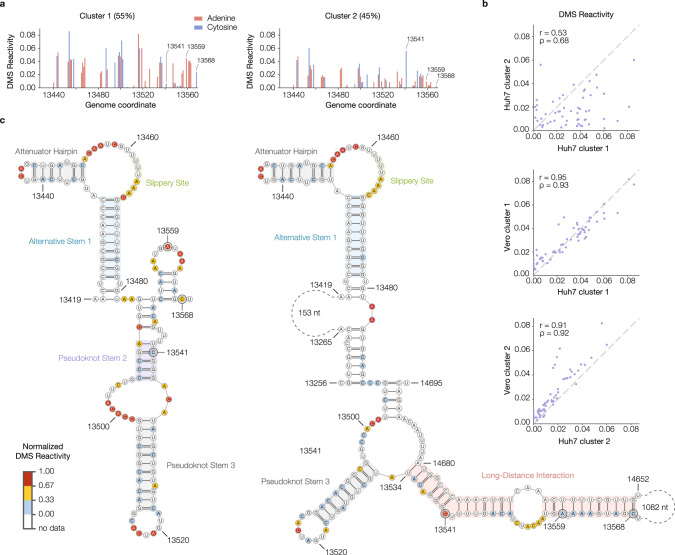
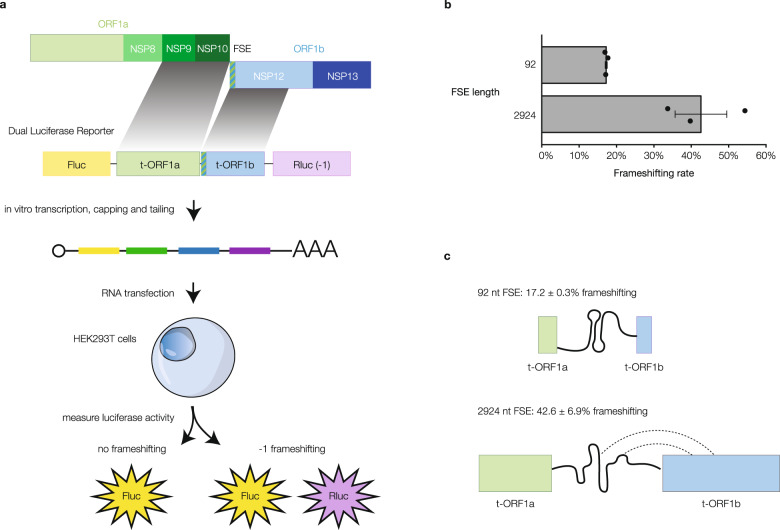
SARS-CoV-2 is a betacoronavirus with a single-stranded, positive-sense, 30-kilobase RNA genome responsible for the ongoing COVID-19 pandemic. Although population average structure models of the genome were recently reported, there is little experimental data on native structural ensembles, and most structures lack functional characterization. Here we report secondary structure heterogeneity of the entire SARS-CoV-2 genome in two lines of infected cells at single nucleotide resolution. Our results reveal alternative RNA conformations across the genome and at the critical frameshifting stimulation element (FSE) that are drastically different from prevailing population average models. Importantly, we find that this structural ensemble promotes frameshifting rates much higher than the canonical minimal FSE and similar to ribosome profiling studies. Our results highlight the value of studying RNA in its full length and cellular context. The genomic structures detailed here lay groundwork for coronavirus RNA biology and will guide the design of SARS-CoV-2 RNA-based therapeutics.


Conflict of interest statement

The authors declare no competing interests.

Figures

Fig. 1
Fig. 1. Genome-wide probing of SARS-CoV-2 RNA structure in infected Vero and Huh7 cells with DMS-MaPseq.
a Schematic of the experimental protocol for probing severe acute respiratory syndrome coronavirus 2 (SARS-CoV-2) RNA structures in Vero and Huh7 cells using dimethyl sulfate mutational profiling with sequencing (DMS-MaPseq). b Read coverage as a function of genome coordinate for Huh7 cells using tiling specific primers (gray bars, left axis) and Vero cells using linker ligation (green curve, right axis); Vero coverage was smoothed by taking the mean over a sliding window of 500 nt. c Signal vs. noise plots of mutation frequencies (i.e., among all reads aligning to each genome coordinate, the fraction of reads with a mutation at that coordinate) on adenines (As) and cytosines (Cs) vs. guanines (Gs) and uracils (Us) as a function of genome coordinate for untreated and DMS-treated RNA. A mutation frequency of 0.01 at a given position represents 1% of reads having a mismatch or deletion at that position. Signal and noise were smoothed by taking the mean over 100 nt windows in increments of 50 nt. d Comparison of DMS reactivities on As and Cs between biological replicates in Vero cells (left) and between the averaged of Vero replicates and Huh7 cells (right). Pearson (r) and Spearman (ρ) correlation coefficients are shown. For each sample, the top 0.05% of mutational fractions (values over 0.27 for Vero and 0.38 for Huh7) were considered outliers and excluded from the plot and calculation of correlation coefficients. Source data are provided as a Source Data file.
Fig. 2
Fig. 2. Quality assessment of the SARS-CoV-2 secondary structure model.
a Agreement between DMS reactivities and predicted structures for the Vero and Huh7 genomes, and the consensus structure of 5′ untranslated region (UTR) stem–loop 5 (SL5; coordinates 150–294), measured as the area under the receiver operating characteristic curve (AUROC). AUROC values between DMS-MaPseq data and well-established structures are also shown for two positive control RNAs: U4/U6 snRNA and HIV-1 Rev Response Element (RRE). As negative controls, n = 100 shuffled datasets were generated by randomly permuting the DMS reactivities and recomputing the AUROC. Data are presented as means ± SD. b Receiver operating characteristic (ROC) curves comparing the literature consensus structure of SARS-CoV-2 SL5 (coordinates 150–294) with DMS/SHAPE reactivities from our datasets and those from other authors. Each AUROC value is shown next to its ROC curve. For each dataset, the first author, cell type, and chemical probe are indicated. c Model of the first 480 nt of the SARS-CoV-2 genome (including the 5′ UTR, coordinates 1–265) based on DMS reactivities from Vero cells. Nucleotides are colored by normalized DMS reactivities. Highlighted features include stem–loops (SL) 1–8, the leader TRS (TRS-L), the start codons of the upstream ORF (uORF) and ORF1a, and the stop codon of uORF. Source data are provided as a Source Data file.
Fig. 3
Fig. 3. Alternative RNA structures form across the SARS-CoV-2 genome.
Agreement between DMS reactivities and predicted secondary structures (AUROC, blue) and the difference in DMS reactivity between clusters 1 and 2 (∆DMS, orange) for the genome-wide model in Vero. Both quantities were calculated over sliding windows of 80 nt in 1 nt increments; x values represent the centers of the windows. Windows with <10 paired or <10 unpaired bases were excluded from the calculation of AUROC; windows with <10 bases that clustered into at least two structures were excluded from the calculation of ∆DMS. For AUROC and ∆DMS, the area between the local value and the genome-wide median is shaded. For the Vero model, all coordinates best described by structure ensembles (AUROC below median, ∆DMS above median) are shaded in light gray. The green bars represent a denoised version of these coordinates (see Methods). For the Huh7 model, regions meeting criteria for alternative structures (see Methods) are labeled with lavender bars. The locations of the untranslated regions (UTRs) and open reading frames (ORFs) of SARS-CoV-2 are indicated below the AUROC and ∆DMS data. The frameshifting stimulation element (FSE, coordinates 13,462–13,546) is highlighted in red. Source data are provided as a Source Data file.
Fig. 4
Fig. 4. The frameshifting stimulation element (FSE) adopts an unexpected structure in cells.
a Predicted structures of the FSE derived from DMS-MaPseq on in vitro-transcribed 88 nt RNA (top) and infected Vero cells (bottom). For the 88 nt RNA, reads were clustered into K = 3 clusters; in the cluster with the largest fraction of reads (60%), the given pseudoknot was among the three minimum-energy structures. Nucleotides are colored by normalized DMS reactivities (see Methods). The 5′ and 3′ sides of the alternative stem 1 (AS1) are highlighted in blue and pink, respectively (bottom), and the sequence that forms the 3′ side of AS1 is also highlighted in pink in the top structure. b Sequence conservation of FSE alternative stem 1 pairing. The 5′ and 3′ sequences of alternative stem 1 are highlighted in purple and pink, respectively. Symbols above the sequences indicate perfect conservation among all viruses in the alignment (*) or perfect conservation among only the sarbecoviruses (:). Source data are provided as a Source Data file. c Scatterplots of DMS reactivities over the FSE, comparing infected Vero cells and other contexts: 88 nt, 283 nt, or 2924 nt RNA fragments containing the FSE folded in vitro; whole genomic RNA extracted from virions and refolded in vitro; infected Huh7 cells; and a replicate of infected Vero cells. In each sample, DMS reactivities have been normalized by dividing by the maximum reactivity. For each comparison, the Pearson (r) and Spearman (ρ) correlation coefficients are given.
Fig. 5
Fig. 5. Alternative conformations of the frameshifting stimulation element (FSE) derived from in-cell DMS-MaPseq data include a long-distance interaction.
a DMS reactivity profiles for both clusters from the Huh7 genome-wide RT-PCR data in the vicinity of the FSE (nucleotides 13,434–13,568). The abundance of each cluster is given beside its name. Each bar representing an adenine or cytosine is colored in red or blue, respectively. Three of the nucleotides whose reactivities differ substantially between clusters are labeled. b Scatterplots of DMS reactivities over the FSE, comparing the two clusters from Huh7 (top) and each Huh7 cluster with the corresponding cluster from Vero cells (middle and bottom). For each comparison, the Pearson (r) and Spearman (ρ) correlation coefficients are given. c Predicted structures of Huh7 clusters 1 and 2 based on DMS reactivities. In each structure, selected features are highlighted, including alternative stem 1 (in both clusters), a long-distance interaction (in cluster 2), and features that are also present in the canonical pseudoknot. The three nucleotides labeled in (a) are also labeled in the structure models. Nucleotides are colored by normalized DMS reactivities. Source data are provided as a Source Data file.
Fig. 6
Fig. 6. The long frameshifting stimulation element (FSE) has a dramatically higher frameshifting rate than the minimal FSE.
a Schematic of the 2924 nt dual-luciferase construct containing the FSE. The construct consists of truncated parts of segments a and b of open reading frame 1 (t-ORF1ab) encoding non-structural proteins (nsps) nsp9, nsp10, and most of nsp12 inserted between firefly luciferase (Fluc) in reading frame 0 and Renilla luciferase (Rluc) in reading frame −1. With −1 frameshifting, both Fluc and Rluc are expressed; without, only Fluc is expressed. b Rate of −1 ribosomal frameshifting calculated as Rluc/Fluc normalized against amino-acid matched positive and negative controls for both 92 nt and 2924 nt inserts for n = 3 biologically independent experiments. Data are presented as mean values ± SEM. P = 0.053 for difference in means, two-sided Welch’s t-test. c Schematic of the RNA structure ensemble speculated to lead to a higher frameshifting rate. Source data are provided as a Source Data file.

References

    1. Wouters OJ, et al. Challenges in ensuring global access to COVID-19 vaccines: production, affordability, allocation, and deployment. Lancet. 2021;397:1023–1034. doi: 10.1016/S0140-6736(21)00306-8. - DOI - PMC - PubMed
    1. Ngo, B. T. et al. The time to offer treatments for COVID-19. 30, 505–518 10.1080/13543784.2021.1901883 (2021). - PMC - PubMed
    1. Mahase E. Covid-19: molnupiravir reduces risk of hospital admission or death by 50% in patients at risk, MSD reports. Br. Med. J. 2021;375:n2422. doi: 10.1136/bmj.n2422. - DOI - PubMed
    1. Mahase E. Covid-19: Pfizer’s paxlovid is 89% effective in patients at risk of serious illness, company reports. Br. Med. J. 2021;375:n2713. doi: 10.1136/bmj.n2713. - DOI - PubMed
    1. Masters, P. S. The molecular biology of coronaviruses. Adv. Virus Res.10.1016/S0065-3527(06)66005-3 (2006). - PMC - PubMed

Publication types