. 2022 Mar 2;13(1):1127.
doi: 10.1038/s41467-022-28753-3.

Two zinc finger proteins with functions in m6A writing interact with HAKAI

Affiliations

Two zinc finger proteins with functions in m6A writing interact with HAKAI

Mi Zhang et al. Nat Commun. .

Abstract

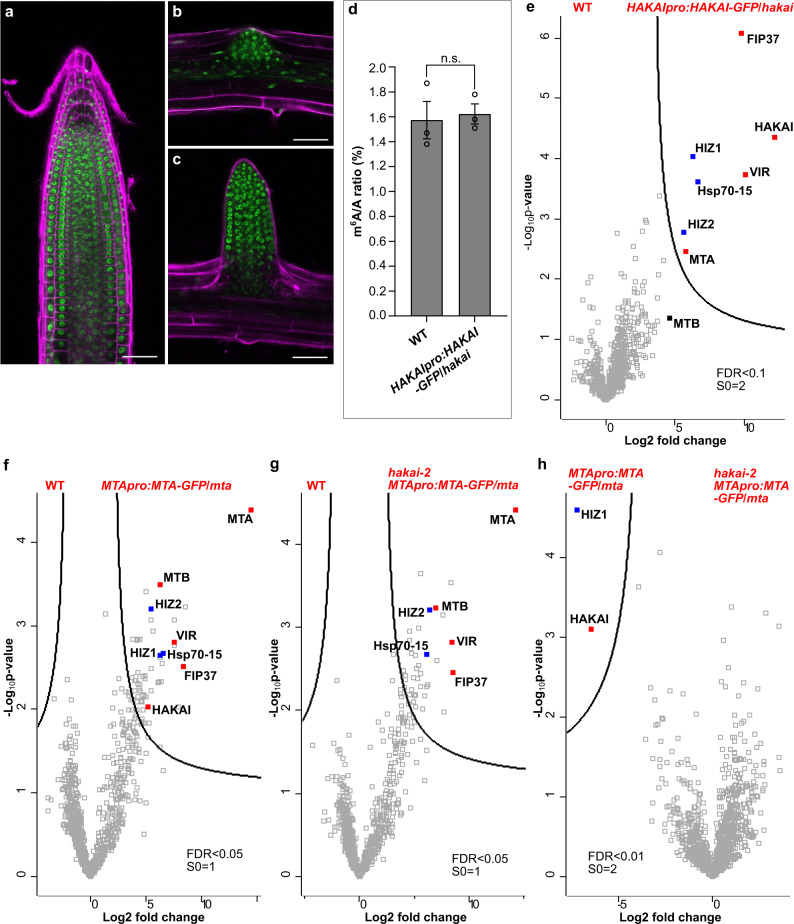
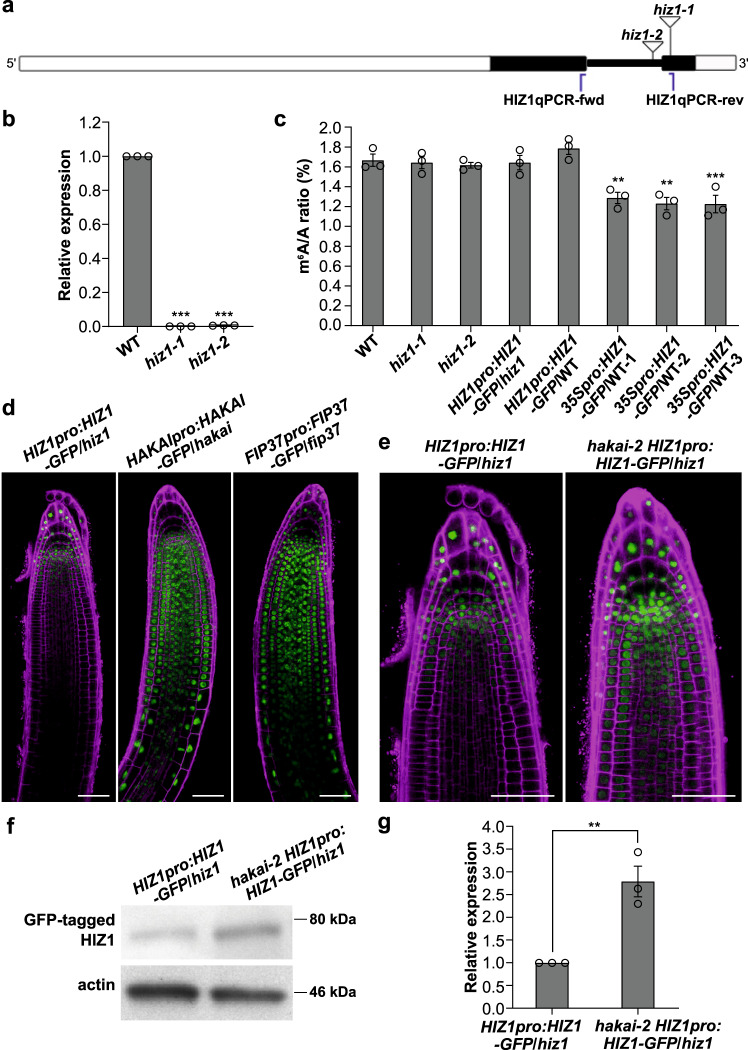
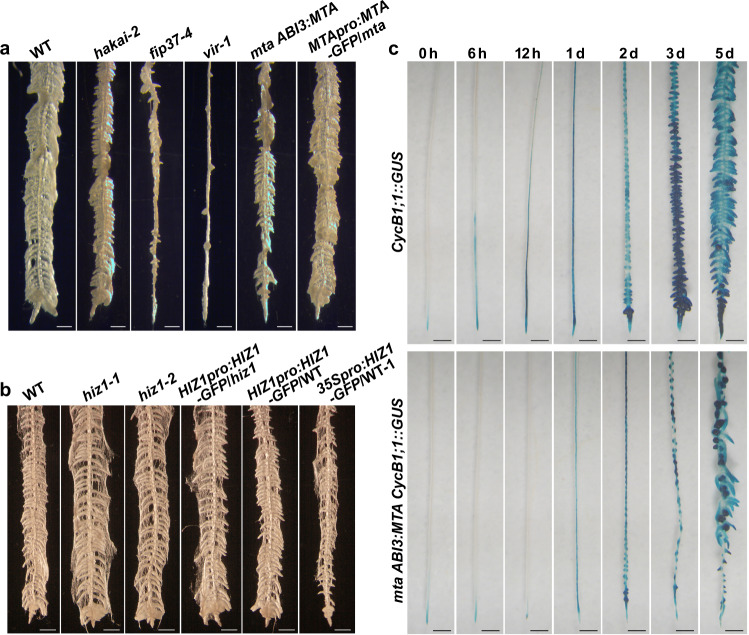
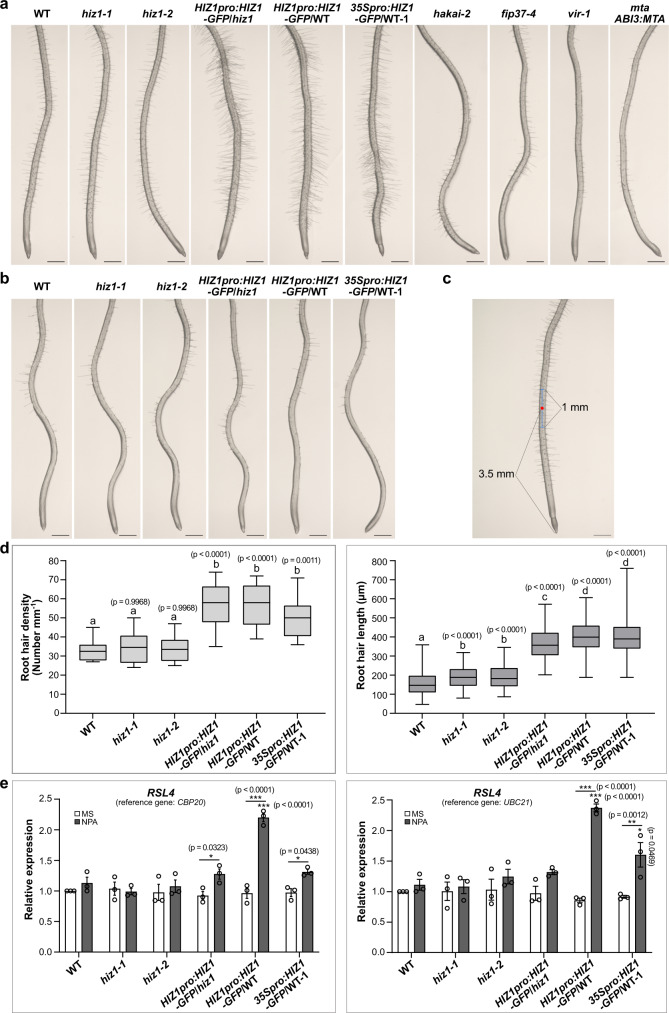
The methyltransferase complex (m6A writer), which catalyzes the deposition of N6-methyladenosine (m6A) in mRNAs, is highly conserved across most eukaryotic organisms, but its components and interactions between them are still far from fully understood. Here, using in vivo interaction proteomics, two HAKAI-interacting zinc finger proteins, HIZ1 and HIZ2, are discovered as components of the Arabidopsis m6A writer complex. HAKAI is required for the interaction between HIZ1 and MTA (mRNA adenosine methylase A). Whilst HIZ1 knockout plants have normal levels of m6A, plants in which it is overexpressed show reduced methylation and decreased lateral root formation. Mutant plants lacking HIZ2 are viable but have an 85% reduction in m6A abundance and show severe developmental defects. Our findings suggest that HIZ2 is likely the plant equivalent of ZC3H13 (Flacc) of the metazoan m6A-METTL Associated Complex.


Conflict of interest statement

The authors declare no competing interests.

Figures

Fig. 1
Fig. 1. Characterization of the HAKAIpro:HAKAI-GFP/hakai line and in vivo analysis of proteins interacting with HAKAI or MTA using GFP-tagged baits.
ac The localization of GFP-tagged HAKAI in roots of 5-day-old HAKAIpro:HAKAI-GFP/hakai. a A primary root tip. b A lateral root initiation site. c A formed lateral root. Scale bar = 50 μm. Experiments in ac were repeated independently at least three times, and representative images are shown. d m6A levels checked by two-dimensional thin layer chromatography (TLC) analysis. Data represent mean ± SE from three biological replicates and statistically significant differences relative to WT were analyzed by two-sided unpaired t-test (n.s. no significance). p = 0.7845. eh Volcano plots showing proteins co-purified with HAKAI or MTA. The distribution of quantified proteins was plotted according to the Log2 fold change of label free quantification (LFQ) intensities and −Log10p-value obtained from two-sided student t-test of three independent experiments. Significantly enriched proteins were separated from others by a hyperbolic curve. Proteins indicated with filled squares represent known m6A writer complex members (red) and additional components identified in this work (blue). e HAKAIpro:HAKAI-GFP/hakai versus WT. HIZ1 and HIZ2 refer to HAKAI-interacting zinc finger protein 1 and 2 (AT1G32360 and AT5G53440, respectively). MTB is indicated not directly interacting with HAKAI, labeled with a black filled square. f MTApro:MTA-GFP/mta versus WT. g hakai-2 MTApro:MTA-GFP/mta versus WT. h hakai-2 MTApro:MTA-GFP/mta versus MTApro:MTA-GFP/mta. Source data are provided as a Source Data file.
Fig. 2
Fig. 2. Characterizing Arabidopsis HIZ1.
a Schematic of HIZ1 (AT1G32360) genomic DNA sequence with T-DNA insertion sites and the primer pair used for RT-qPCR. White rectangles denote UTRs of HIZ1 genomic DNA, black rectangles denote exons and thick black lines represent introns. hiz1-1 refers to Salk_045882 and hiz1-2 refers to Salk_000717. Blue lines represent the locations of primers. b The transcript levels of HIZ1 analyzed by RT-qPCR using the primer pair labeled in a. CBP20 was used as a reference gene. Data here and in c represent mean ± SE from three biological replicates and statistically significant differences relative to WT were analyzed by One-Way ANOVA (one-sided test) and marked with asterisks (**p < 0.01; ***p < 0.001). p < 0.0001 (hiz1-1); p < 0.0001 (hiz1-2). c m6A levels checked by two-dimensional thin layer chromatography (TLC) analysis. In one-way ANOVA test, p = 0.9996 (hiz1-1); p = 0.9907 (hiz1-2); p = 0.9996 (HIZ1pro:HIZ1-GFP/hiz1); p = 0.6393 (HIZ1pro:HIZ1-GFP/WT); p = 0.0036 (35Spro:HIZ1-GFP/WT-1); p = 0.001 (35Spro:HIZ1-GFP/WT-2); p = 0.0009 (35Spro:HIZ1-GFP/WT-3). d, e Localization of GFP-tagged proteins in primary root tips of 3-day-old seedlings. Scale bar = 50 μm. Experiments in d, e were repeated independently at least three times, and representative images are shown. f Western blot demonstrating the increased protein level of GFP-tagged HIZ1 in the hakai-2 background. Experiments in f were repeated independently three times with similar results. g Transcript levels of HIZ1pro:HIZ1-GFP analyzed by RT-qPCR using the same primer pair as that in b. CBP20 was used as a reference gene. Data represent mean ± SE from three biological replicates and the statistically significant difference was analyzed by two-sided unpaired t-test and marked with asterisks (**p < 0.01). p = 0.0061. Source data are provided as a Source Data file.
Fig. 3
Fig. 3. Root morphology under the pericycle activation for lateral root induction.
a, b Root morphology of seedlings after being treated with 1-naphthaleneacetic acid (NAA, 10 μM) for 5 days following N-1-naphthylphthalamic acid (NPA) treatment. Roots were soaked in 100% ethanol for a few seconds to minimize the effect of root hairs in photographing lateral roots. Scale bar = 500 μm. c GUS staining showing CycB1;1::GUS activities in WT and mta ABI3:MTA backgrounds during a time-course growth on NAA after NPA treatment. Scale bar = 500 μm.
Fig. 4
Fig. 4. Root hair morphology under the N-1-naphthylphthalamic acid treatment.
a Root morphology after being treated with N-1-naphthylphthalamic acid (NPA, 10 μM) for 6 days. Scale bar = 500 μm. b Roots from 0.5× MS control of the same age as those in a. Scale bar = 500 μm. Experiments in a, b were repeated independently at least three times, and representative images are shown. c A schematic illustrating how root hair density and lengths were measured. The number of root hairs in the middle 1 mm segment (shown using a blue segment with a red dot in the middle) of the imaged root represents the root hair density. The lengths of 10 root hairs on each side of the primary root in the middle 1 mm segment were measured to indicate its representative root hair length. Scale bar = 500 μm. d Statistical data showing root hair density and lengths. Ten seedlings were used for the measurement for each line. Data represent mean ± SE and statistically significant differences were analyzed by One-Way ANOVA (one-sided test). p values labeled in the diagram represent the comparisons with WT and letters represent significance at p < 0.01. In box plots, the center line in each box indicates the median. The lower and upper bounds of each box represent the first quartile (25%) and the third quartile (75%), respectively. The bottom and top of whiskers denote the minimum and maximum, respectively. e Transcript levels of RSL4 analyzed by RT-qPCR. Samples were roots grown on NPA or the control (0.5× MS medium without NPA) for 6 days after germinating on 0.5× MS for 4 days. Data represent mean ± SE from three biological replicates. Statistically significant differences were analyzed by two-way ANOVA (one-sided test) and marked with asterisks (*p < 0.05; ***p < 0.001). Asterisks labeled just above the column are for comparing with WT grown under the same condition and those labeled above both columns for each line are for the comparison between two growth conditions (with or without NPA). Source data are provided as a Source Data file.
Fig. 5
Fig. 5. MeRIP-Seq analysis of three key components of the m6A writer complex mutants.
a Metagene profile of the global distribution of m6A in WT, hakai-2, fip37-4 and vir-1. b Frequency of m6A sites in the different transcript parts in relation to their genomic position. c m6A topology differences between hakai-2 and WT in two key transcripts involved in root hair development (images from Integrative Genomics Viewer [IGV]). IP: immunoprecipitation. y axis scale for ACT2: 0–4000 reads; y axis scale for ARAC5 inputs: 0–1000 reads and for IPs: 0–4000 reads. Red lines here and in d represent the positions of predicted m6A peaks. d m6A topology differences between fip37-4 and WT in two examples of the GOBP mRNA polyadenylation group (images from IGV). y axis scale for both CFIS2 and PAPS4: 0–1000 reads.
Fig. 6
Fig. 6. Characterizing Arabidopsis HIZ2.
a Schematic of HIZ2 (AT5G53440) genomic DNA sequence with T-DNA insertion sites. HIZ2.1 and HIZ2.2 refer to two splice variants. White rectangles denote UTRs, black rectangles denote exons and thick black lines represent introns. hiz2-1 to hiz2-3 refer to Salk_120590, Salk_020625 and Salk_126486, respectively. HIZ2qPCR-fwd-1 and HIZ2qPCR-rev-1 were used as the first primer pair while HIZ2qPCR-fwd-2 and HIZ2qPCR-rev-2 were the second primer pair in RT-qPCR. b, c HIZ2 transcript levels checked by RT-qPCR using the first primer pair (b) and the second primer pair (c) labeled in a. CBP20 was used as a reference gene. Data represent mean ± SE from three biological replicates. Statistically significant differences relative to WT here and in f, g, j were analyzed by One-Way ANOVA (one-sided test) and marked with asterisks (***p < 0.001). d Five-week-old hiz2 mutants and WT planted in compost. Scale bar = 1 cm. e Eleven-day-old seedlings vertically cultured on 0.5× MS plus 1% sucrose. Scale bar = 1 cm. f, g Statistical data showing the root phenotypes of seedlings in e. Data represent mean ± SE (n = 25 individual seedlings). In box plots, the center line in each box indicates the median. The lower and upper bounds of each box represent the first quartile (25%) and the third quartile (75%), respectively. The bottom and top of whiskers denote the minimum and maximum, respectively. h Roots under the Stereo Dissecting Microscope after the treatment with N-1-naphthylphthalamic acid (NPA, 10 μM) and then transferred onto 0.5× MS with 1-naphthaleneacetic acid (NAA, 10 μM) for 5 days. Roots were soaked in 100% ethanol for a few seconds to minimize the effect of root hairs in photographing lateral roots. Scale bar = 500 μm. i Percentage of trichome branches on the first pair of rosette leaves from 2-week-old plants cultured in compost. Twenty leaves were used for counting the trichome branching in each line. j m6A levels checked by two-dimensional thin layer chromatography (TLC) analysis. Data represent mean ± SE from three biological replicates. Source data are provided as a Source Data file.

References

    1. Arribas-Hernández L, Brodersen P. Occurrence and functions of m6A and other covalent modifications in plant mRNA. Plant Physiol. 2020;182:79–96. - PMC - PubMed
    1. Huang H, Weng H, Chen J. The biogenesis and precise control of RNA m6A methylation. Trends Genet. 2020;36:46–52. - PMC - PubMed
    1. Bodi Z, et al. Adenosine methylation in Arabidopsis mRNA is associated with the 3′ end and reduced levels cause developmental defects. Front. Plant Sci. 2012;3:48. - PMC - PubMed
    1. Meyer KD, et al. Comprehensive analysis of mRNA methylation reveals enrichment in 3’ UTRs and near stop codons. Cell. 2012;149:1635–1646. - PMC - PubMed
    1. Bokar JA, Rath-Shambaugh ME, Ludwiczak R, Narayan P, Rottman F. Characterization and partial purification of mRNA N6-adenosine methyltransferase from HeLa cell nuclei. Internal mRNA methylation requires a multisubunit complex. J. Biol. Chem. 1994;269:17697–17704. - PubMed

Publication types