. 2022 Mar 2;8(1):19.
doi: 10.1038/s41531-022-00280-4.

A nationwide study of the incidence, prevalence and mortality of Parkinson's disease in the Norwegian population

Affiliations

A nationwide study of the incidence, prevalence and mortality of Parkinson's disease in the Norwegian population

Brage Brakedal et al. NPJ Parkinsons Dis. .

Abstract

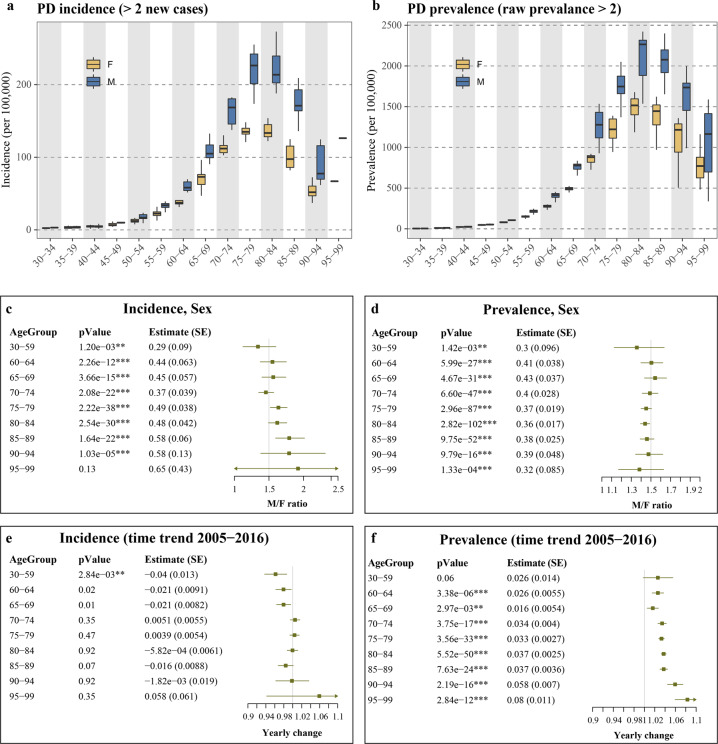
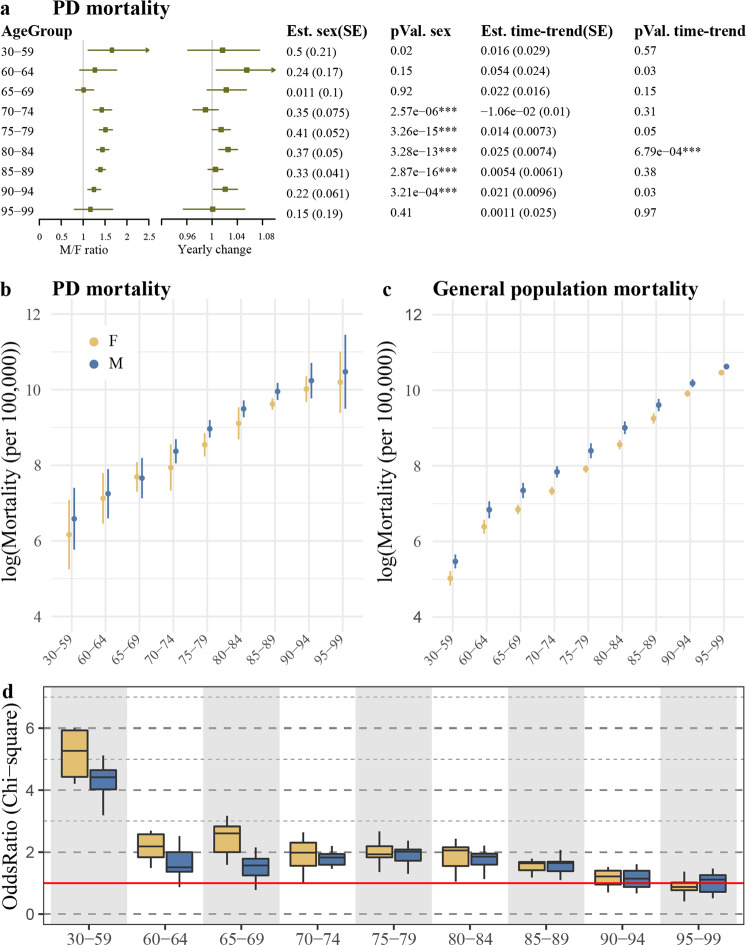
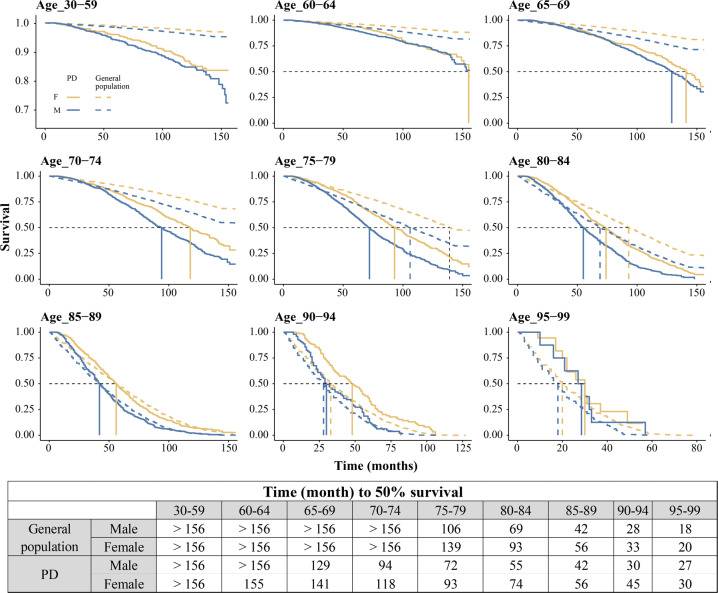
Epidemiological studies of Parkinson's disease (PD) show variable and partially conflicting findings with regard to incidence, prevalence, and mortality. These differences are commonly attributed to technical and methodological factors, including small sample sizes, differences in diagnostic practices, and population heterogeneity. We leveraged the Norwegian Prescription Database, a population-based registry of drug prescriptions dispensed from Norwegian pharmacies to assess the incidence, prevalence, and mortality of PD in Norway. The diagnosis of PD was defined based on the prescription of dopaminergic drugs for the indication of PD over a continuous time. During 2004-2017, 12,229 males and 9831 females met our definition for PD diagnosis. PD prevalence increased over the observation period, with larger changes observed in the older age groups. Incidence and prevalence of PD increased with age, peaking at 85 years. The male/female prevalence ratio was 1.5 across all ages, whereas the incidence ratio increased with age, from 1.4 in those 60 years, to 2.03 among those >90 years. While PD mortality was generally higher than that of the general population, mortality odds ratios decreased with age, approaching 1.0 among individuals >90 years old. When adjusted for the sex-specific mortality of the general population, the mortality among females with PD was equal to or higher than the mortality among males with PD. Our findings demonstrate that the epidemiological features of PD, including sex-differences, are age and time-period dependent and indicate that sex differences in PD mortality are unlikely to stem from disease-specific negative impact of survival in males.


Conflict of interest statement

The authors declare no competing interests.

Figures

Fig. 1
Fig. 1. Incidence and prevalence of PD in the Norwegian population during 2005–2016.
a, b Incidence and prevalence were first calculated for each observation year by dividing the number of new or total PD cases by the corresponding age- and sex-matched population size in the same year. For presentation purposes, the measures were summarized by age groups. Data points for which the number of new cases/raw prevalence were <2, were excluded. X-axis indicates the age group of the individuals. cf The impact of sex (c, d) and time (e, f) were assessed individually for each age group, using Poisson regression. The p-values and the estimates for each covariate are shown in tables (for time trend, the estimate represents the natural log of the estimated change in each sequential year). SE, standard error. M/F ratio and Yearly change were derived by taking the exponential of the estimate for each covariate (sex or year). Lines represent the 95% confidence interval.
Fig. 2
Fig. 2. Mortality of PD in the Norwegian population during 2005–2016.
a The impact of the time period and sex on PD mortality were assessed individually for each age group, using Poisson regression. The p-values and the estimates for each covariate are shown in the tables. SE, standard error. M/F ratio and yearly change were derived by taking the exponential of the estimate for each covariate (sex or year). Lines represent the 95% confidence interval. b, c Natural log of mortality per 100,000 person-years in PD (b) and general population (c). The points indicate the mean mortality during 2005–2016, and the line indicates two standard deviations. d Death odds ratio of individuals with PD compared to general population were calculated for each year, separately for each age group, for females (yellow) and males (blue). Boxplots show the estimated odds ratios of the observation years. Red line indicates odds ratio of 1. The estimated odds ratio and the 95% confidence intervals for each observation year are shown in Supplementary Fig. 3.
Fig. 3
Fig. 3. Survival analysis showing sex differences.
Kaplan–Meier survival curves for males (blue) and females (yellow) with PD (solid line) and general population (dashed line) in Norway 2005–2017. In both sexes, the differences in survival between individuals with PD and general population is only apparent among individuals with diagnosis age <85. Black dashed line represents 50% survival.

References

    1. Dorsey ER, et al. Global, regional, and national burden of Parkinson’s disease, 1990–2016: a systematic analysis for the Global Burden of Disease Study 2016. Lancet Neurol. 2018;17:939–953. - PMC - PubMed
    1. de Rijk MC, et al. Prevalence of Parkinson’s disease in Europe: a collaborative study of population-based cohorts. Neurologic Diseases in the Elderly Research Group. Neurology. 2000;54:S21–S23. - PubMed
    1. Abbas MM, Xu Z, Tan LC. Epidemiology of Parkinson’s disease—East versus West. Mov. Disord. Clin. Pract. 2018;5:14–28. - PMC - PubMed
    1. Marras C, et al. Prevalence of Parkinson’s disease across North America. NPJ Parkinson’s Dis. 2018;4:1–7. - PMC - PubMed
    1. Ascherio A, Schwarzschild MA. The epidemiology of Parkinson’s disease: risk factors and prevention. Lancet Neurol. 2016;15:1257–1272. - PubMed